To make it easier for you to view and stay up to date with how instances work, TencentDB for SQL Server provides a wide variety of performance monitoring metrics and convenient monitoring features (custom view, time comparison, merged monitoring metrics, etc.).
This document describes how to view monitoring chart info in the console.
Note:
If the number of tables in a single instance exceeds one million, database monitoring may be affected. Make sure that the number of tables in a single instance is below one million.
Types of instances for monitoring
TencentDB for SQL Server primary and read-only instances can be monitored, and each instance is provided with a separate monitoring view for easy query.
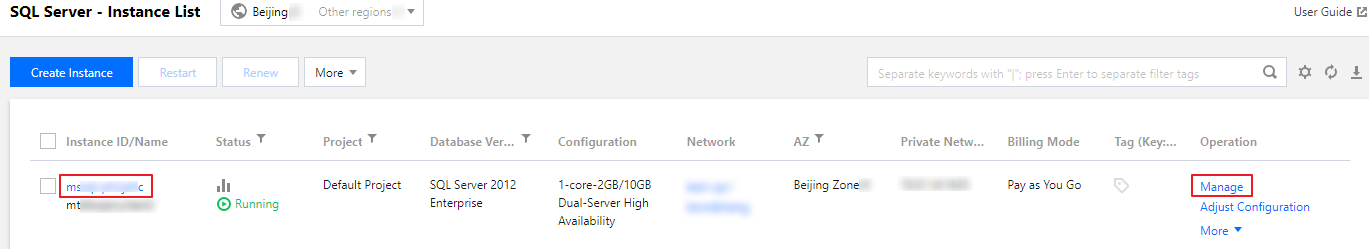
2. Select the region at the top, find the target instance, and click the target instance ID or Manage in the Operation column to enter the instance management page.
3. On the instance management page, select the System Monitoring page to view monitoring metrics.
Note:
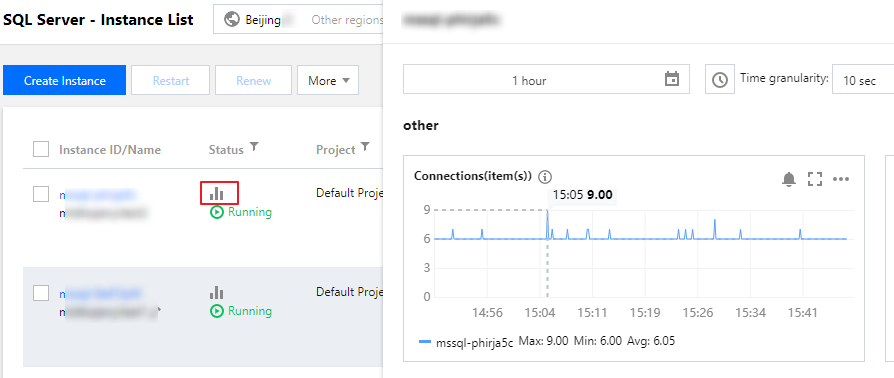
On the instance list, you can also click the monitoring icon of the target instance to quickly view its monitoring status.
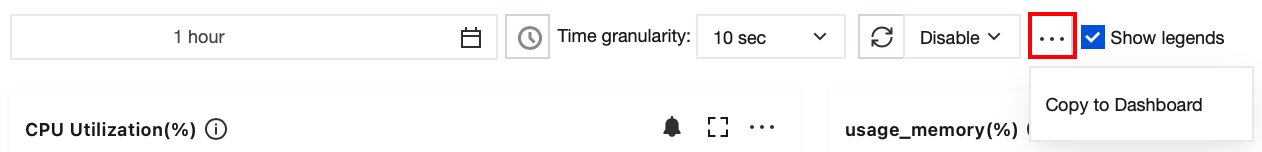
Copying Charts to Dashboards
You can copy monitoring charts of instances to dashboards for visualization and analysis, which makes the monitoring data more intuitive. For the dashboard definition, see Overview. Go to the System Monitoring page, click the icon in front of Display Legends, and click Copy to Dashboard. Displaying a chart in full screen
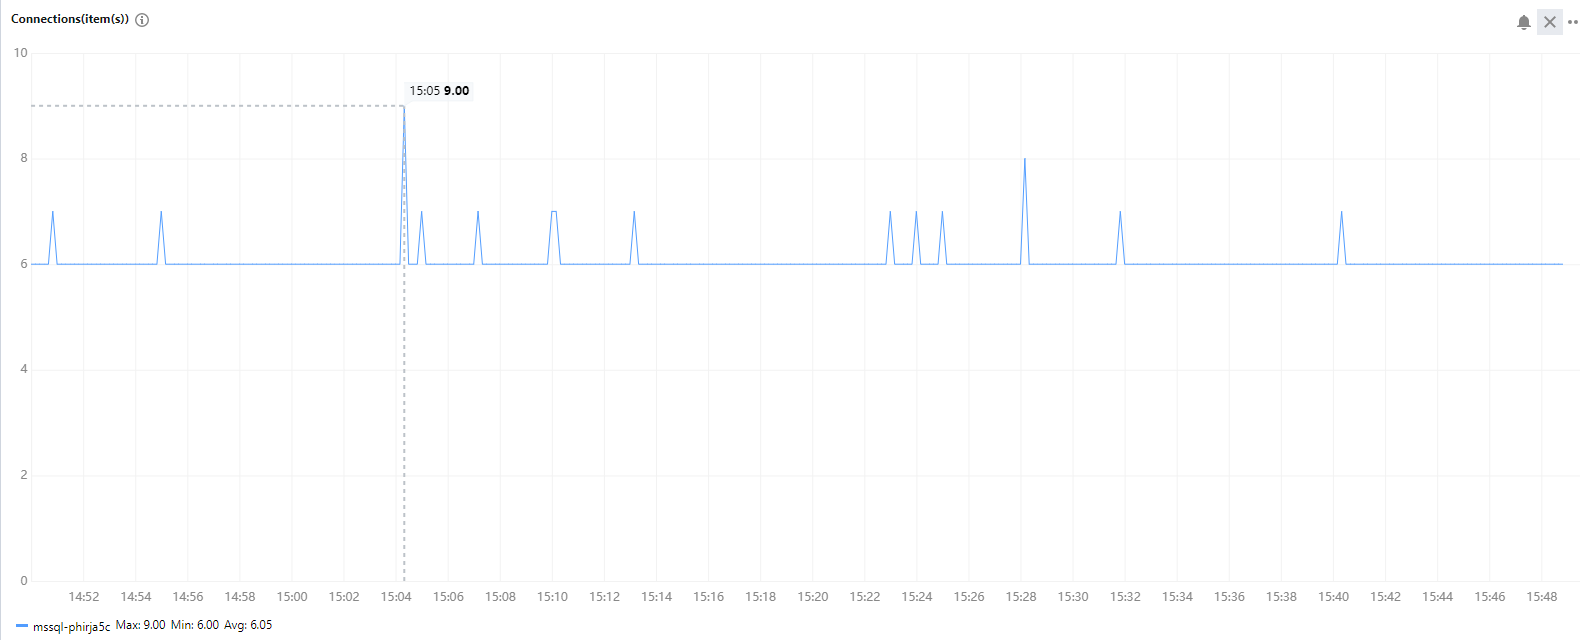
You can display a single metric in full screen for a clearer preview of metric data.
1. On the System Monitoring page, you can click icon on the right of the corresponding metric to display the metric in full screen. 2. After the preview data is displayed in full screen, you can click the icon in the upper right corner to close the full screen display window. Exporting data
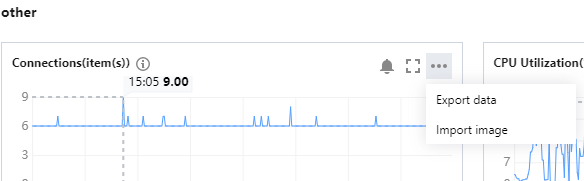
You can export the desired metric data individually.
On the System Monitoring page, you can click icon on the right of the corresponding metric to export data or pictures of the metric to the local system. Selecting monitoring time range
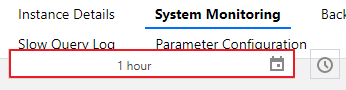
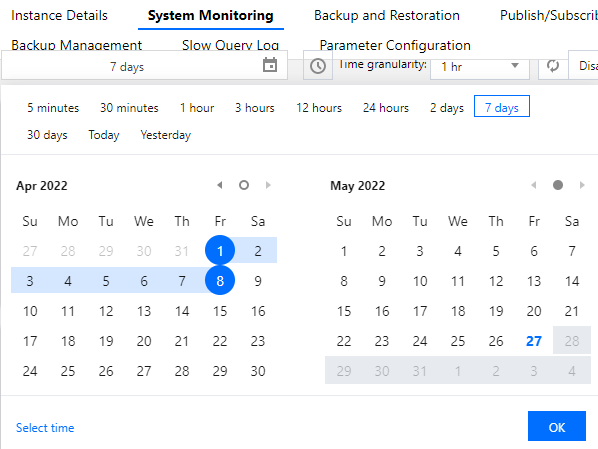
You can select or customize a time range to query the monitoring over this time period.
2. In the pop-up window, you can select 5 minutes, 30 minutes, 1 hour, 3 hours, 12 hours, 24 hours, 2 days, 7 days, 30 days, today, yesterday, the start and end date, or the time range of them, then click OK.
Adding time comparison
You can compare monitoring data from multiple time ranges by adding time comparisons.
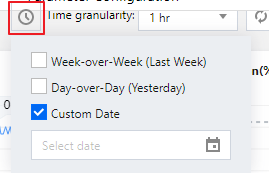
1. On [System Monitoring] page, click Add Time icon behind time box.
2. Select Week-over-Week(Last Week), Day-over-Day (Yesterday), or Custom Date from the drop-down list to compare the monitoring data within the corresponding time range.
Monitoring granularity
You can view instance monitoring at different time granularities within the selected time period.
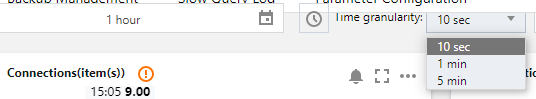
On [System Monitoring] page, select the time period, and then you can select the desired time granularity in the drop-down list after Time Granularity to view the monitoring data.
Time Periods and Corresponding Chart Granularities
|
| |
| 10 seconds, 1 minute, 5 minutes |
| 10 seconds, 1 minute, 5 minutes, 1 hour |
12 hours, today, yesterday | 1 minute, 5 minutes, 1 hour |
| 1 minute, 5 minutes, 1 hour, 24 hours |
| |
Setting refresh time
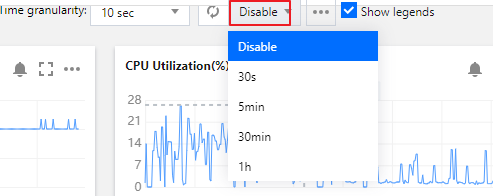
You can set the refresh time on the system monitoring page (disabled by default) to observe changes of instance monitoring in real time.
Go to the System Monitoring page, click the drop-down button next to to set the time frequency of data refresh, which can be 30 seconds, 5 minutes, 30 minutes, and 1 hour.