2. Select Queue Service on the left sidebar, select a Region, and click the ID of the target queue to enter the queue details page.
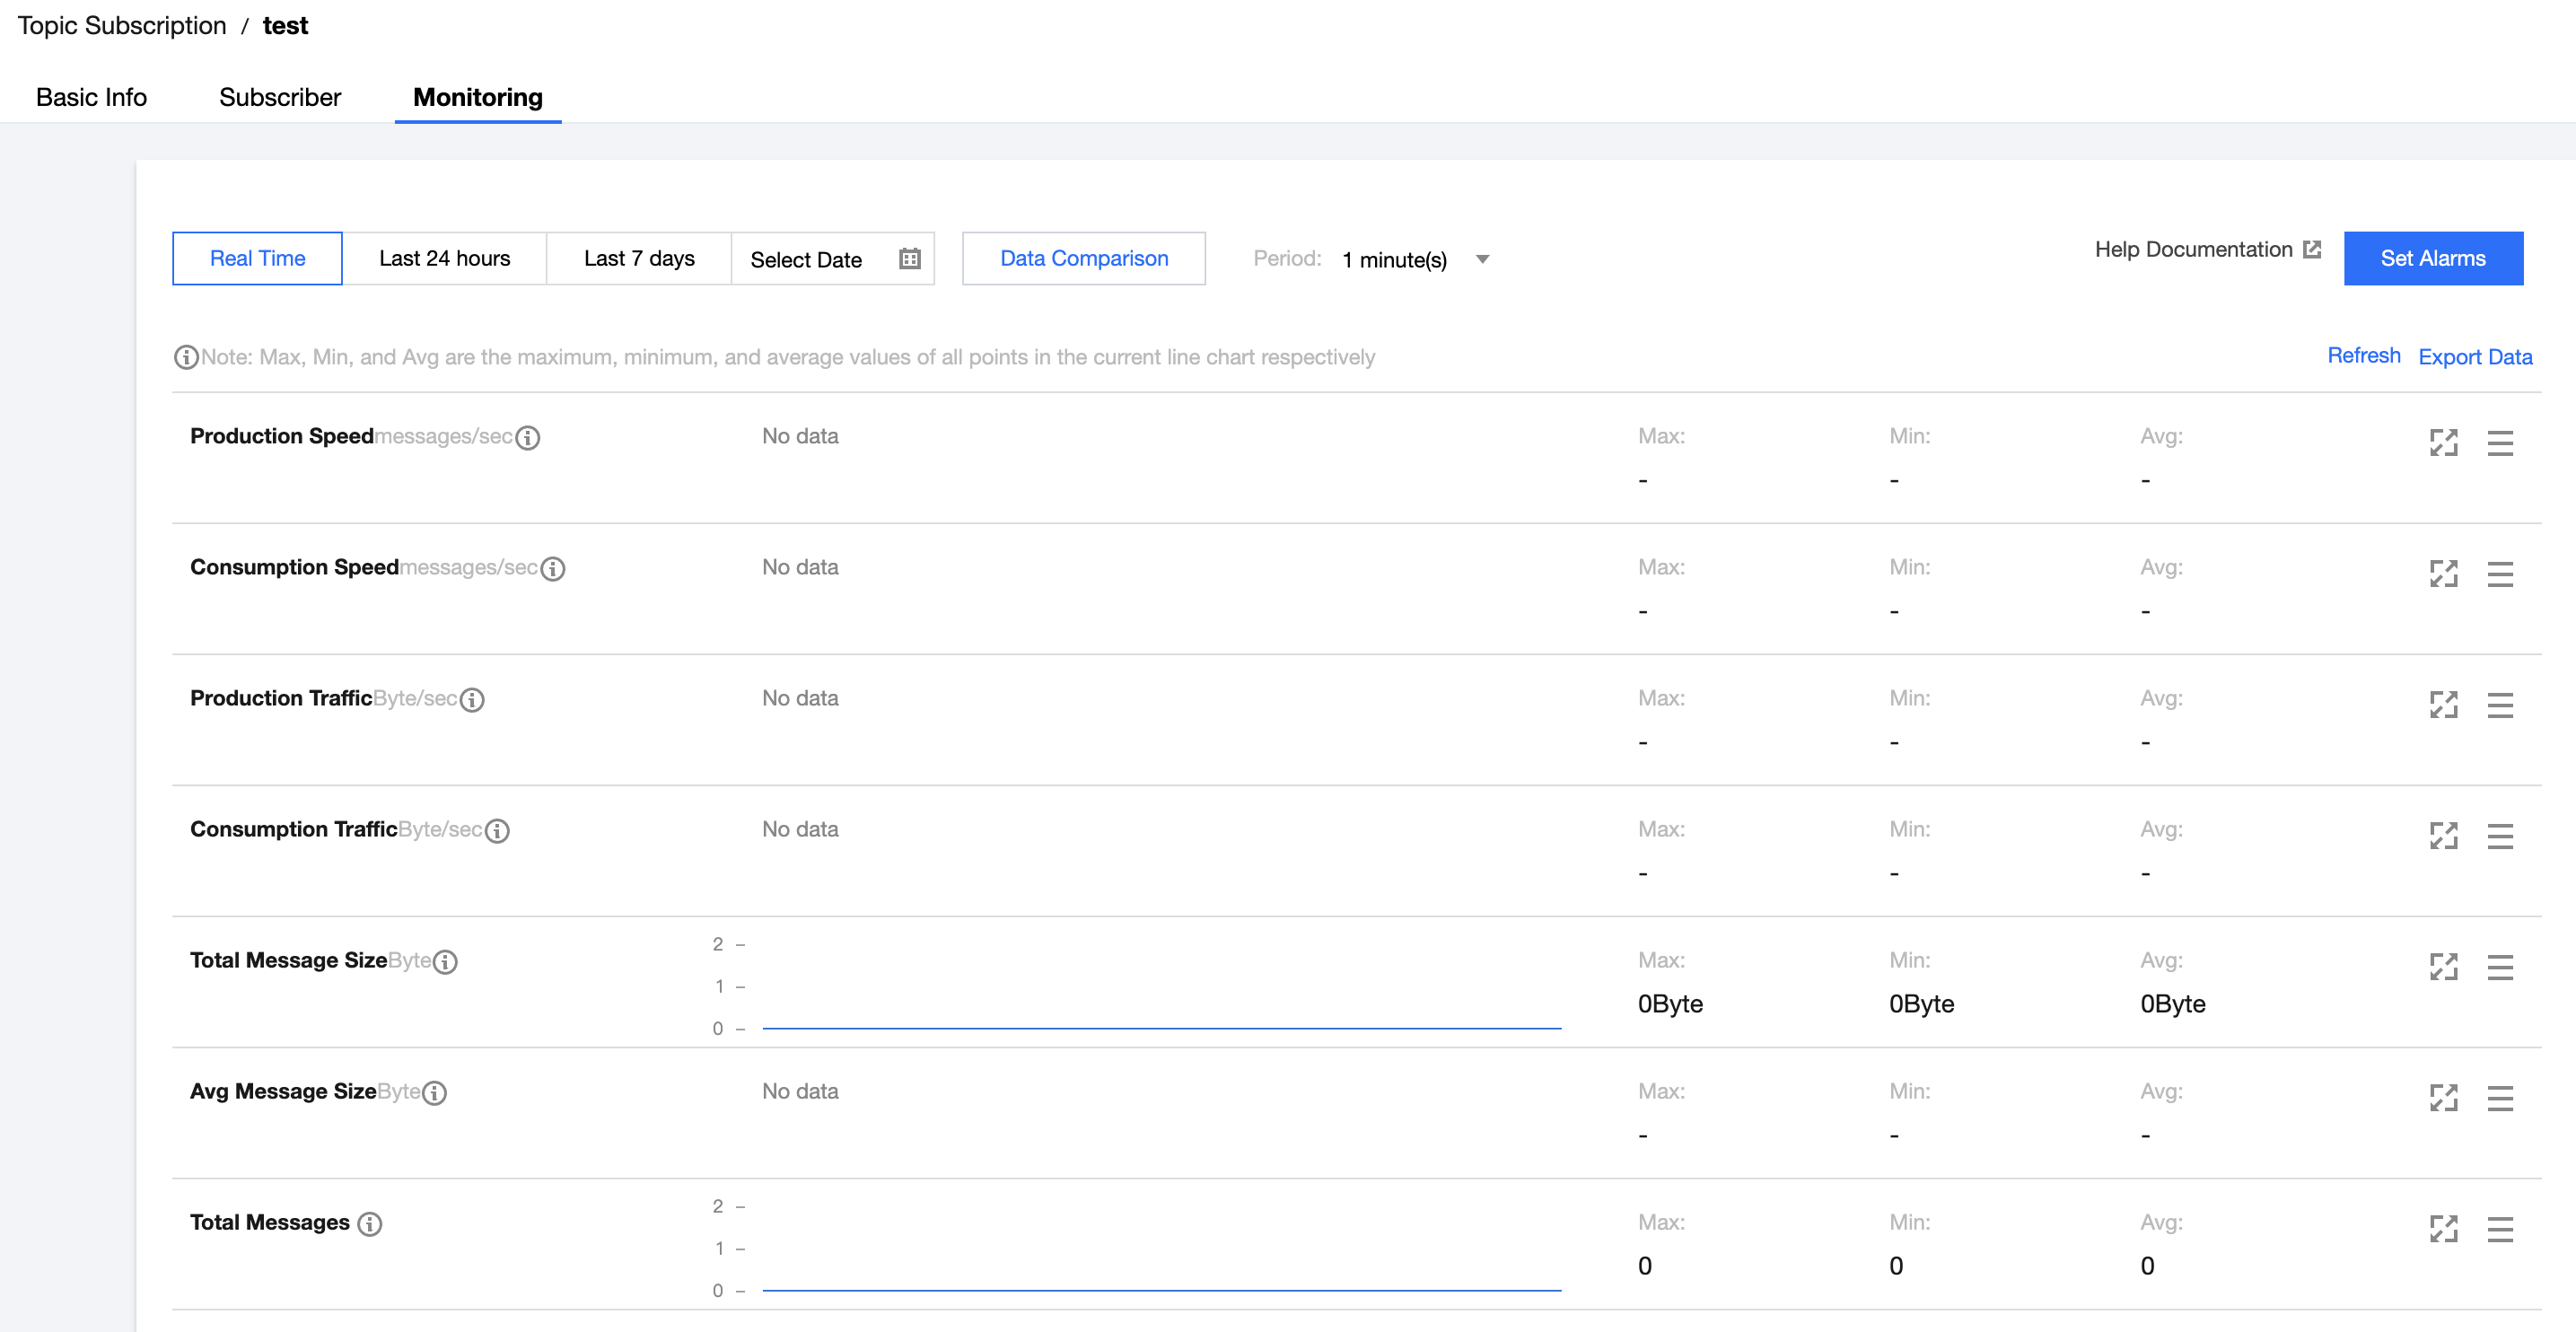
3. On the queue details page, select the Monitoring tab at the top and select a time range to view the monitoring data of the queue.
Monitoring metric description
Monitoring Metric
Description
Heaped messages
Activemessages, which indicates the total number of messages that are in “Active” status in the queue in the selected time range. The metric value is approximate.
Invisible messages
A message will be made invisible (in “Inactive” status) after being fetched by the consumer. It will become visible (in “Active” status) again if it is not consumed after the VisibilityTimeout.
Production rate (messages/sec)
The number of messages produced by all producers in the queue per second in the selected time range.
Production rate (messages/sec)
The number of messages consumed by all consumers in the queue per second in the selected time range.
Production traffic (bytes/sec)
The size of messages produced by all producers in the queue per second in the selected time range.
Consumption traffic (bytes/sec)
The size of messages consumed by all consumers in the queue per second in the selected time range.