This document introduces how to query and download slow log details via the console.
Note:
Slow logs for TDSQL Boundless are retained for 7 days by default. To retain slow logs for a longer period, you can deliver them to CLS for storage.
Querying Slow Logs
1. Log in to the TDSQL Boundless console. In the Instance List, click the Instance ID to go to the Instance Management page. Then, choose the Log Center> Slow Log Details tab.
2. On the Slow Log Details list, you can query slow log details within a custom time range.
3. The system supports searching key fields (Client Address, Username, Database Name) to quickly filter target slow log details. It also supports exporting the list file.
4. Click
in the upper-right corner of the list. In the Display Settings dialog box that appears, you can select to display more fields. For a complete field description, see Slow Log Fields.
5. On the slow log details list, you can view detailed information. For specific fields, see Slow Log Fields.
Slow Log Fields
The slow log details list displays nine core fields by default: execution time, SQL statement, client address, username, database name, execution duration (s), lock duration (s), rows parsed, and rows returned.
To troubleshoot issues such as RPC links, transactions, or execution plans, click
in the upper-right corner of the list. In the Custom List Fields dialog box, select the extended fields you need, such as TraceId, Transaction ID, RpcTime(s), StorageRpcTime(s), TDStoreLockTime(s), RpcRetryDelayTime(s), RpcTrace, and Explain. The meanings of these fields are shown in the following table.
Chinese Name
Description
Execution Time
Execution time, example: 2024/9/22 23:56:12.
SQL Statement
The executed SQL statement, example: DROP DATABASE IF EXISTS db1.
Client Address
The client address from which the operation was performed.
Username
The username that performed the operation, example: root.
Database name
Database name, example: mysql.
Execution Duration (s)
SQL execution time, unit: seconds.
Lock Duration (s)
The total time spent from the start of lock waiting to the actual acquisition of the lock and completion of the operation, unit: seconds.
Parsed Rows
The number of rows successfully parsed and processed during query or operation execution.
Returned Rows
The number of rows actually returned to the client after query or operation execution.
TraceId
The full-link trace ID, used to identify a complete request link, can reliably correlate logs of the same request across different components, facilitating the location of the complete execution path of slow SQL.
Transaction ID
The transaction ID of the SQL statement. All SQL statements within a transaction share the same transaction ID.
RpcTime(s)
The total duration of RPC calls during SQL statement execution, unit: seconds.
StorageRpcTime(s)
The total time spent on all RPC communications between compute and storage during SQL statement execution, unit: seconds.
TDStoreLockTimes(s)
The storage lock waiting time, which is the time spent by the storage system waiting for locks during SQL statement execution, unit: seconds.
RpcRetryDelayTime(s)
The total time spent waiting for RPC retry intervals during SQL statement execution, unit: seconds.
RpcTrace
RPC access details, which include the time consumption details of all RPC accesses during the entire SQL execution process, example:
The actual execution plan used when the SQL statement is recorded in the slow log.
Download Slow Logs Details
1. Log in to the TDSQL Boundless console. In the Instance List, click the Instance ID to go to the Instance Management page.
2. Navigate to the Log Center> Slow Log Details tab. You can query the required slow log details by filtering by time or searching key fields. Then, click
.
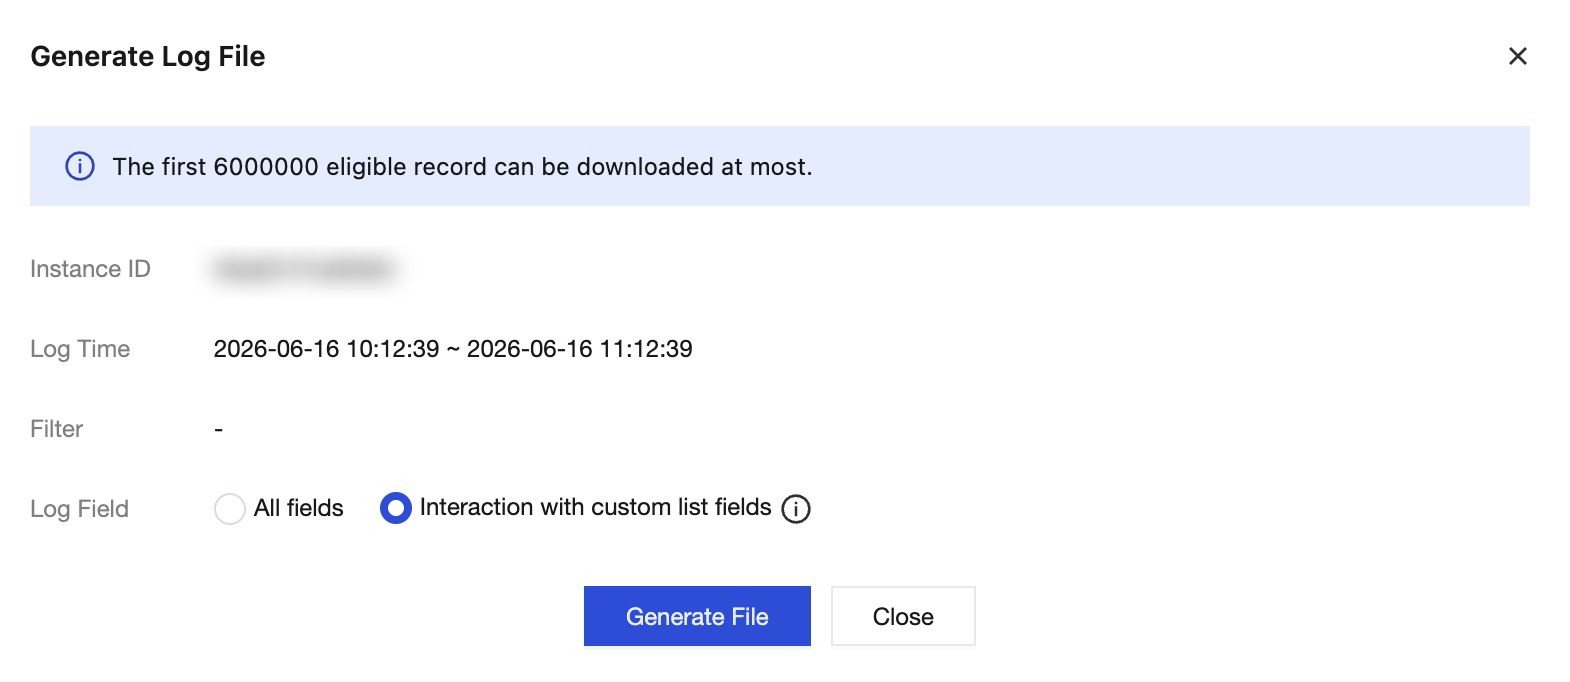
3. In the pop-up window, select the range of fields to export. After confirming, click Generate File. The system will then create an asynchronous slow log packaging task.
All fields: Export all fields from the logs.
Interaction with custom list fields: it exports the fields selected in the custom list, which are the slow log fields already displayed on the console.
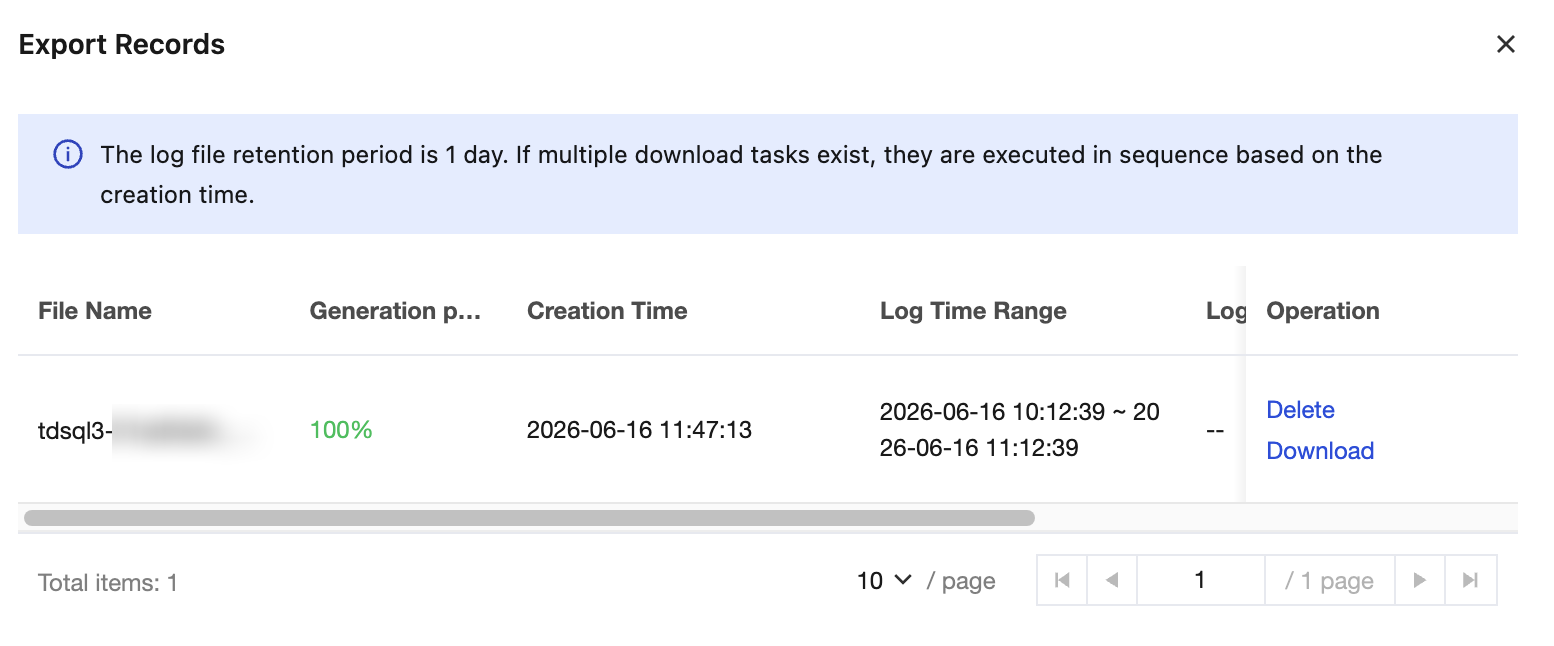
4. Click
. In the Export Records pop-up box, you can view the execution status of the slow log packaging task submitted in the previous step. When the Generation progress is displayed as 100%, click Download to export the log file. If you no longer need it, you can also click Delete.