TencentDB for MongoDB supports viewing various monitoring metrics, helping you stay informed about the operational status and performance of your database resources in a timely manner, enabling proactive forecasting and risk prevention. It is primarily used in the following key scenarios:
Key Scenario
Scenario Description
Metrics to View
Routine Ops and health checks
As a routine task, periodically check whether the database is running in a healthy state.
CPU utilization, memory utilization, disk utilization, connection utilization, inbound/outbound traffic, and so on.
Performance bottleneck analysis and tuning
When the business reports that the system is slow or times out, quickly locate whether the performance bottleneck originates from the CPU, disk, network, or slow log query, to provide direction for subsequent optimization.
Latency monitoring, slow log query, network traffic, request volume, and so on.
Capacity planning and AS
Before major business promotions (such as Double 11) or during periods of sustained business growth, evaluate whether existing resources are sufficient to support future business volume.
Disk utilization growth trend, memory utilization trend, number of connections growth trend, and so on.
Troubleshooting and root cause analysis
After a database exception occurs (such as connection failure and slow response), trace back the resource state at the time the problem occurred. Correlate the fault symptom with specific resource metrics (such as CPU 100% and memory exhaustion) to locate the root cause.
Check the "peak" and "inflection point" of all core metrics at the abnormal time point to assist in locating the anomaly.
Feature Description
Feature
Description
Viewing Monitoring Metrics in the Instance List
On the Instance List page, you can quickly get an overview of the core running status of instances. The main features include:
Core Metrics Overview: Directly view key metrics such as CPU utilization, memory usage, disk I/O, network traffic, and request latency for each instance to quickly grasp the overall operational status of the instance.
Multi-Instance Comparison: It supports displaying monitoring data from multiple instances on the same screen via the Dashboard, facilitating performance trend comparison and load analysis to quickly identify exceptions or resource usage discrepancies.
Metric Threshold Alarms: You can configure threshold rules for instance-level monitoring metrics. The system automatically sends an alarm when conditions are triggered, enabling proactive discovery and timely response to potential risks.
Viewing Monitoring Metrics in the System Monitoring
On the System Monitoring page, you can deeply view detailed runtime data at the instance cluster and node levels. It supports the following operations:
Cluster-Level Monitoring: It provides an aggregated monitoring view at the cluster level, centrally displaying core metrics such as CPU, memory, disk, network, request volume, and request latency, facilitating an understanding of the overall operational status of the database.
Node-Level Monitoring: It supports drilling down to each primary/secondary node to independently view its CPU, memory, disk, kernel status, network throughput, and request processing details, enabling fine-grained problem localization.
Data Comparison: It supports flexible data comparison modes, including comparison with the same period last week (year-over-year) and the same period yesterday (day-over-day), as well as custom time period comparison, facilitating the analysis of metric fluctuation trends and abnormal situations.
Data Export: It supports exporting monitoring data to common formats (such as CSV) for offline deep analysis and report generation.
Full-Screen View: It allows you to display monitoring charts in full screen with one click, facilitating presentations or focused analysis of data trends.
Alarm Settings: It supports configuring alarm thresholds independently for each monitoring metric, achieving refined monitoring and precise notifications to enhance Ops response efficiency.
2. In the MongoDB drop-down list on the left sidebar, select Replica Set Instance or Shard Instance. The directions for the two types of instances are similar.
3. On the instance list page on the right, select a region.
4. In the instance list, find the target instance.
5. In the Monitoring/Status column of the target instance, click
to quickly view the instance's core metrics in the instance monitoring panel.
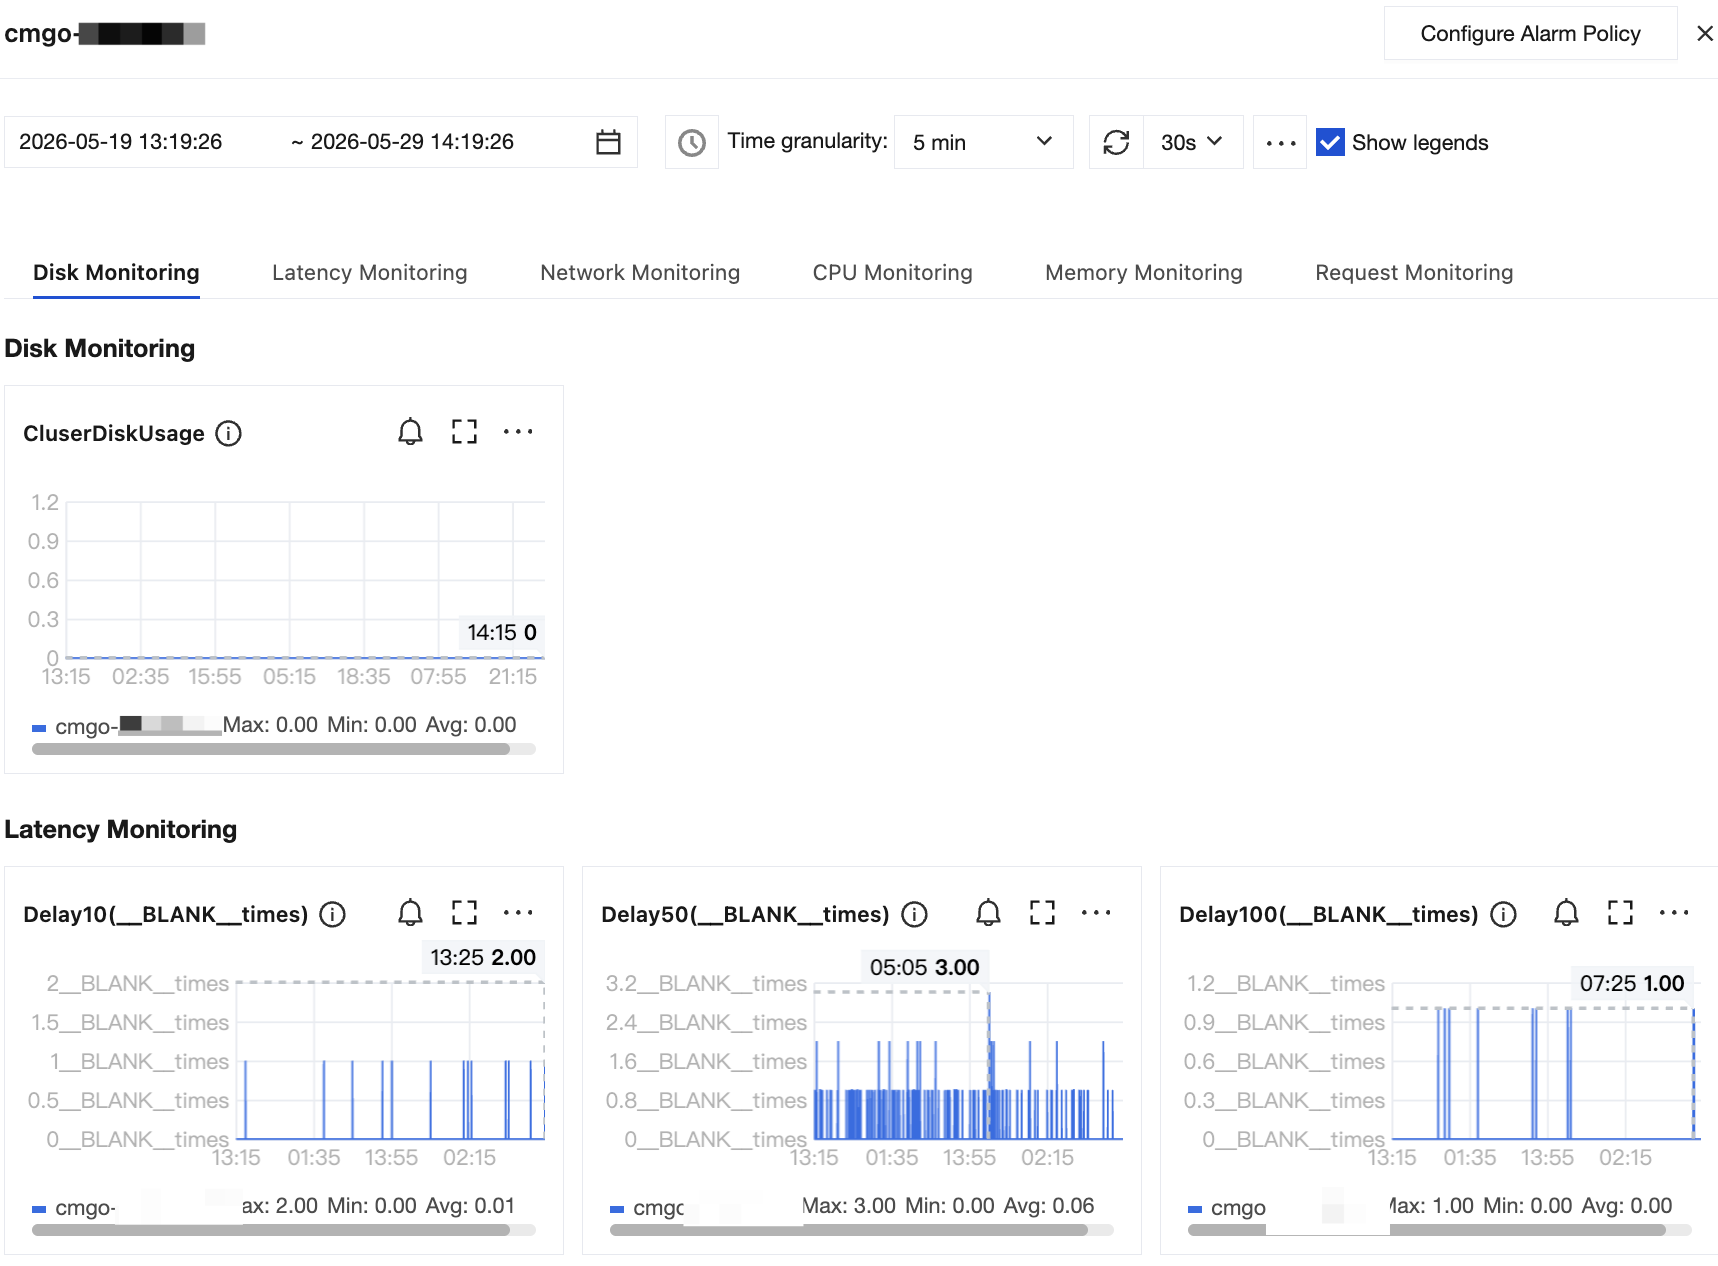
5.1 Select Viewing Time Period: It supports directly selecting Real-time, Last 24 Hours, or Last 7 Days, or specifying a specific time range in Select Date.
5.2 Select Time Granularity: You can select 5 seconds, 1 minute, 5 minutes, or 1 day to view monitoring data at different time precisions. The data retention period for the monitoring feature varies by time granularity. For details, see Monitoring Overview.
5.3 Select Monitoring Dimensions: They include CPU monitoring, memory monitoring, disk monitoring, latency monitoring, request monitoring, and request volume.
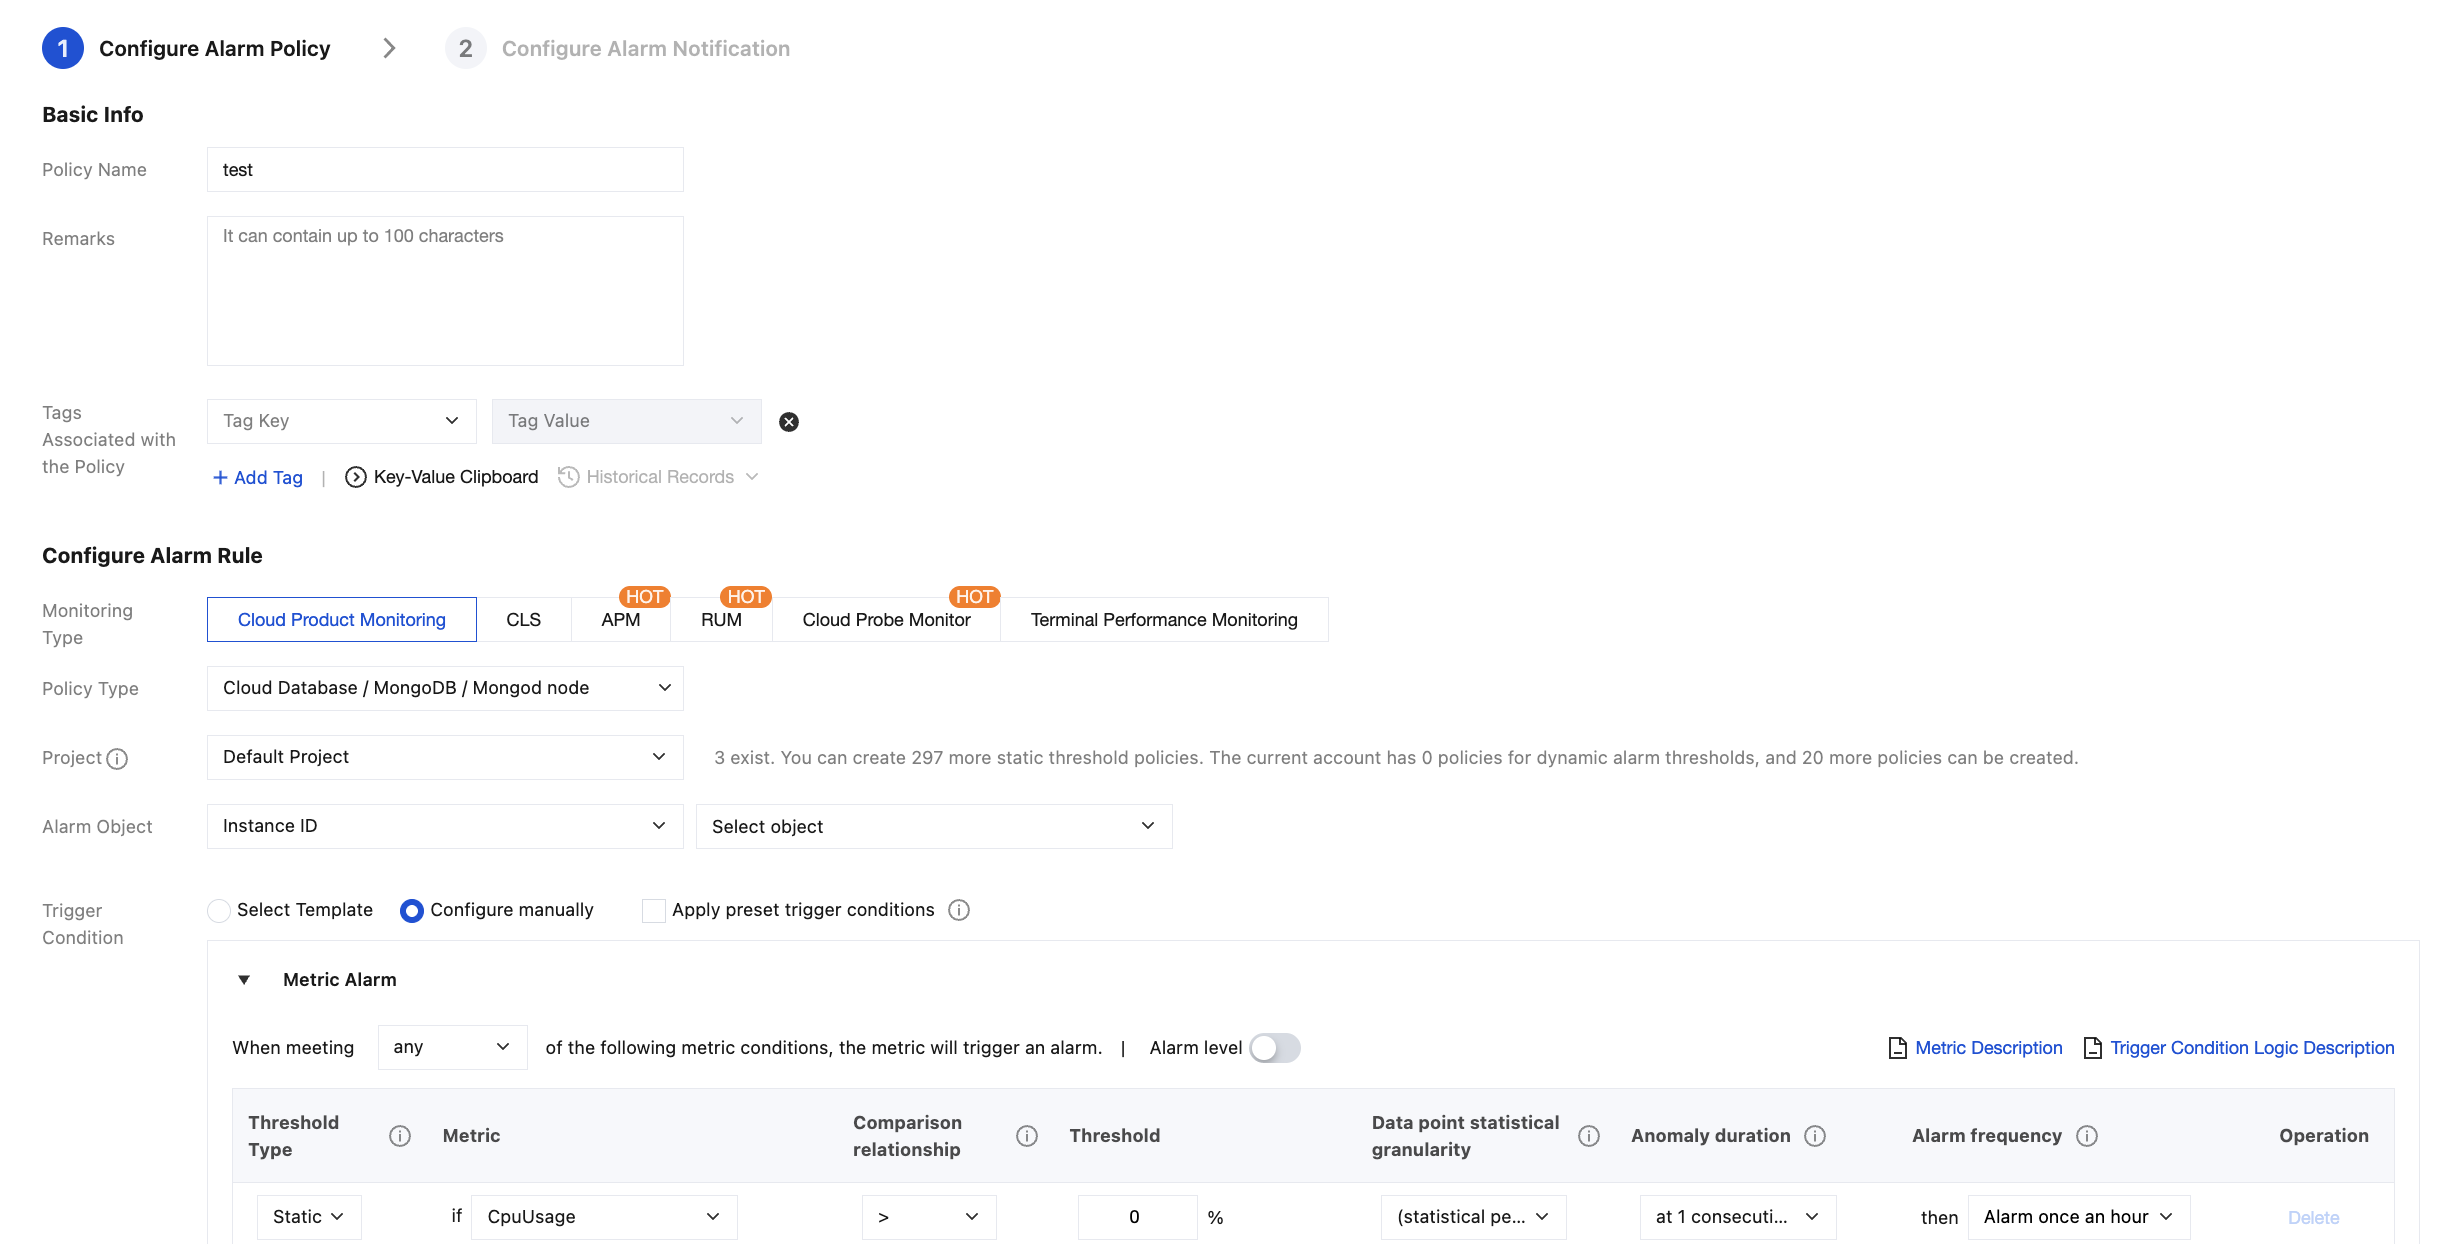
5.4 Configure Threshold Alarm: Click Configure Alarm Policy to go to the Alarm configuration page in Tencent Cloud Observability Platform (TCOP). Select the alarm object, set the trigger conditions for the monitoring metrics, and configure the alarm notification method. For detailed operations, see Create Alarm Policy.
2. Click the target instance ID to enter the Instance Details page.
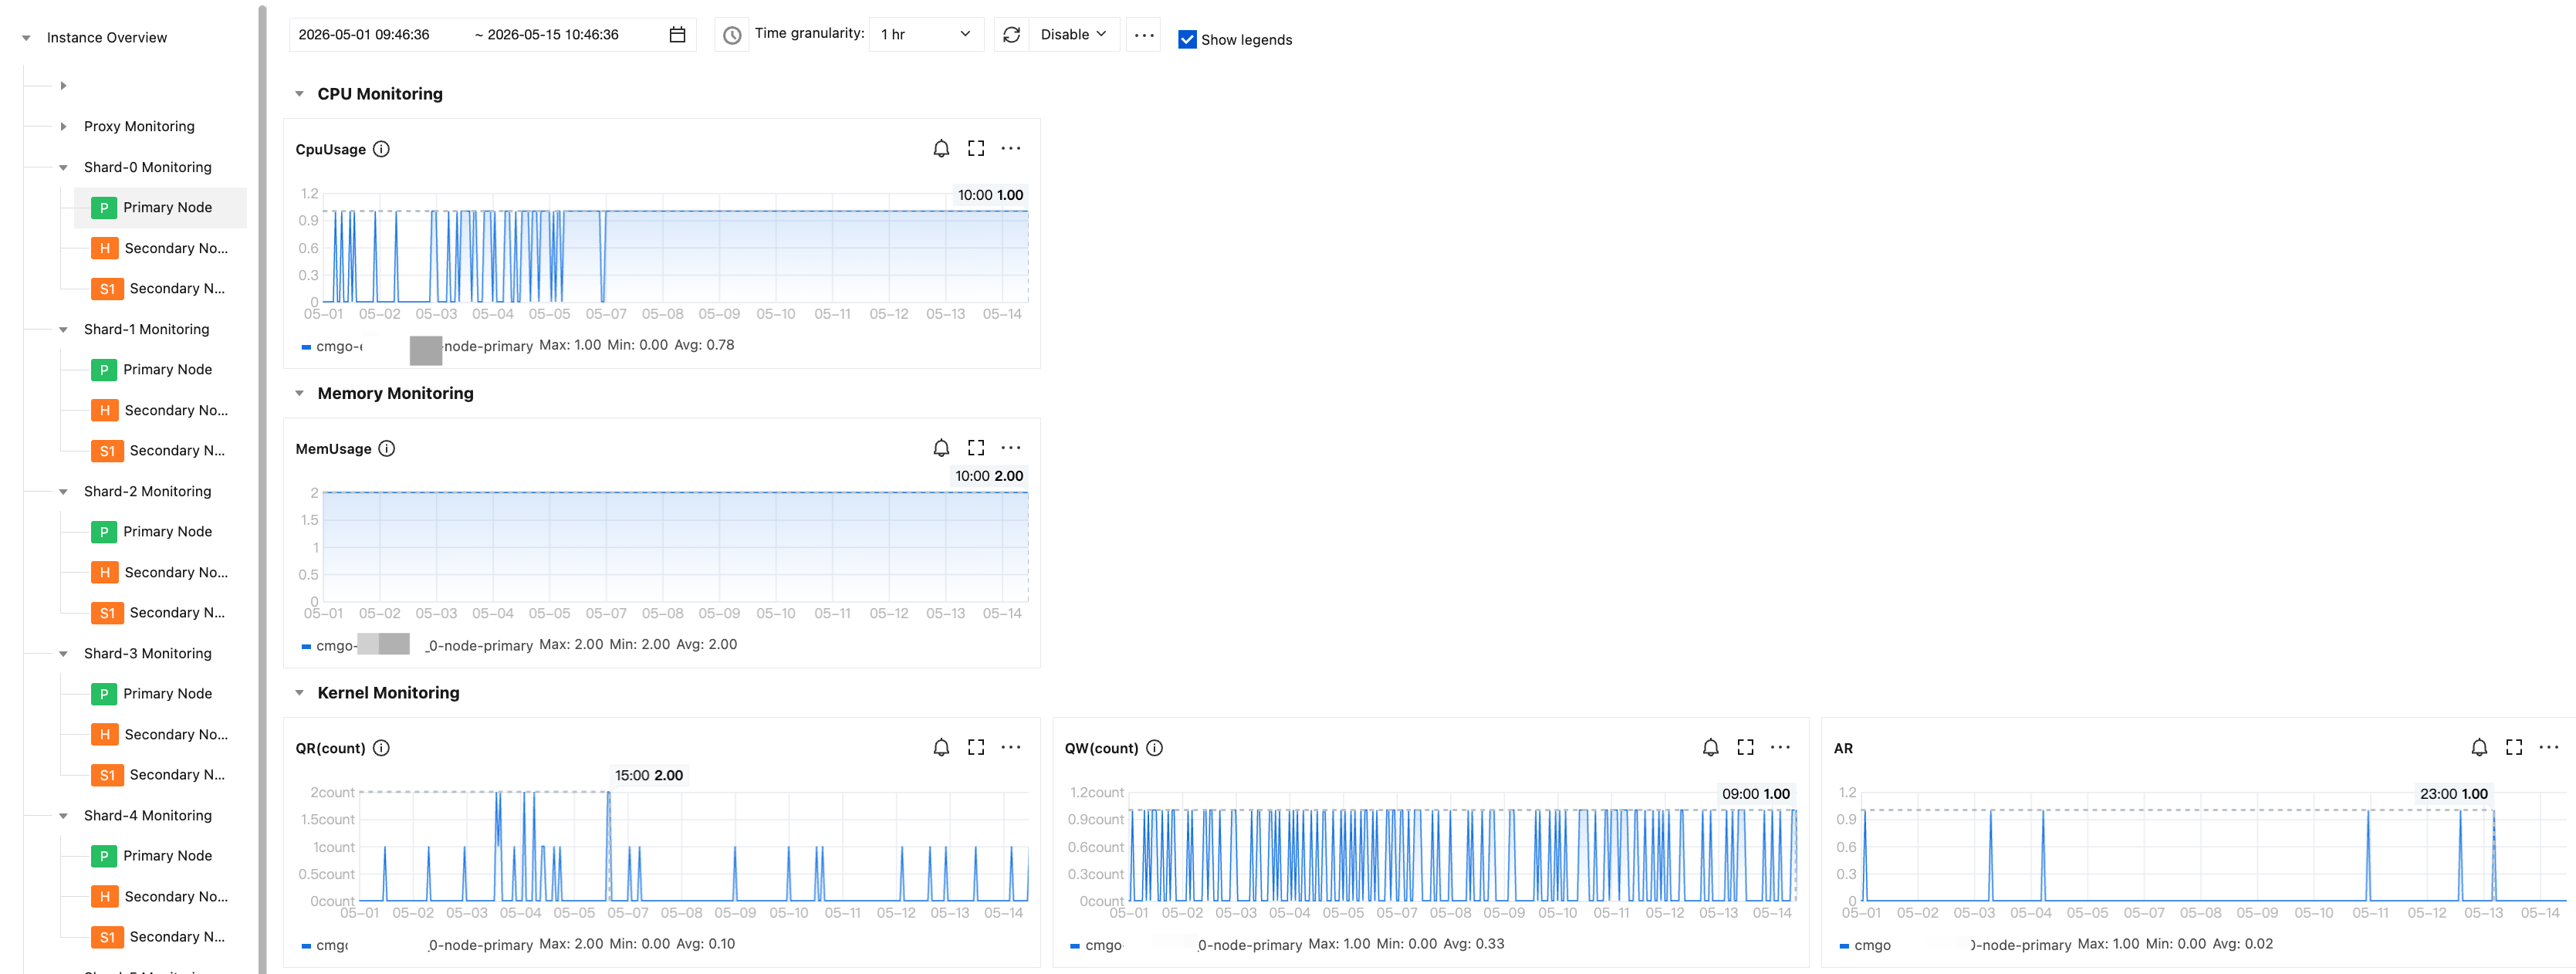
3. Click the System Monitoring tab to view the change trend of each monitoring metric of the entire cluster as shown below (with a replica set instance as an example):
Action
Description
Selecting the object to view
Cluster Metrics: The page displays the monitoring metrics of the entire instance cluster by default, covering six core dimensions: CPU, memory, disk, latency, requests, and network.
Node Metrics: Building upon instance monitoring, it supports drilling down to the node level to view comprehensive metrics including CPU, memory, kernel, network, disk, request volume, and average request latency, enabling fine-grained observation of the database's operational status.
Replica Set Instance Node Monitoring: Within the navigation hierarchy of Cluster Overview, you can further select the primary node (Primary) or secondary node (Secondary) to view their independent performance metrics and operational status, facilitating master-slave synchronization analysis or read/write load observation.
Shard Instance Node Monitoring: Within the navigation hierarchy of Instance Overview, you can further select the following three types of core nodes to view their respective monitoring views.
ConfigServer Node: Including its primary/secondary nodes, it monitors the storage and service status of configuration metadata, covering metrics such as CPU, memory, network, and kernel.
Proxy Node: It monitors the status of request routing, connections, and load balancing, and includes metrics such as CPU, memory, latency, requests, and network.
Shard Node: Drill down to view the resource usage and request processing status of the primary/secondary nodes for each data shard. This includes metrics such as CPU, memory, network, kernel, disk, request volume, and average request latency.
Setting the query time range
Click
to set the monitoring time range for viewing.
Setting the time comparison mode
Click
to select the time comparison mode. Multiple time comparison modes are supported. By comparing trends, you can quickly locate metric anomalies and business fluctuations.
Year-over-Year (Same Period Last Week): It compares data with that from the same time period last week. For example, if you are currently viewing data from Wednesday 10:00-11:00 this week, the system will simultaneously display data from Wednesday 10:00-11:00 last week for comparison. This is primarily used to analyze the periodic patterns of the business.
Month-over-Month (Same Period Yesterday): It compares data with that from the same time period yesterday. For example, if you are currently viewing data from today 14:00-15:00, the system will simultaneously display data from yesterday 14:00-15:00. This is primarily used to analyze short-term fluctuations in the business and quickly identify deviations from recent norms.
Custom Date Comparison: It allows you to freely select data from one or several historical dates for comparison. This method offers maximum flexibility and is suitable for in-depth analysis of the impact before and after specific events, such as version releases or promotional activities.
Setting the time granularity
In the time granularity drop-down list, you can select 5 seconds, 1 minute, 5 minutes, or 1 day. Time granularity determines the precision of monitoring data: selecting a smaller granularity (such as 5 seconds) can capture instantaneous fluctuations, which is suitable for fine-grained troubleshooting; selecting a larger granularity (such as 1 day) is used for observing long-term trends, facilitating capacity planning.
5 Seconds: Achieves second-level problem localization and real-time fault troubleshooting.
1 Minute: Enables short-term problem analysis and performance tracking over several hours.
5 Minutes: Supports routine Ops and observation of daily-level trends.
1 Day: Supports long-term capacity planning and weekly/monthly/quarterly trend and usage analysis.
Viewing the monitoring metric view
1. View: The monitoring view intuitively displays the maximum, minimum, and average values of metrics within a time period. Hover your mouse over a curve on the chart to precisely view the specific value and timestamp of any data point.
2. Configure Metric Alarm: Click
to go to the Create Alarm Policy page in TCOP, where you can configure a threshold alarm for this metric. For detailed operations, see Configure Alarm.
3. Full-Screen View: Click
to instantly display the current view in full screen, providing a clearer visual focus.
4. Export Data: Click
. Select Data Export to export raw monitoring data for local processing. Alternatively, select Image Export to save the visualized chart as an image for direct use in reports or presentations.