Slow Log Query
다운로드
포커스 모드
폰트 크기
Background
The slow log is an important tool for performance monitoring and optimization of MongoDB databases. It records database operations whose execution time exceeds the specified threshold. By analyzing the slow log, developers and operations personnel can identify performance bottlenecks in the system, providing a critical reference for optimizing business operations. For more information about slow logs, see the official documentation.
Query Method
Slow Log Statistics
Aggregates and analyzes slow logs. The system groups slow logs from the specified time period by operation type and counts the average execution time and execution count for each operation type. This helps identify the main types of performance bottlenecks.
Slow Log Details
Provides a detailed list of slow logs. Displays the complete command statement, execution time, client address, and other original information for each slow query. This is used to analyze the root cause of specific slow queries.
Notes
It is recommended to regularly analyze slow logs, focusing on high-frequency slow query operations. Combine business scenarios for targeted index optimization and query statement improvements to enhance the overall database performance.
Recording Rules
The system automatically records database operations with execution time exceeding 100 milliseconds.
Slow log data is retained for 7 days. Please query and analyze important logs in a timely manner.
Query Limits
The time span for a single query cannot exceed 1 day.
Query results return up to the first 10,000 slow log records.
If query response is slow, it is recommended to narrow the query time range to improve query efficiency.
Operation Steps
1. Log in to the TencentDB for MongoDB console.
2. In the left sidebar, choose Replica Set Instance or Shard Instance from the MongoDB dropdown list. The operations for replica set instances and shard instances are similar.
3. Select a region at the top of the instance list page on the right.
4. Locate the target instance in the instance list.
5. Click the target instance ID to go to the Instance Details page.
6. Select the Log Management tab. On the Slow Log Query page, select a Query Method.
7. When Query Method is Slow log statistics, as shown in the following figure. In the Query Time Period section, select the time interval during which the slow logs to be queried were generated. In the Time Consumed dropdown, choose the threshold for the operation request execution time. Supported options are: >=100 ms, >=500 ms, >=2500 ms, and >=5000 ms.
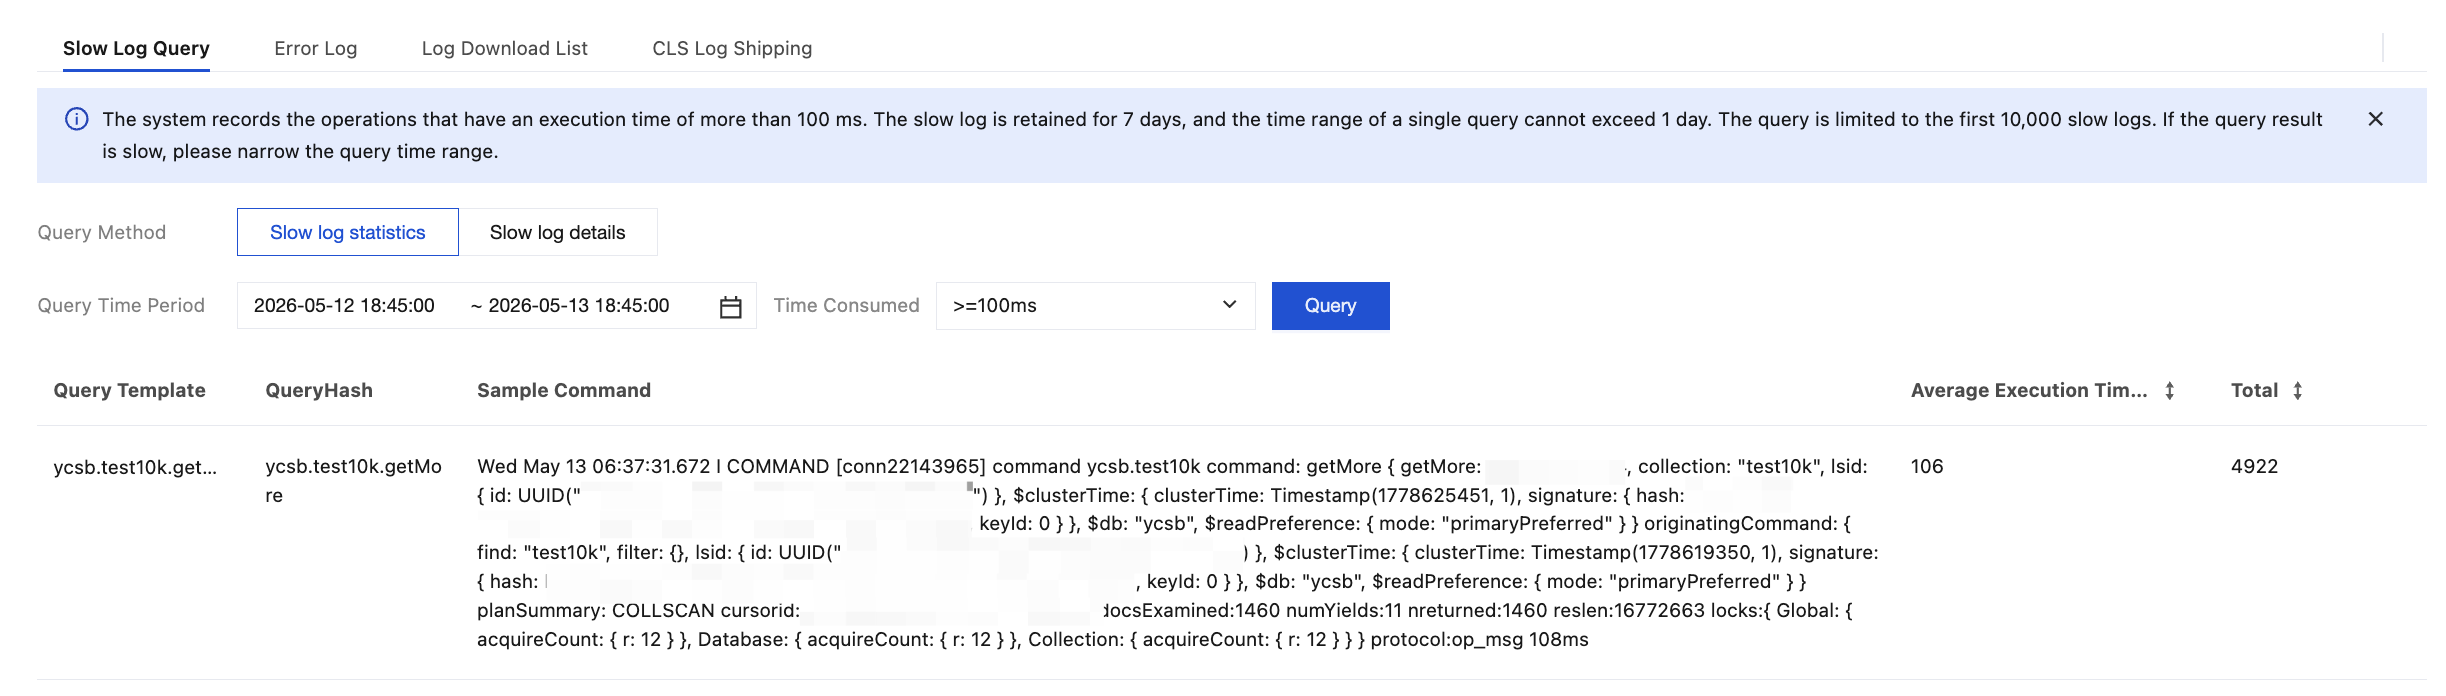
Parameter Name | Parameter Description |
Query Template | Identifies the database table information and operation commands generated by the slow log. Format: database.collection.operation. |
QueryHash | The hash identifier of the query statement, used to identify queries of the same pattern. |
Sample Command | The slow log sample of the query template, which shows the specific operation information of the query. |
Average Execution Time (ms) | The average time consumed by executing the query template. |
Total | The total number of times the query template is executed. |
8. When Query Method is Slow log details, as shown in the following figure. In the Query Conditions section, select the specific node and the command to be queried. Then, in the Query Time Period section, select the time interval during which the slow logs to be queried were generated. In the Time Consumed dropdown, select the threshold for the operation request execution time. Supported options are: >=100 ms, >=500 ms, >=2500 ms, and >=5000 ms.
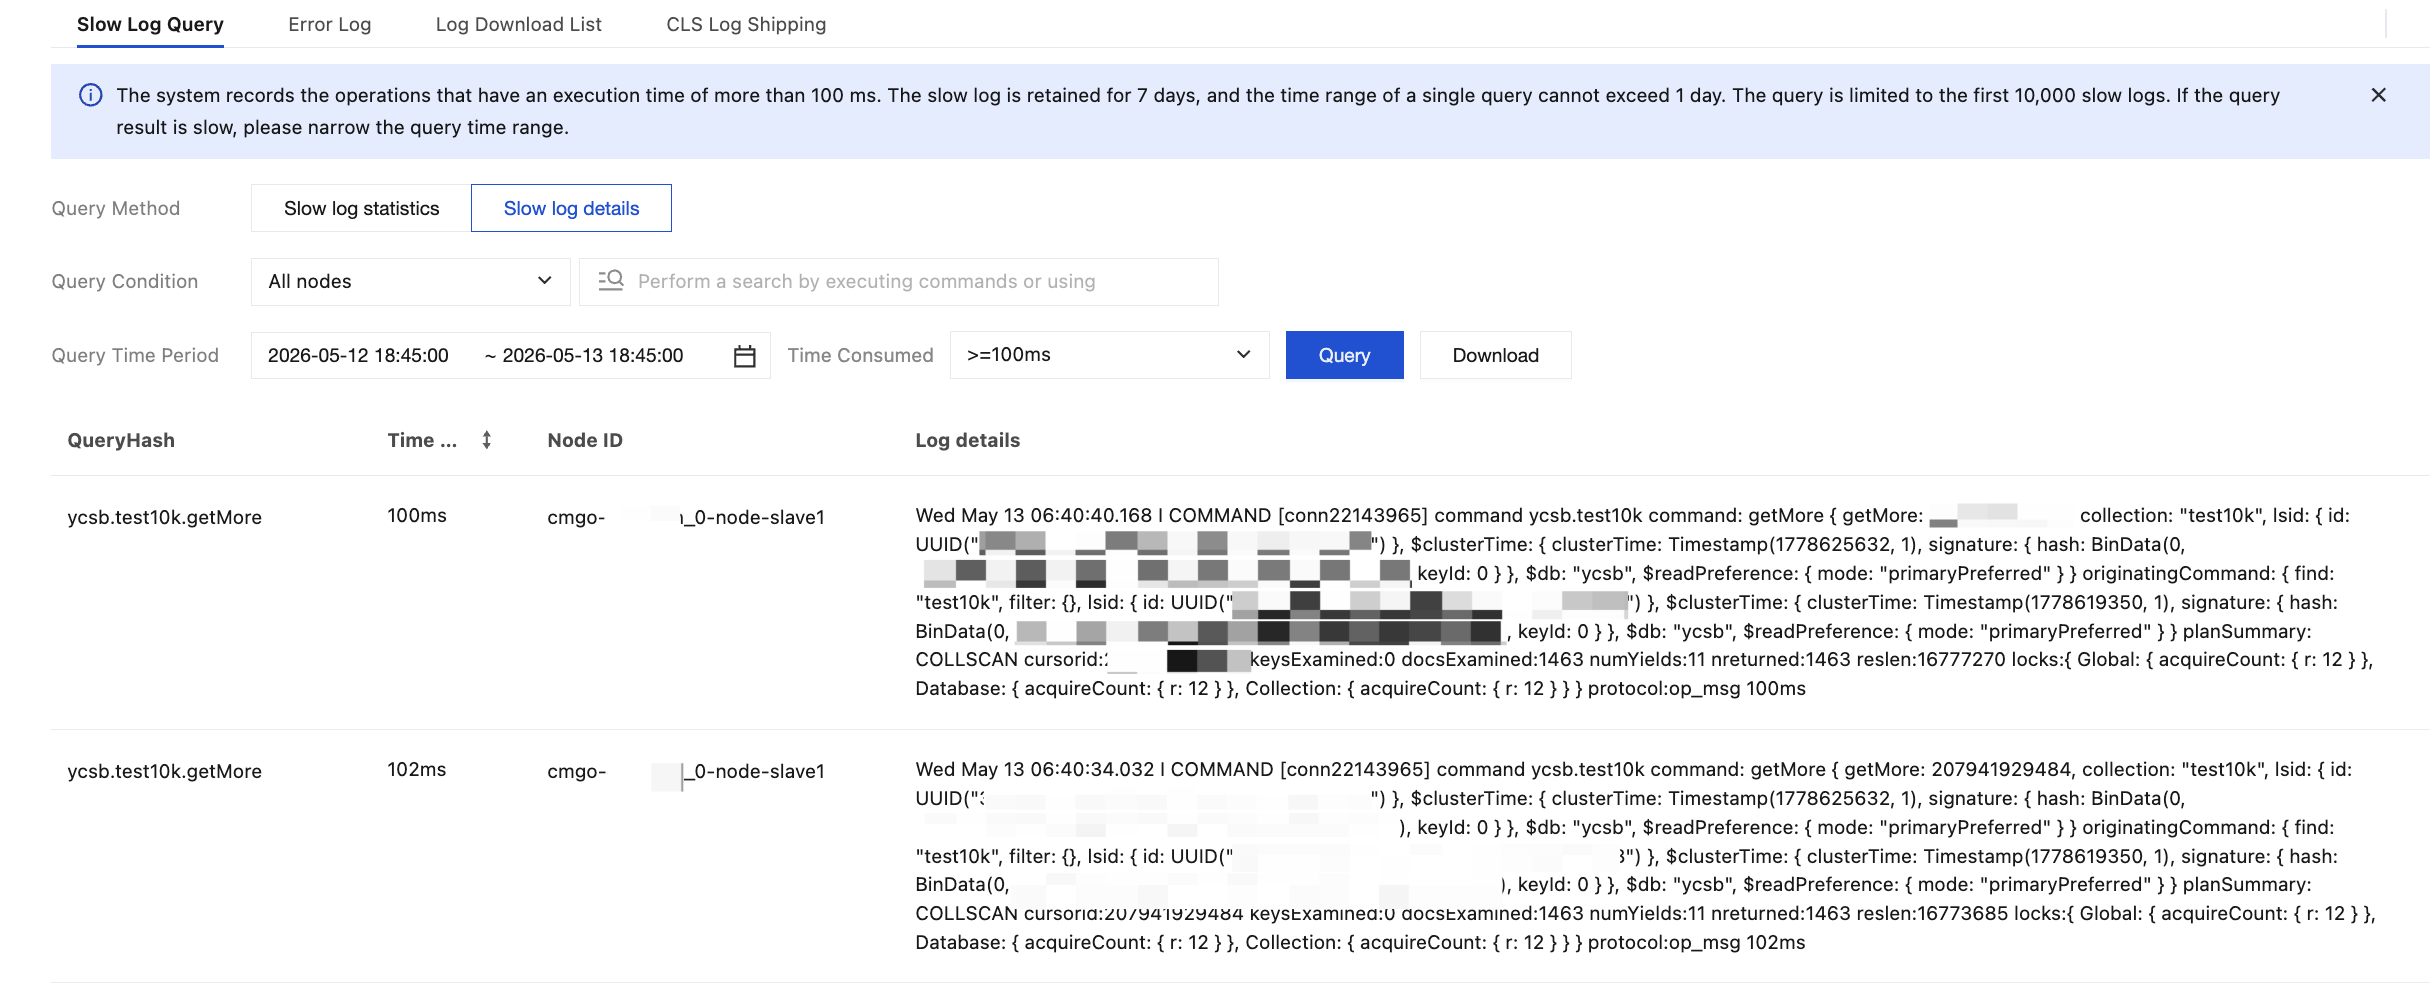
Parameter Name | Parameter Description |
QueryHash | A hash identifier for the query statement, used to identify queries with the same pattern. |
Time consumed | The execution time of the query command, in milliseconds. |
Node ID | The ID of the specific node queried. |
Log details | Detailed slow log information. |
Related APIs
API | API Description |
DescribeSlowLogs | |
DescribeSlowLogPatterns |
피드백