Configuring Log Collection for a Self-Built K8s Cluster Using the Console
Download
포커스 모드
폰트 크기
마지막 업데이트 시간: 2026-06-25 19:20:00
AI 번역
This document describes how to configure log collection rules for a self-built K8s environment in the console and ship logs to Tencent Cloud CLS.
Use Cases
The self-built K8s log collection feature is a tool provided for users to collect logs from non-Tencent Cloud Kubernetes clusters. It can send logs from services within the cluster or from files at specific paths on cluster nodes to Tencent Cloud CLS. This feature is suitable for users who need to store and analyze service logs within Kubernetes clusters.
The log collection feature must be manually enabled and configured with collection rules for each cluster. After the feature is enabled, the log collection Agent runs within the cluster as a DaemonSet. Based on the collection source, CLS log topic, and log parsing method configured in the log collection rules, it collects logs from the source and sends the log content to the log consumer. You can follow the steps below to enable the log collection feature.
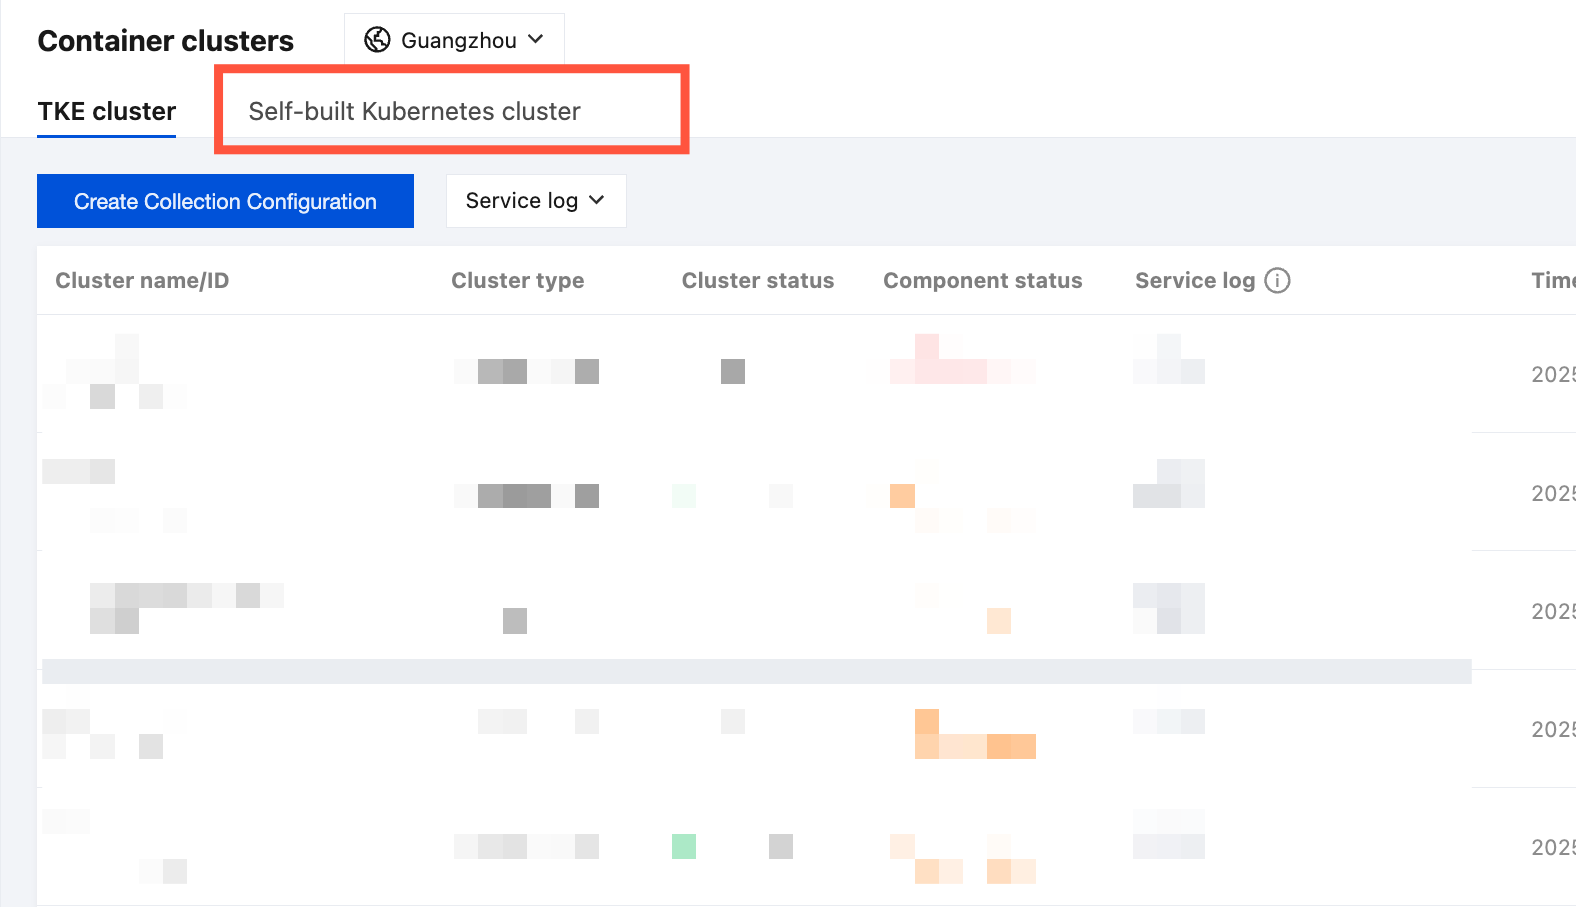
5. Click Create Collection Configuration on the right to go to the cluster log collection configuration process.
Step 2: Configuring a Log Topic
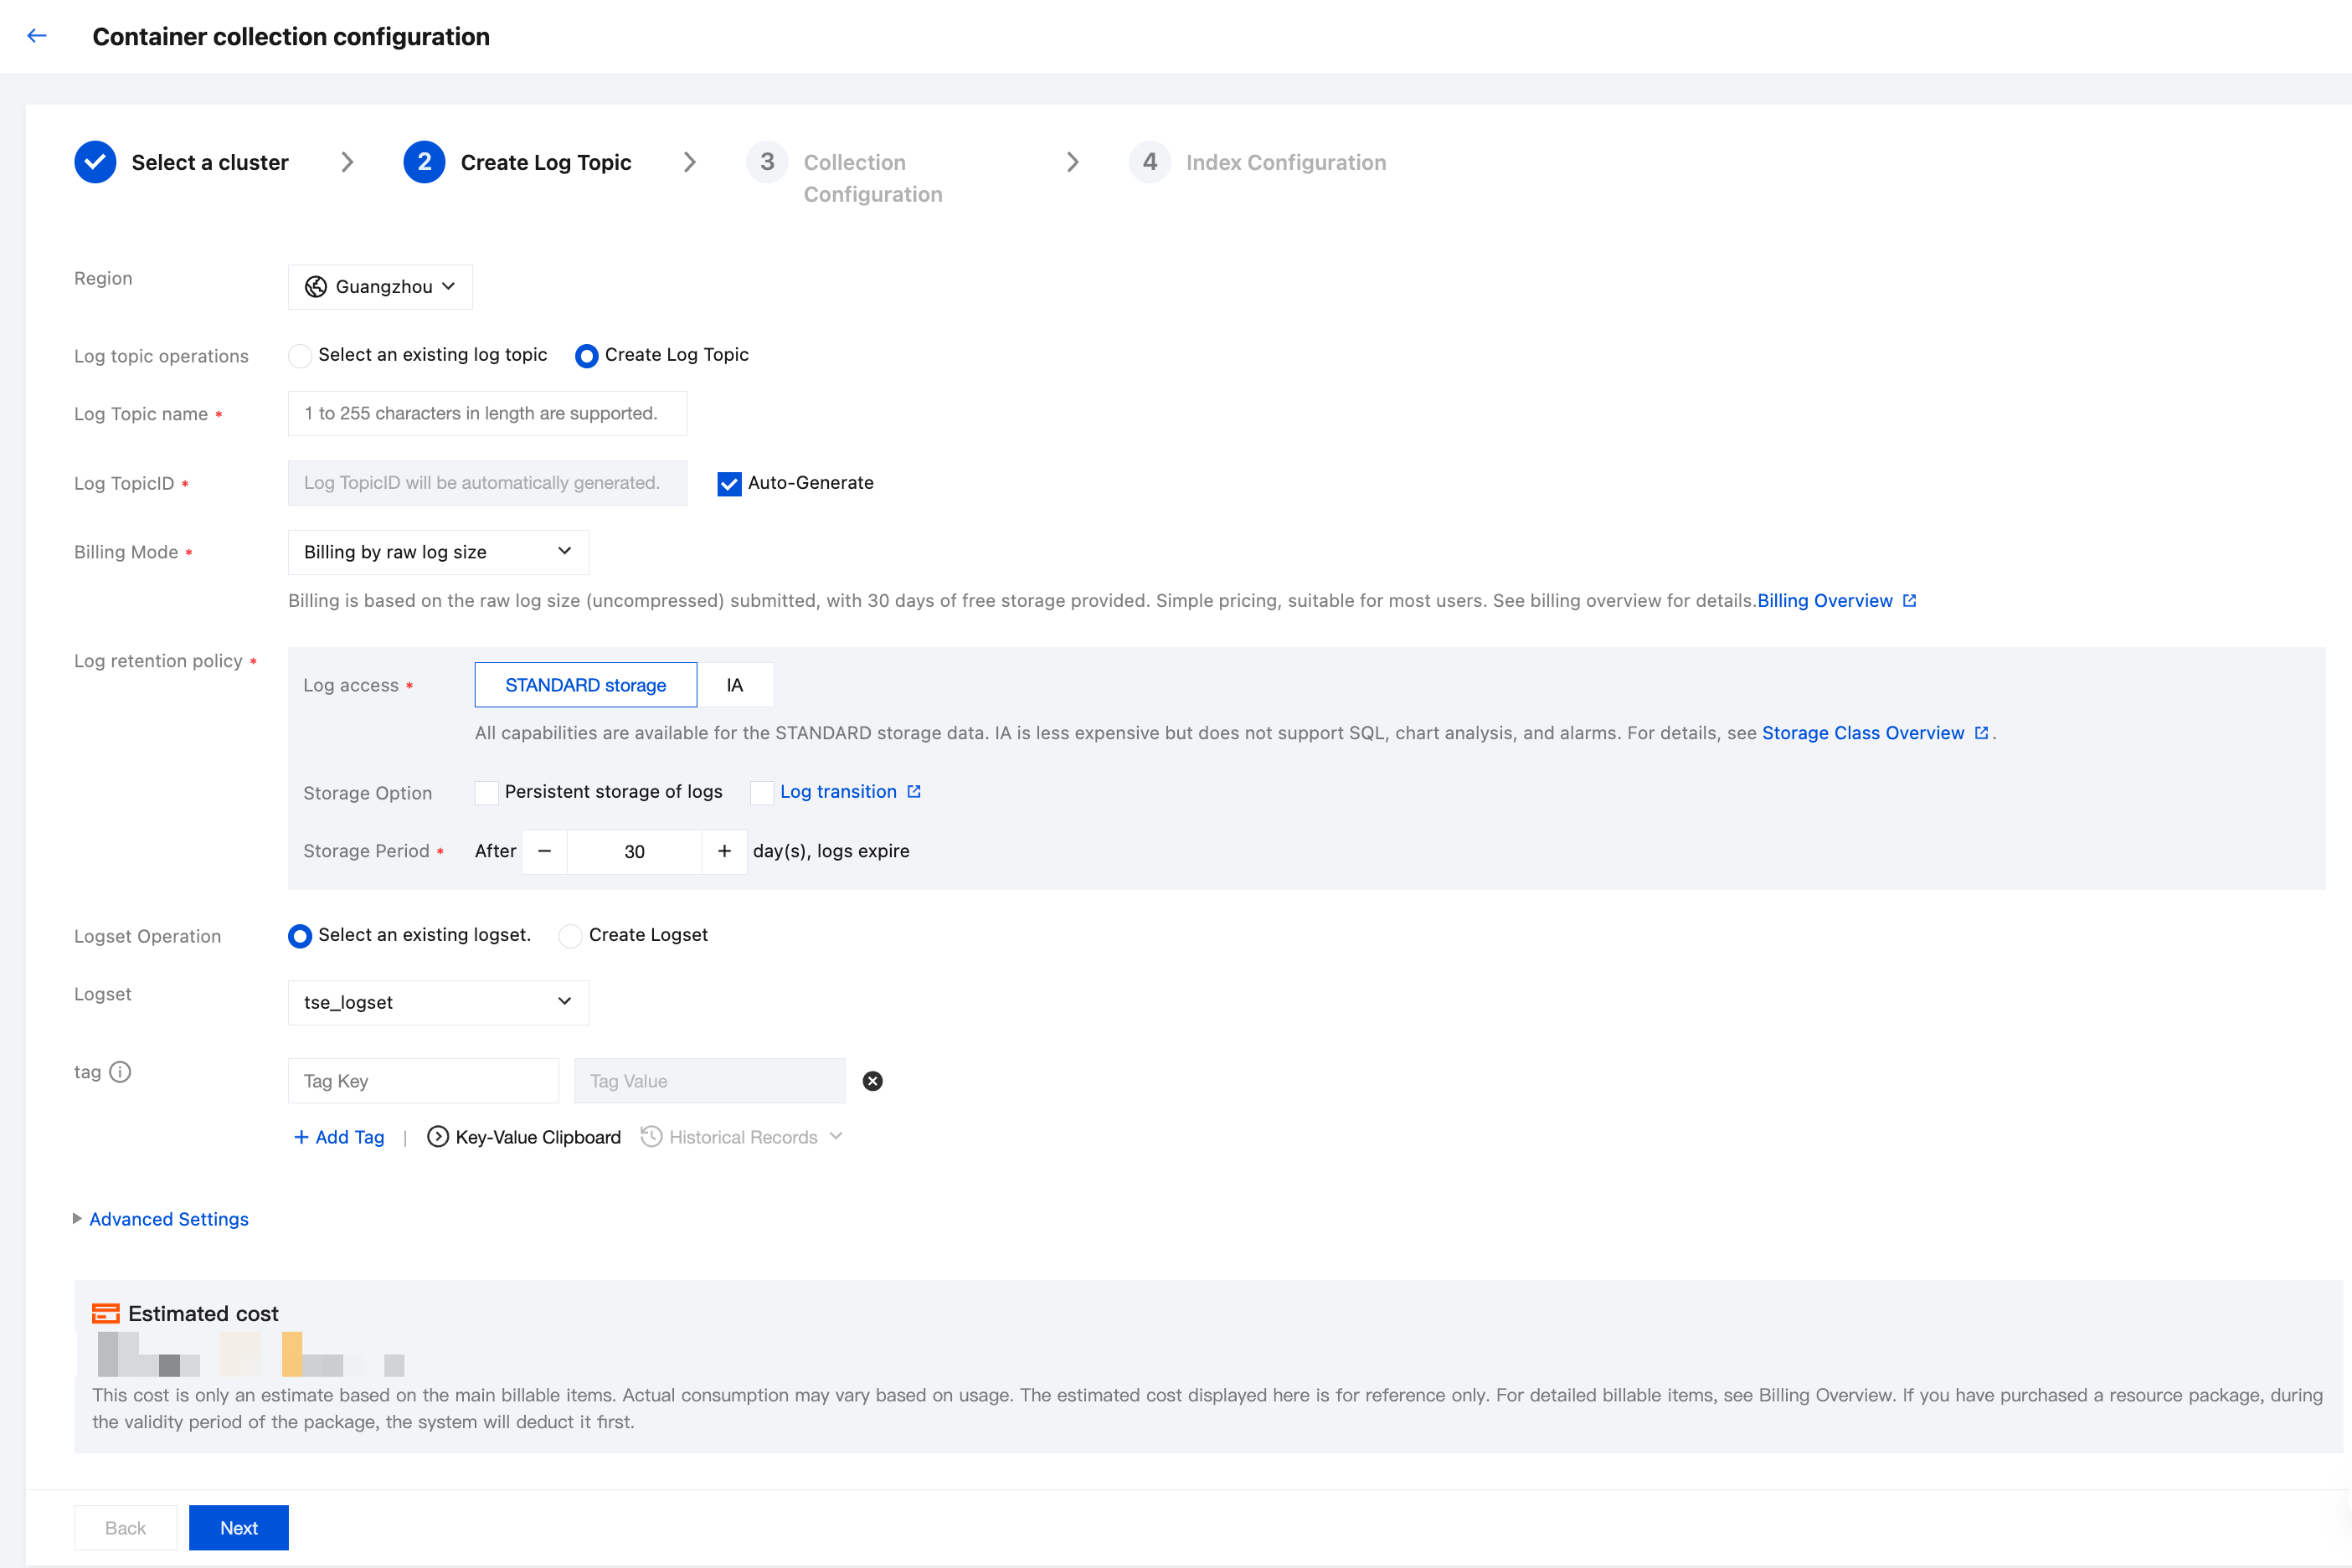
In the cluster log collection configuration process, during the Create Log Topic step, you can select an existing log topic or create a new one for storing logs. For information about log topics, see Log Topic.
Step 3: Configuring Collection Rules
After the log topic configuration is completed, click Next to go to Collection Configuration to configure the collection rules. The configuration details are as follows:
Log Source Configuration:
Collection Rule Name: You can customize the log collection rule name.
Collection Type: Currently, the system supports the following types of collection: container standard output, container file path, and node file path.
Container Standard Output
Container File Path
Node File Path
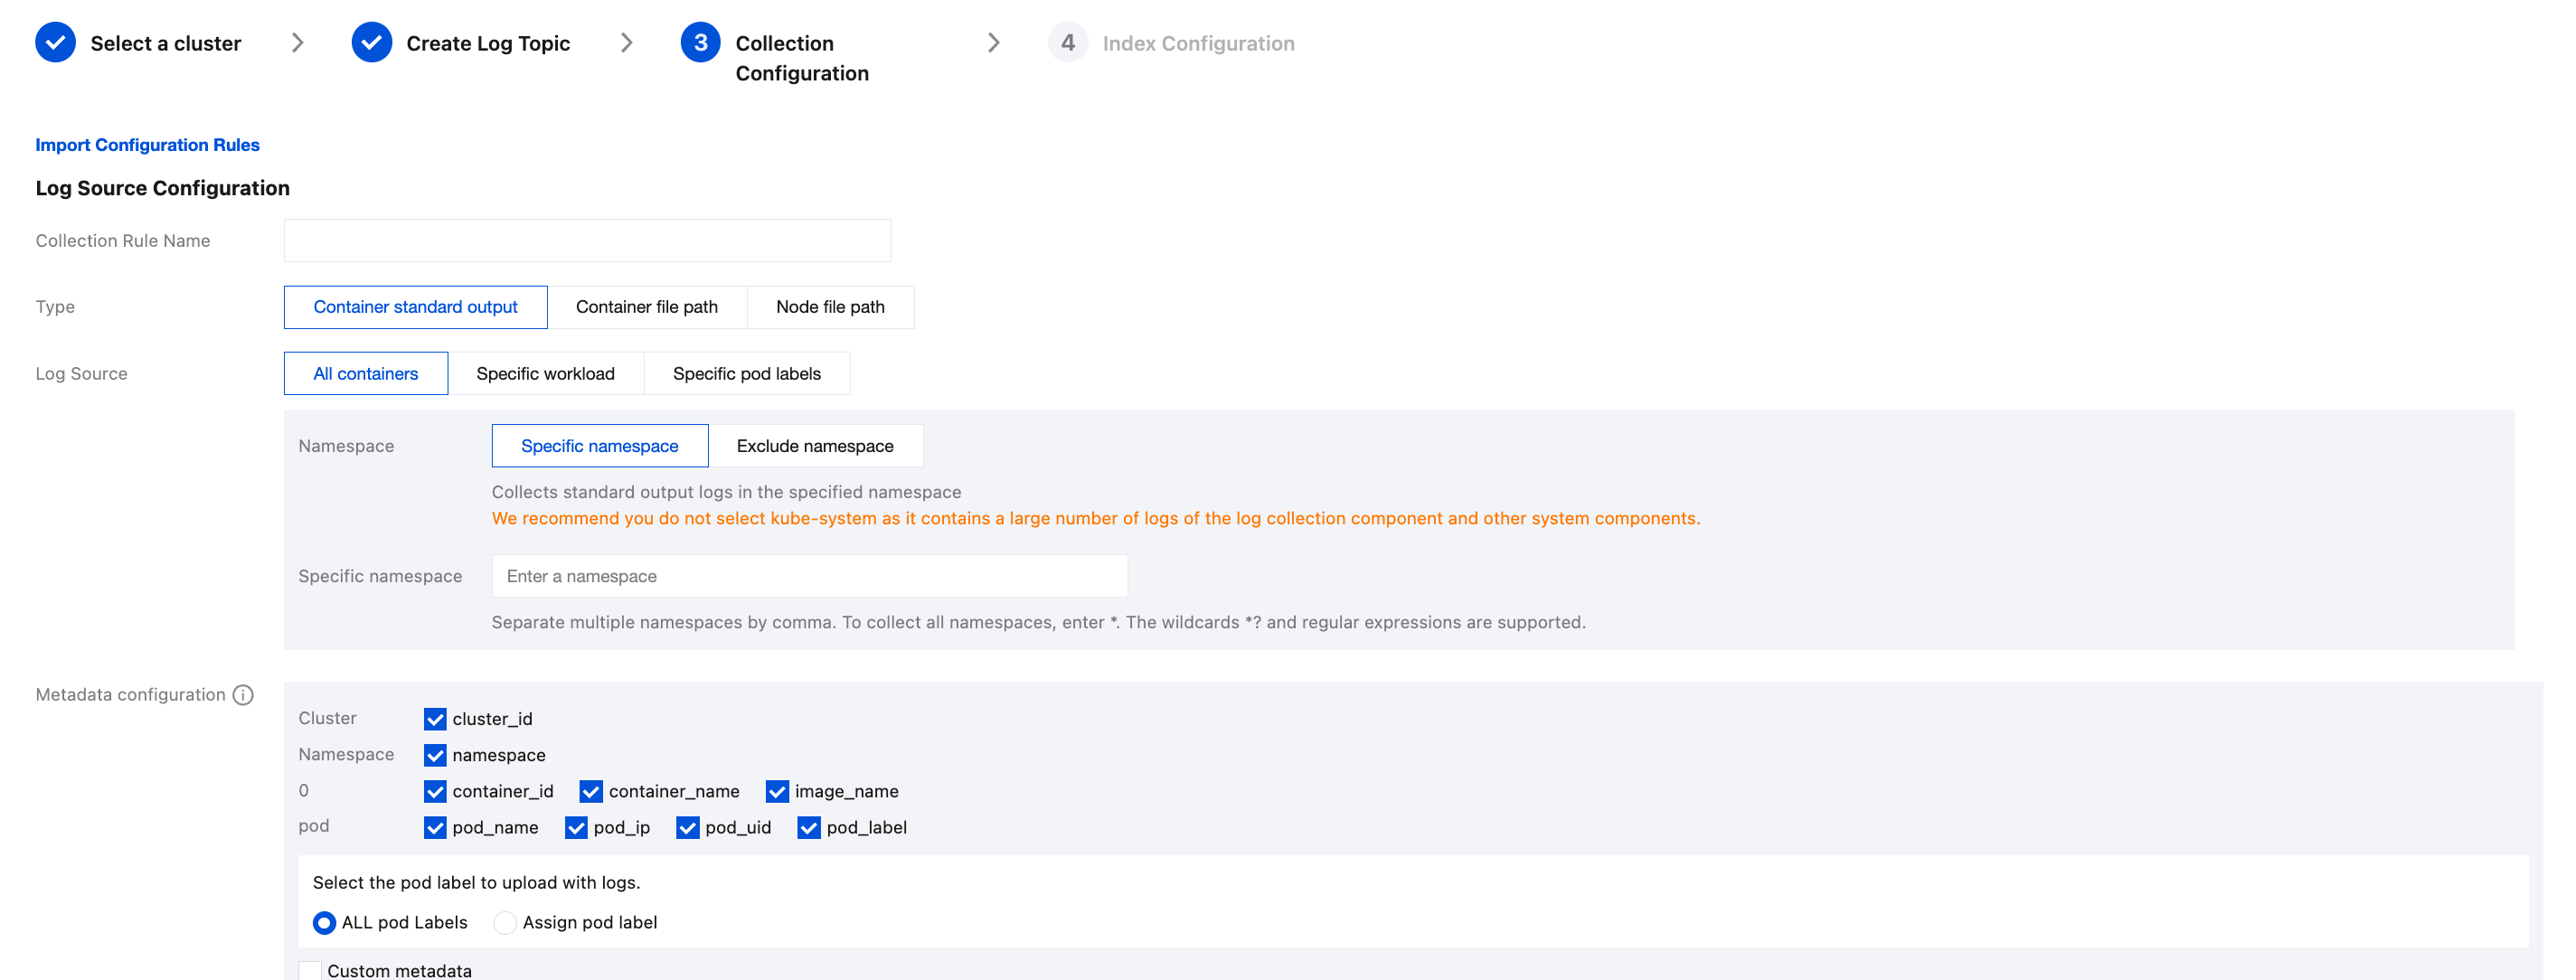
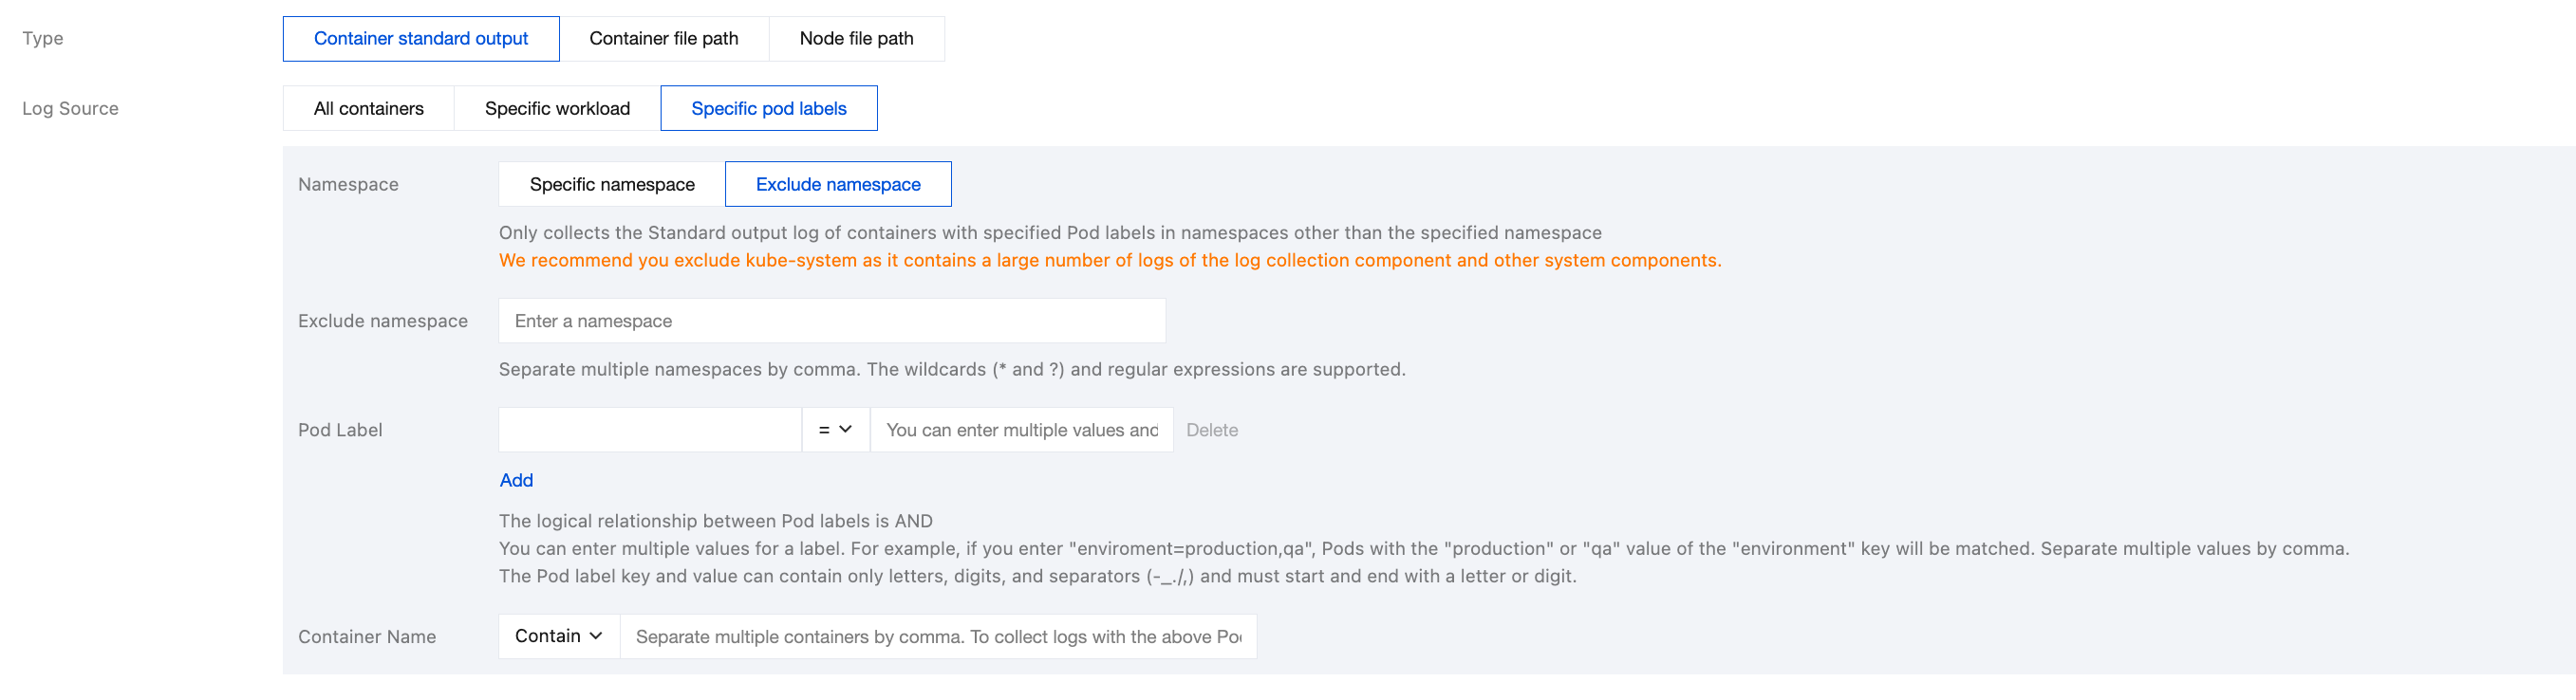
The log collection source for container standard output can be specified in three ways: All containers, Specific workload, and Specific Pod labels.
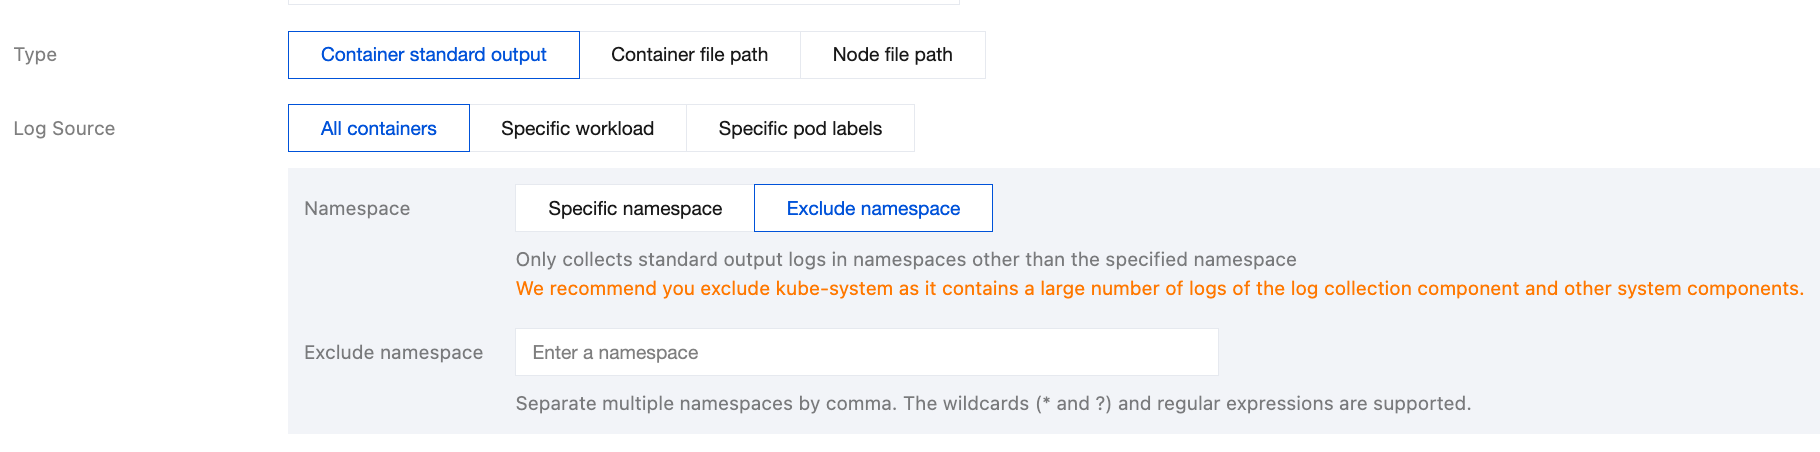
All containers: The system collects standard output logs from all containers in the specified namespace, as shown in the following figure:
Specific workload: This option collects the standard output logs from the specified container within the specified workload in the specified namespace, as shown in the following figure:
Specific pod labels: This option collects the standard output logs from all containers with the specified Pod labels in the specified namespace, as shown in the following figure:
Note:
For Container file path, the corresponding path cannot be a soft link. Otherwise, the actual path of the soft link will not exist in the collector's container, resulting in log collection failure.
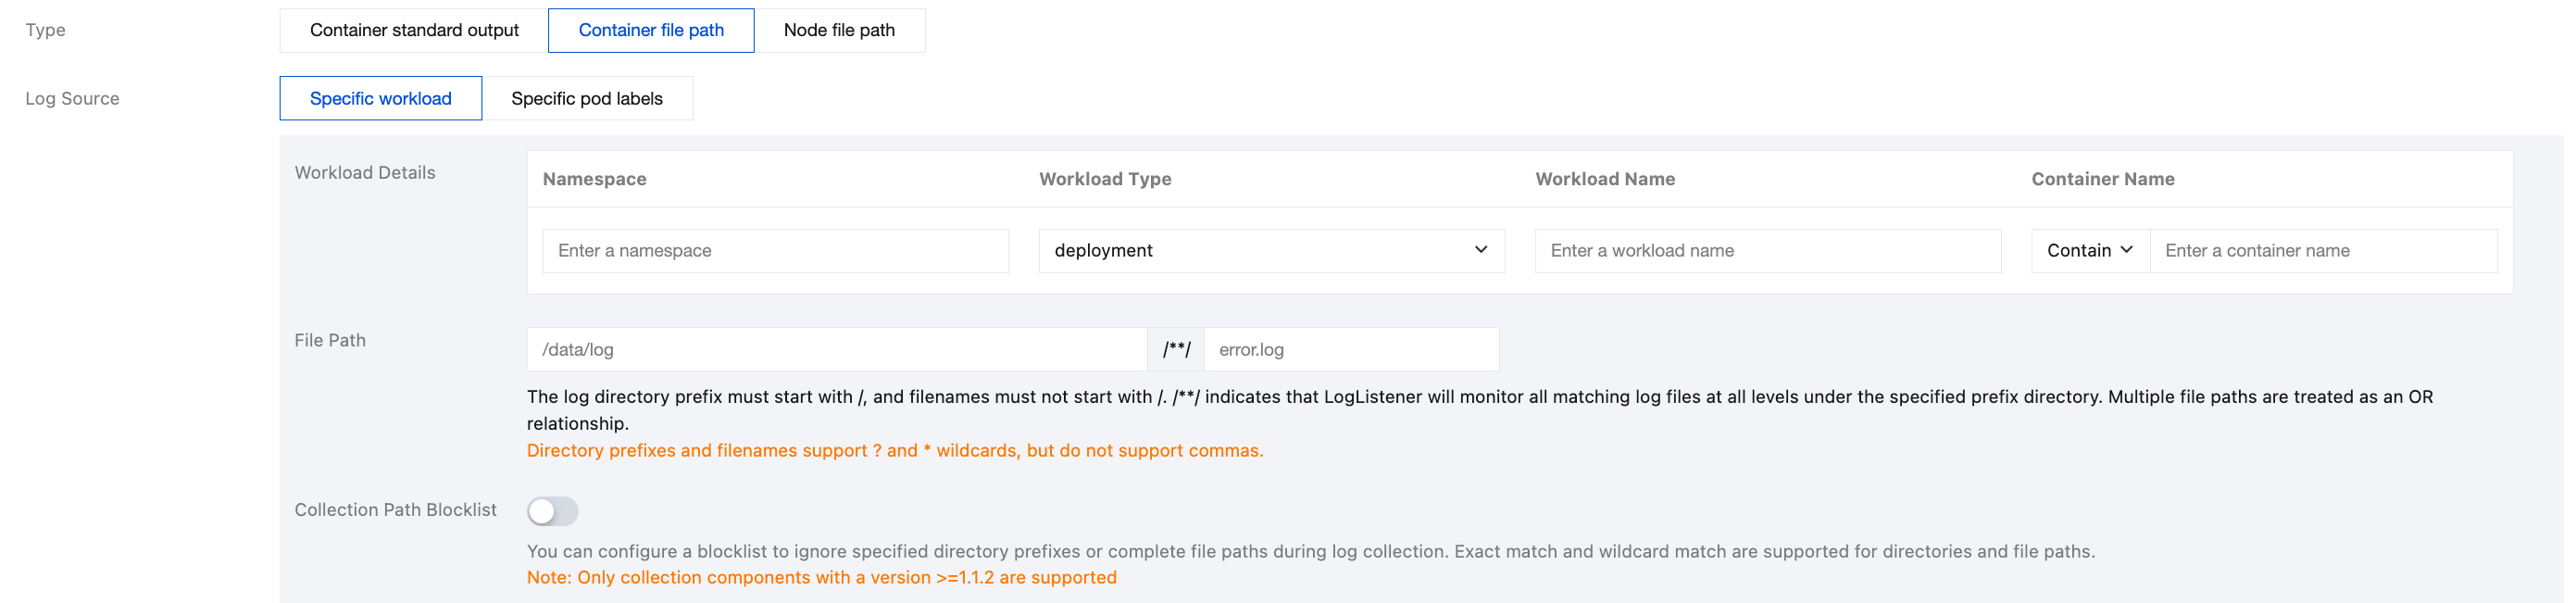
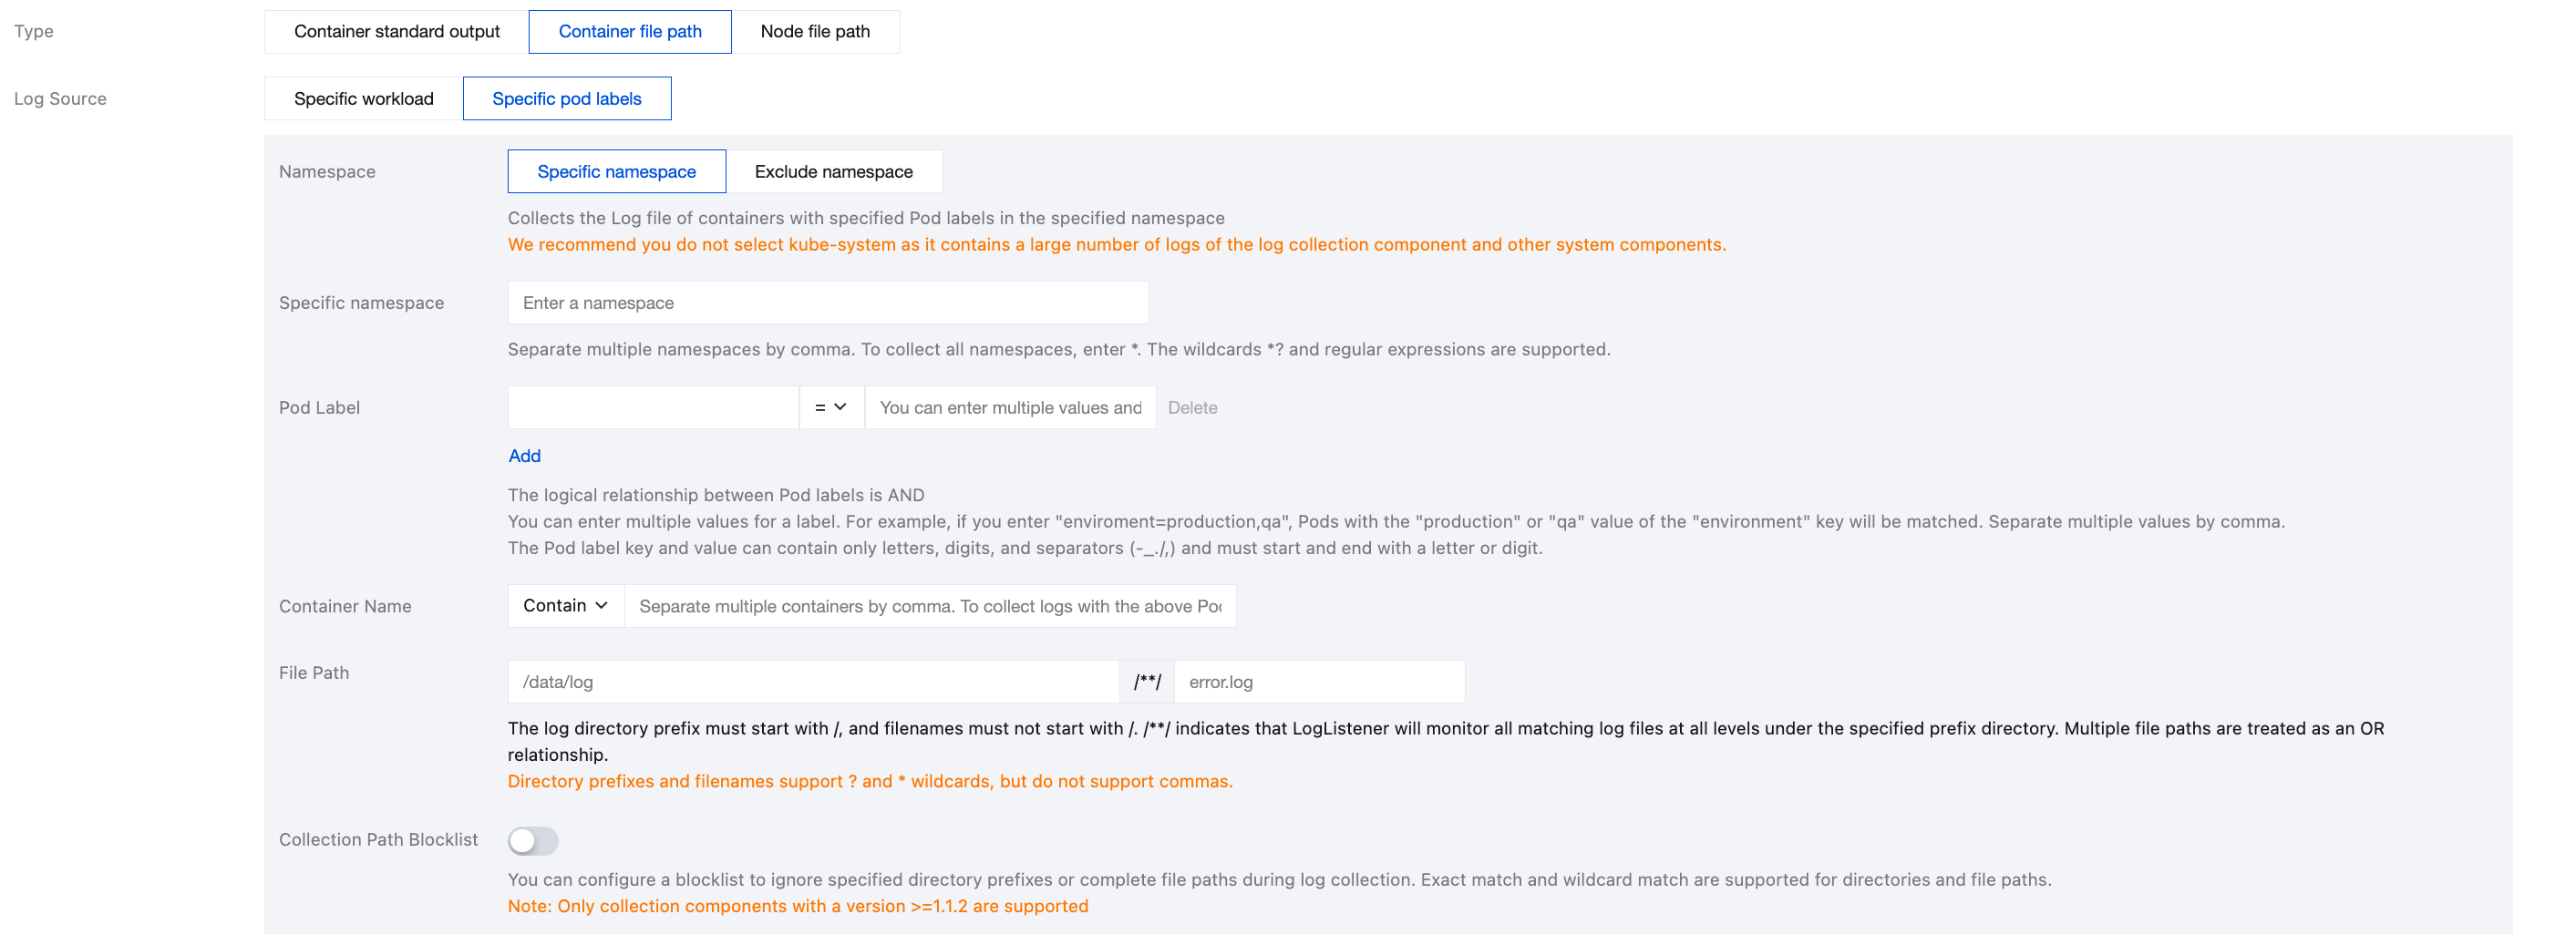
The log collection source for container file paths can be specified in two ways: Specific workload and Specific pod labels.
Specific workload: The system collects container file paths from the specified container within the specified workload in the specified namespace, as shown in the following figure:
Specific pod labels: The system collects container file paths from all containers with specified Pod labels in the specified namespace, as shown in the following figure:
A container file path consists of a log directory and a file name. The log directory prefix must start with a forward slash (/), and the file name must not start with a forward slash. Both the prefix and the file name support the wildcards ? and *, but commas are not supported. The pattern /**/ indicates that the log collection component will listen for matching log files at all levels under the specified prefix directory. Multiple file paths have an OR relationship. For example: if the container file path is /opt/logs/*.log, you can specify the directory prefix as /opt/logs and the file name as *.log.
Note:
Only container collection components of version 1.1.12 or later support multiple collection paths.
Only collection configurations created after the container collection component is upgraded to version 1.1.12 or later support defining multiple collection paths.
After the container collection component is upgraded to version 1.1.12, the collection configurations created in versions earlier than 1.1.12 do not support configuring multiple collection paths. The collection configurations need to be recreated.
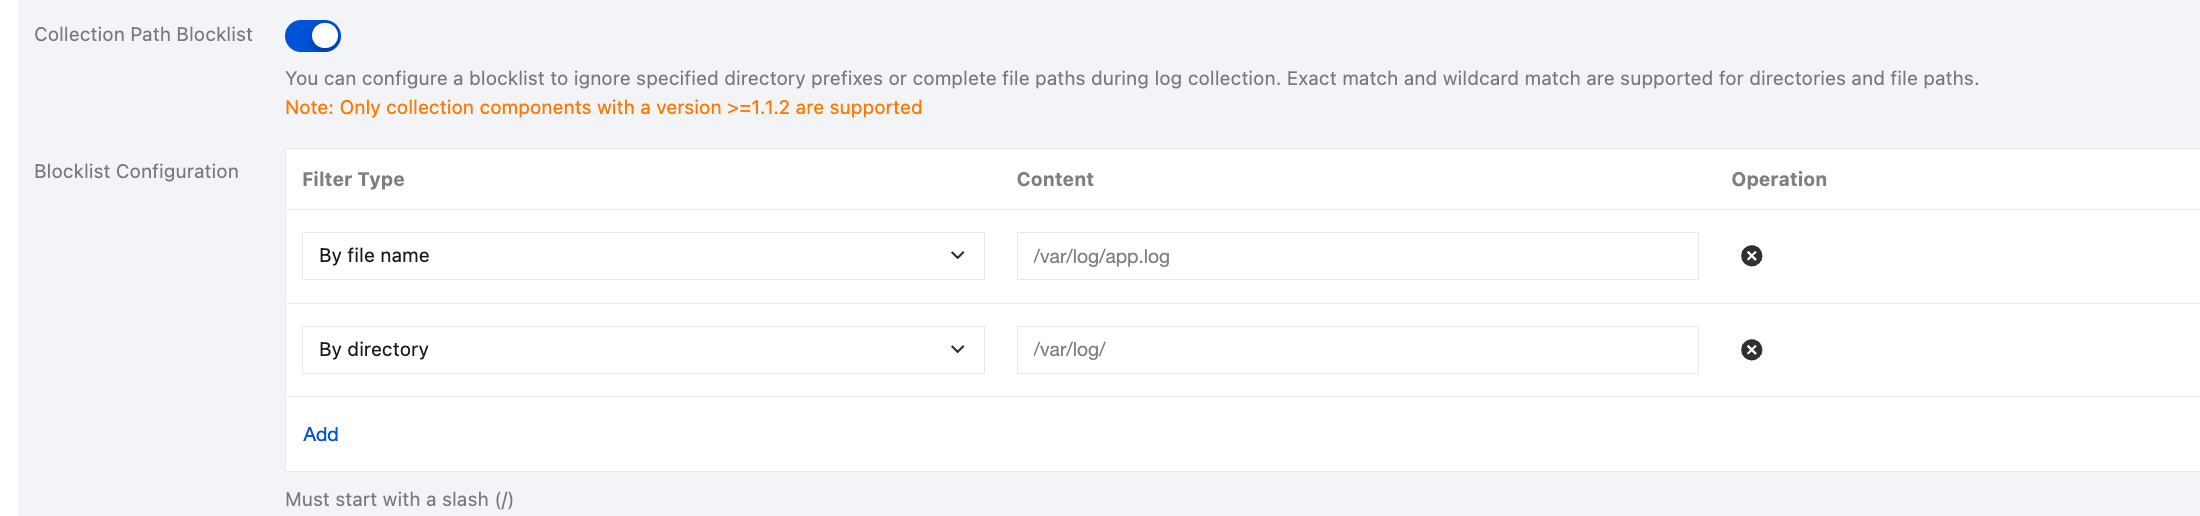
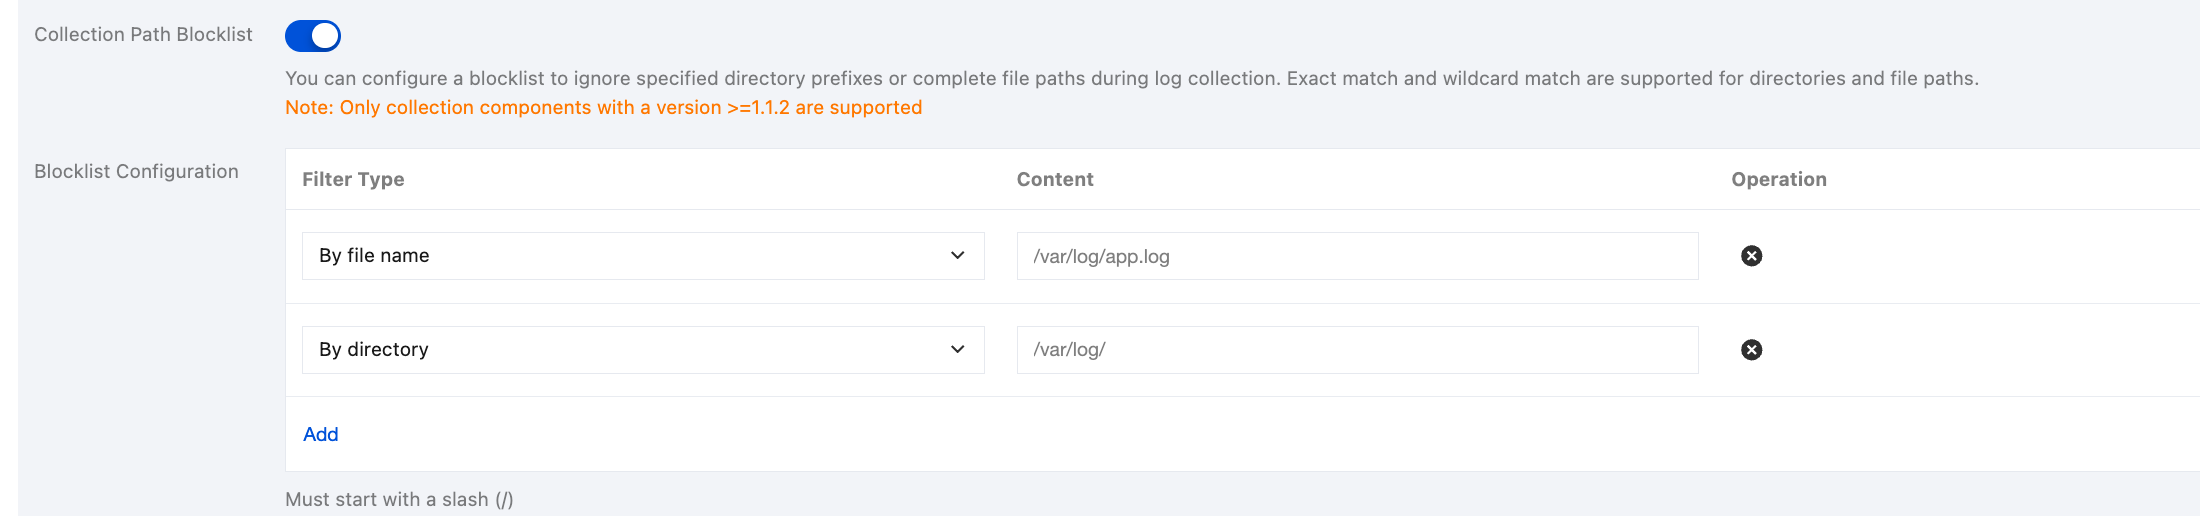
Collection Path Blocklist. When enabled, it allows the system to ignore specified directory paths or complete file paths during collection. Directory paths and file paths can be matched exactly, and they also support wildcard pattern matching.
The collection blocklist supports two filter types, which can be used simultaneously:
File name: In the collection path, the complete file path for the collection needs to be ignored. The wildcard * or ? is supported, and ** path fuzzy matching is supported.
Directory: In the collection path, the directory prefix for the collection needs to be ignored. The wildcard * or ? is supported, and ** path fuzzy matching is supported.
Note:
A container log collection component of version 1.1.2 or later is required.
The collection blocklist excludes paths under the collection path. Therefore, in both file name mode and directory mode, the specified path should be a subset of the collection path.
A node file path consists of a log directory and a file name. The log directory prefix must start with a forward slash (/), and the file name must not start with a forward slash. Both the prefix and the file name support the wildcards ? and *, but commas are not supported. The pattern /**/ indicates that the log collection component will listen for matching log files at all levels under the specified prefix directory. Multiple file paths have an OR relationship. For example: if the node file path is /opt/logs/*.log, you can specify the directory prefix as /opt/logs and the file name as *.log.
Note:
Only collection components of version 1.1.12 or later support multiple collection paths.
Only collection configurations created after the container collection component is upgraded to version 1.1.12 or later support defining multiple collection paths.
After the container collection component is upgraded to version 1.1.12, the collection configurations created in versions earlier than 1.1.12 do not support configuring multiple collection paths. The collection configurations need to be recreated.
Collection Path Blocklist. When enabled, it allows the system to ignore specified directory paths or complete file paths during collection. Directory paths and file paths can be matched exactly, and they also support wildcard pattern matching.
The collection blocklist supports two filter types, which can be used simultaneously:
File name: In the collection path, the complete file path for the collection needs to be ignored. The wildcard * or ? is supported, and ** path fuzzy matching is supported.
Directory: In the collection path, the directory prefix for the collection needs to be ignored. The wildcard * or ? is supported, and ** path fuzzy matching is supported.
Note:
A container log collection component of version 1.1.2 or later is required.
The collection blocklist excludes paths under the collection path. Therefore, in both file name mode and directory mode, the specified path should be a subset of the collection path.
Metadata configuration:
In addition to the original log content, CLS also reports container- or Kubernetes-related metadata (such as the container ID that generated the logs) to facilitate users in tracing the source when they view logs or search based on container identifiers and characteristics (such as container names and labels). You can choose whether to report this metadata and select the items to upload as needed.
For container- or Kubernetes-related metadata, see the table below:
Field Name
Description
container_id
ID of the container to which logs belong
container_name
The name of the container to which logs belong
image_name
The image name IP of the container to which logs belong
namespace
The namespace of the Pod to which logs belong
pod_uid
The UID of the Pod to which logs belong
pod_name
The name of the Pod to which logs belong
pod_ip
IP address of the Pod to which the log belongs.
pod_lable_{label name}
The labels of the Pod to which logs belong (for example, if a Pod has two labels: app=nginx and env=prod, the reported log will have two metadata entries attached: pod_label_app:nginx and pod_label_env:prod).
Note:
To collect logs with a certain Pod label, you need to manually enter the target label key (or enter multiple ones, each of which ends with a carriage return). Logs will be collected if their label is hit.
Parsing Rule Configuration:
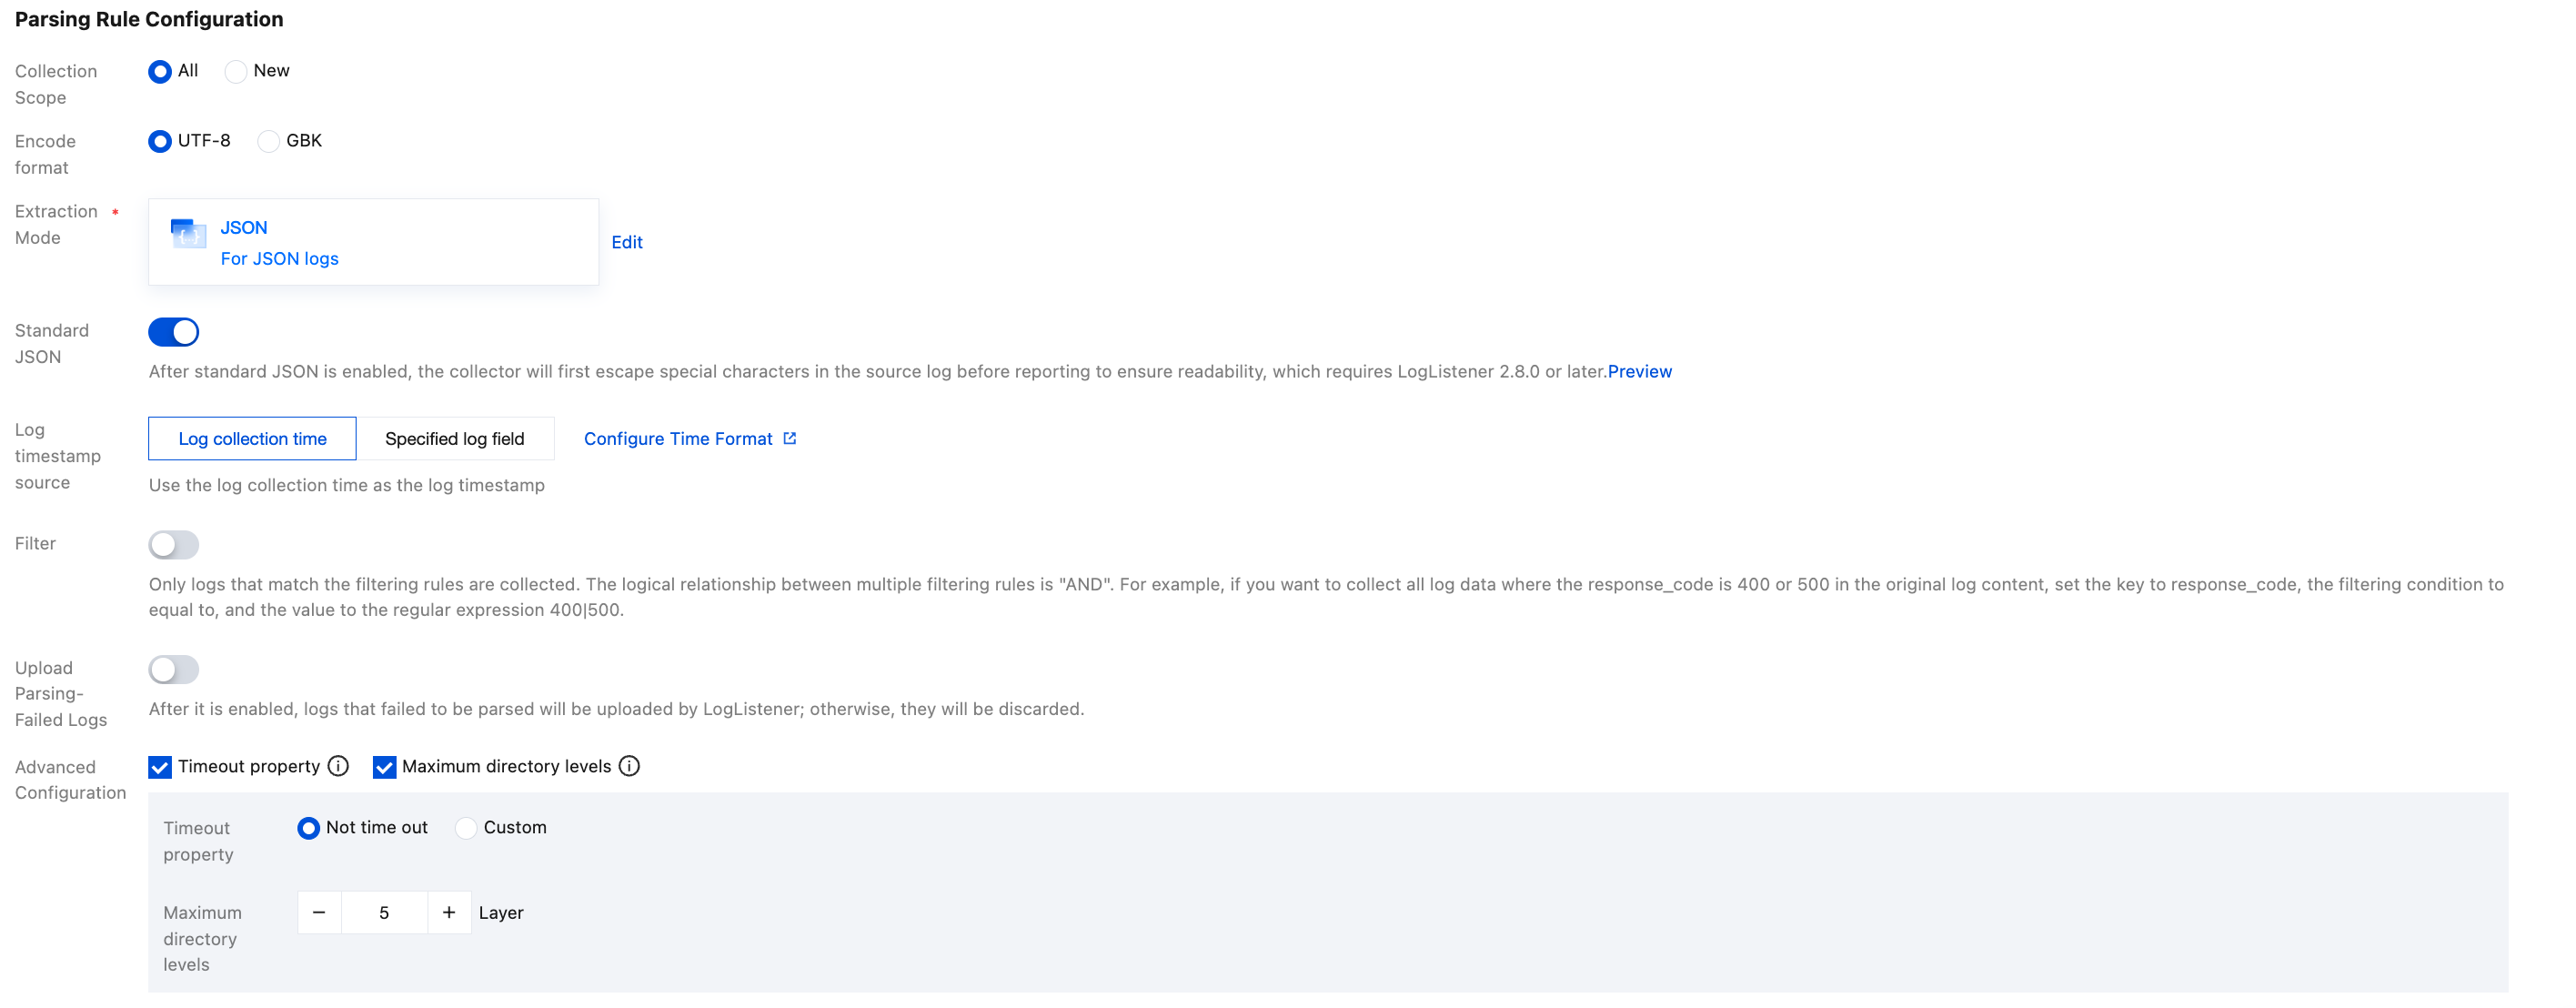
Collection Policy. You can select All or New.
Full: Collecting logs from the beginning of the log file.
New: Incremental collection collects only the newly added content in the file.
Encode FORMAT: UTF-8 and GBK are supported.
Extraction Mode: Multiple types of extraction modes are supported. The details are as follows:
Single-Line Full-Text Format
Multi-line Full-Text Format
Single-Line Full Regular Expression Format
Multi-line Full Regular Expression Format
JSON format
Delimiter
Combined Parsing
A single-line full-text log refers to a log where each line represents a complete log entry. When collecting logs, CLS uses the line break \\n as the delimiter to mark the end of each log entry. For unified structured management, each log will have a default key-value pair __CONTENT__. However, the log data itself will not be processed in a structured manner, nor will log fields be extracted. The time attribute of a log is determined by the time when the log is collected.
Assume that the raw data of a log is:
Tue Jan 2212:08:15 CST 2019 Installed: libjpeg-turbo-static-1.2.90-6.el7.x86_64
The data collected into CLS is:
__CONTENT__:Tue Jan 2212:08:15 CST 2019 Installed: libjpeg-turbo-static-1.2.90-6.el7.x86_64
A multi-line full-text log refers to a complete piece of log data that may span multiple lines (such as Java stacktraces). In this case, using the line break \\n as the end identifier of the log seems improper. To enable the logging system to clearly distinguish between individual log entries, it uses a regular expression to match the beginning of each log entry. When a log line matches a pre-configured regular expression, it is considered the beginning of a new log entry. The log continues until another line starts that also matches the regular expression, which then marks the end of that particular log entry.
A multi-line full-text log will also have a default key-value pair __CONTENT__. However, the log data itself will not be processed in a structured manner, nor will log fields be extracted. The time attribute of a log is determined by the time when the log is collected.
__CONTENT__:2019-12-15 17:13:06,043 [main] ERROR com.test.logging.FooFactory:\\njava.lang.NullPointerException\\n at com.test.logging.FooFactory.createFoo(FooFactory.java:15)\\n at com.test.logging.FooFactoryTest.test(FooFactoryTest.java:11)
The single-line full regular expression format is usually used to process structured logs. This represents a log parsing mode in which multiple key-value pairs are extracted from a complete log entry using regular expressions.
When the delimiter for log parsing is specified as :::, this log will be divided into eight fields, and each of these fields will be assigned a unique key, as shown below:
Filter: LogListener collects only logs that meet the filter rules. Key supports exact match, and Filter Rule supports regular expression matching. For example, you can specify to collect only logs where ErrorCode is 404. You can enable the filter and configure rules as needed.
Data processing
If you need to further process the collected CLS logs, for example, by structuring, desensitizing, or filtering them before writing to a log topic, you can click Data Processing at the bottom of the page, add a data processing task, and finally configure the index.
Note:
For operations related to data processing, see the Creating Processing Task document, specifically the [Pre-processing] TAB page.
Data processing will incur fees. For details, see Billing Overview.
Step 4: Configuring Indexes
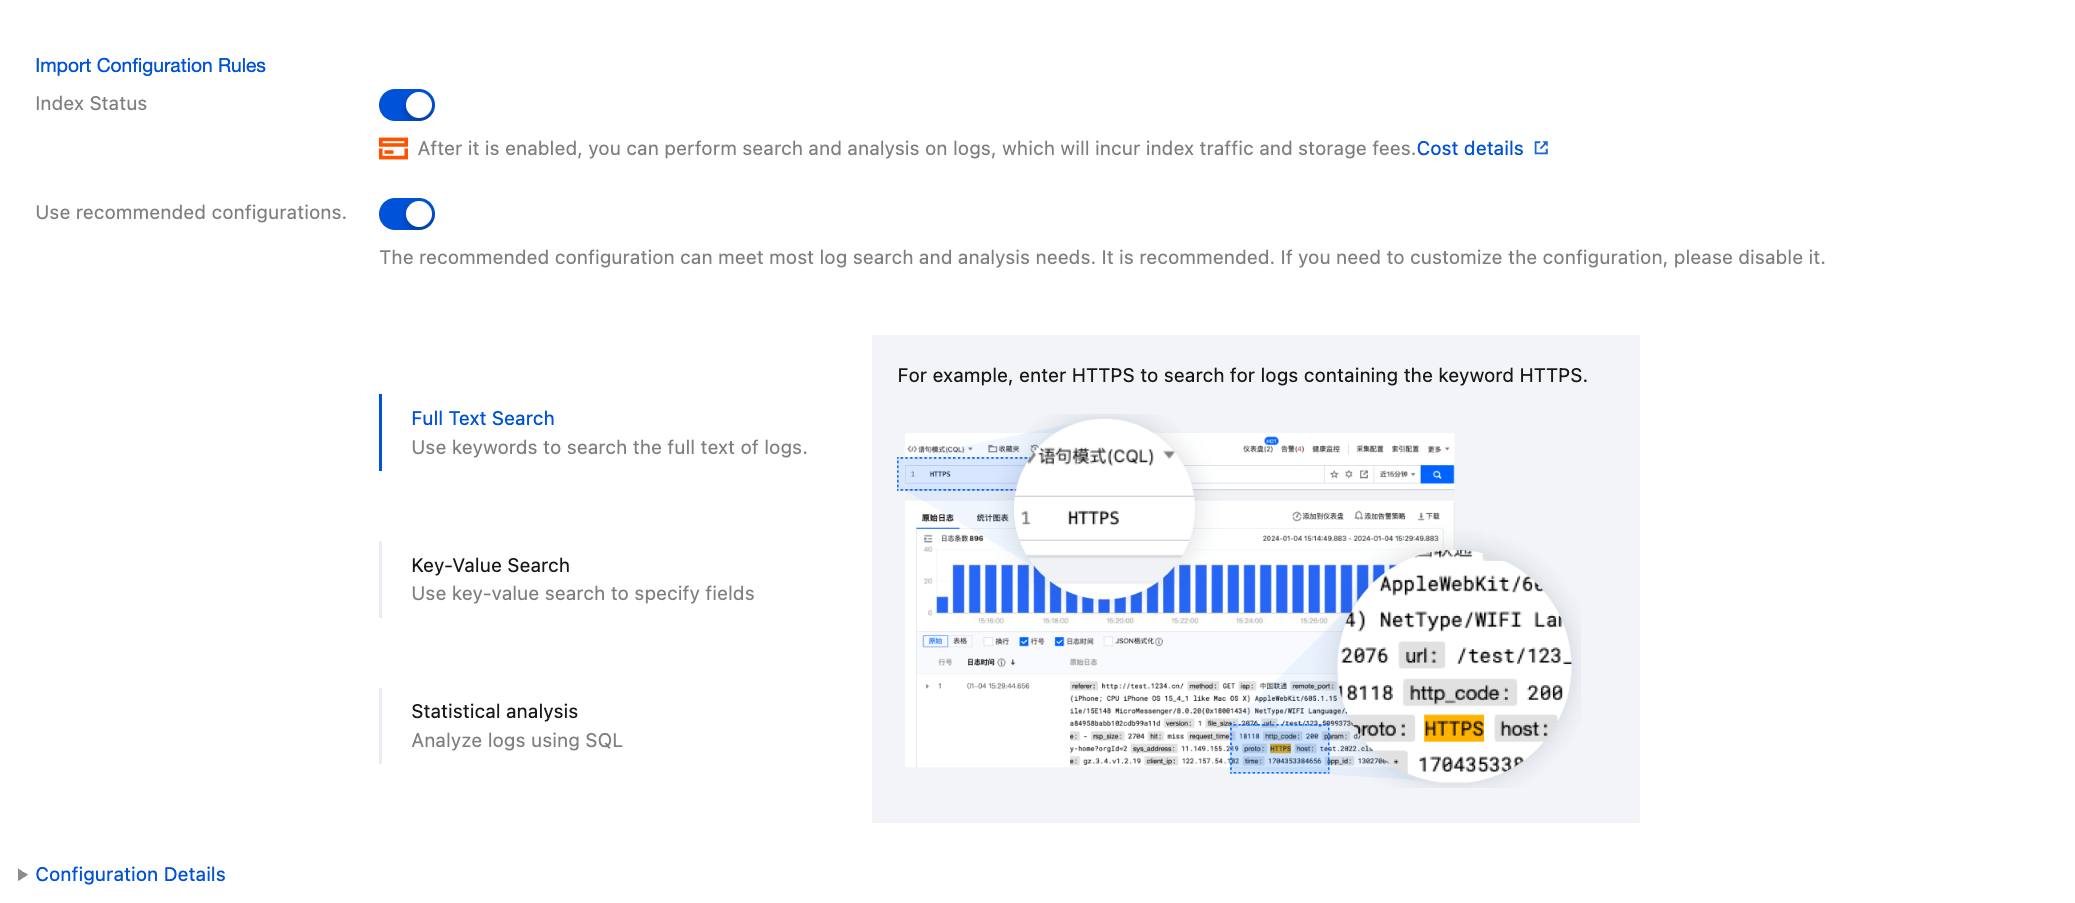
After completing the collection rule configuration, click Next to go to Index Configuration. On the configuration page, it is recommended to directly use the recommended configuration to complete the automatic index configuration.
If you need to configure the index manually, you can disable the recommended configuration and complete the detailed configuration by referring to the Full-Text Indexing and Key-Value Indexing documentation.
Step 5: Searching Logs
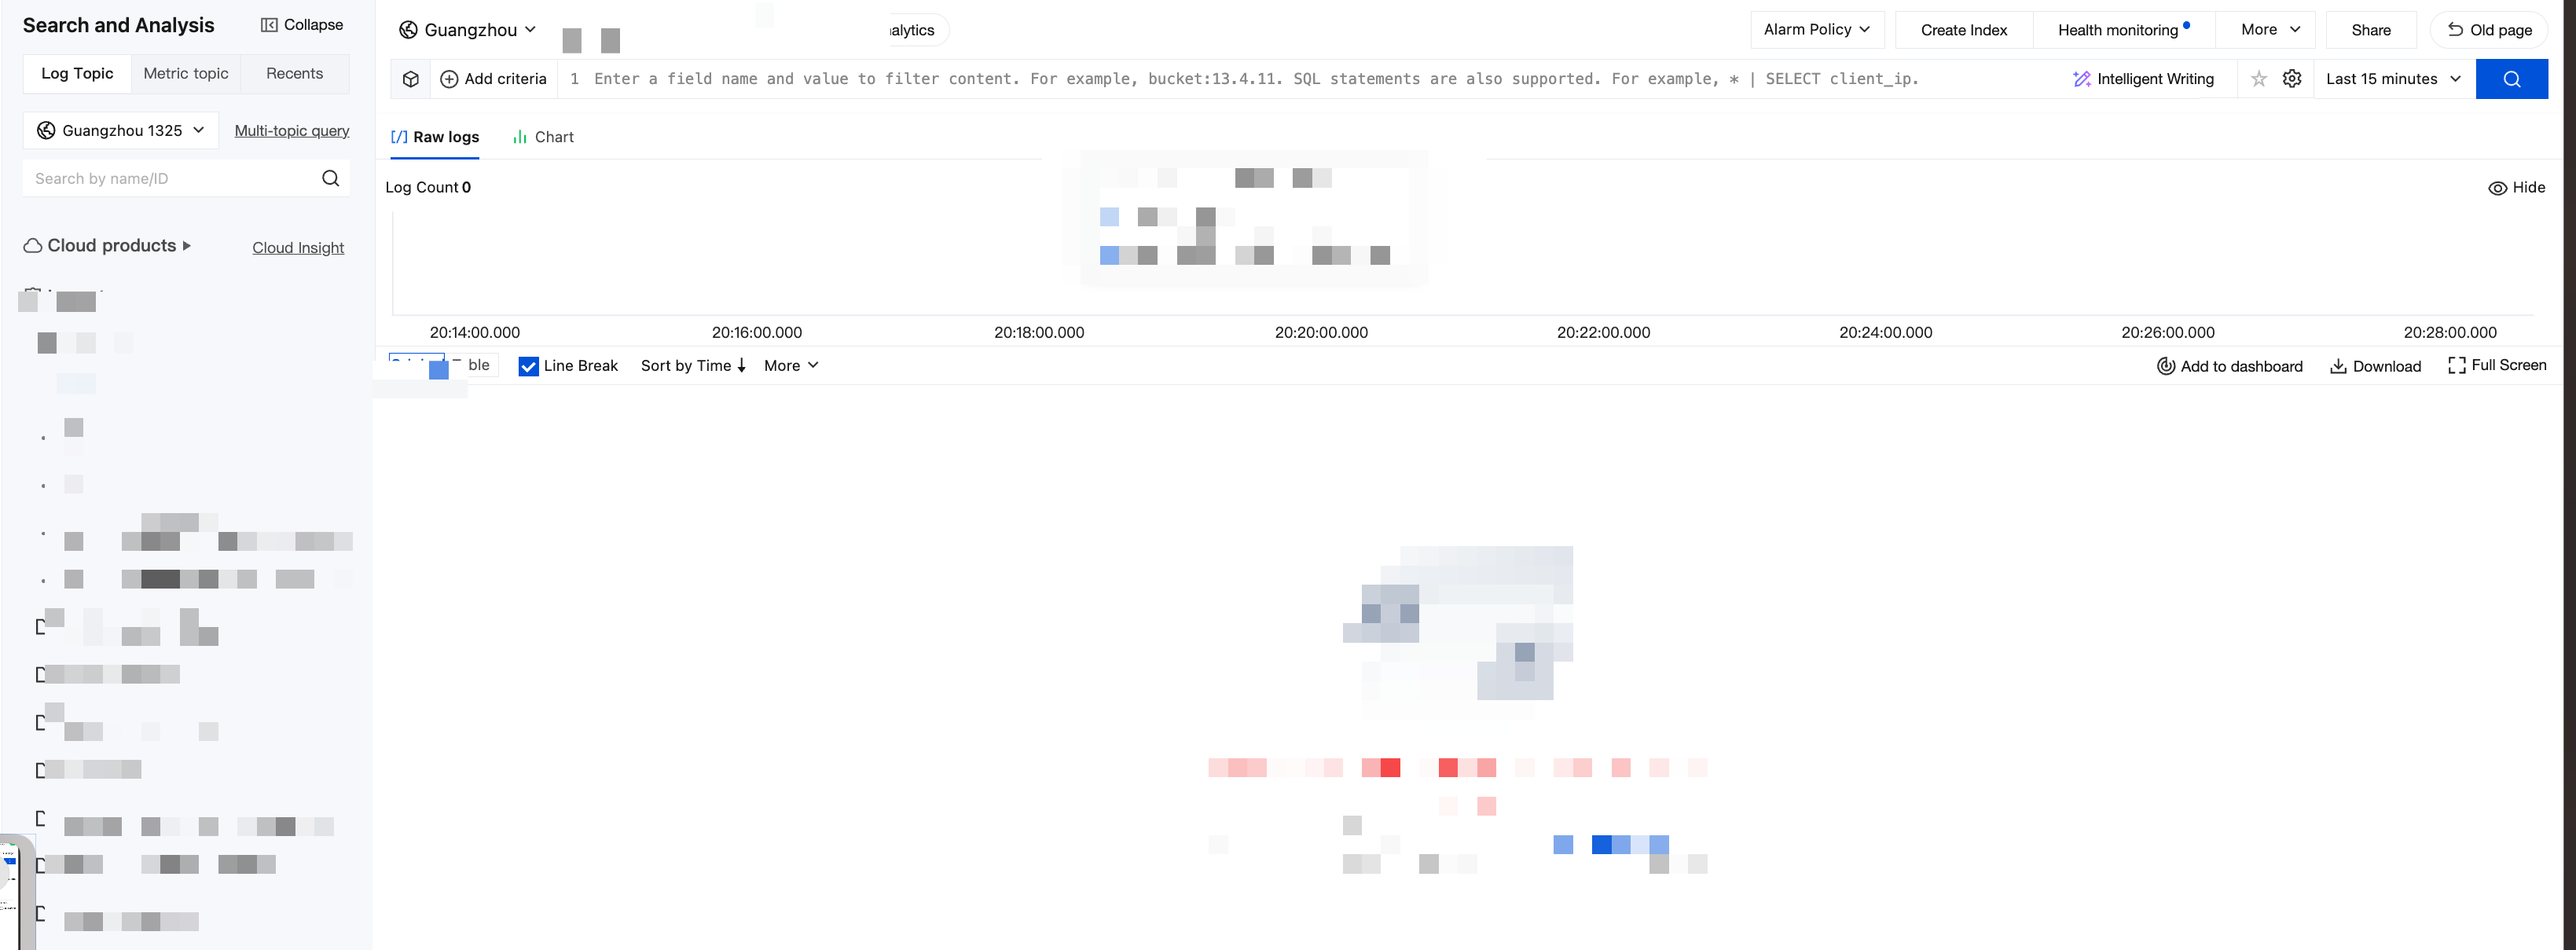
At this point, all deployment for the self-built K8s cluster business log collection is complete. You can go to CLS Console > Search and Analysis to view the collected logs.