Cloud Load Balancer (CLB) is a product of hundreds of billions of QPS and relies heavily on refined operation. Access logs provided by Cloud Log Service (CLS) are key to refined operation. You can go to CLB > Access Logs to mine the value of massive amounts of access log data. By analyzing access logs, you can monitor client requests, troubleshoot issues, and analyze user behaviors to provide data support for refined operation. This document introduces how to use CLS to analyze CLB access logs.
Tencent Cloud CLS, in collaboration with CLB, supports real-time collection of CLB access logs to CLS. Leveraging CLS's log analysis capabilities, it helps you monitor client requests, troubleshoot abnormal issues, and analyze user behavior from CLB access logs, thereby providing data support for troubleshooting and operational decisions. Through this practice, you can learn about the following information in detail:
You can also quickly experience the powerful integration of CLS and CLB through the CLB Access Analysis Dashboard Demo.
Feature Strengths
CLS provides an out-of-the-box access analysis dashboard for CLB access log analysis scenarios. The dashboard includes analysis boards such as CLB Access Traffic Analysis, Status Code Distribution, and User Behavior.
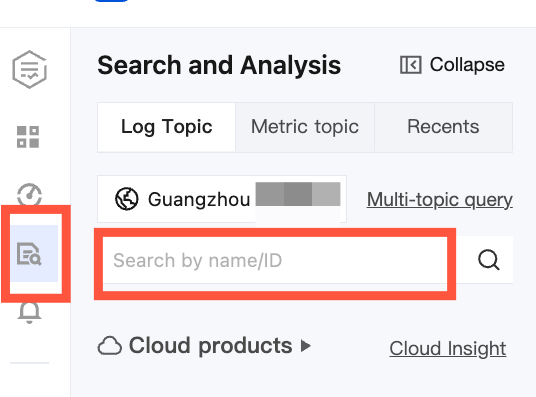
2. Click Cloud Insight in the left navigation bar to go to the Cloud Insight page.
3. In the Cloud Product Logs, select and click to enter CLB.
Step 2: Enabling CLB Access Log Collection
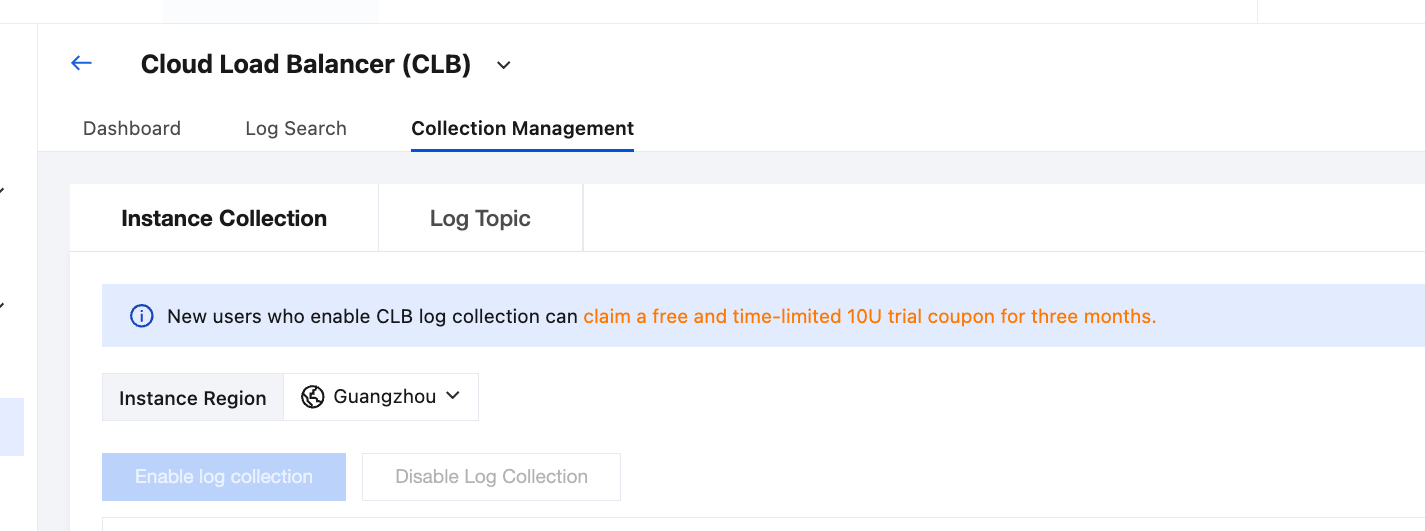
1. After you go to the CLB console, choose Collection Management > Instance Collection. In the load balancer instance list, find and select one or more target CLB instances.
2. Click Enable Log Collection.
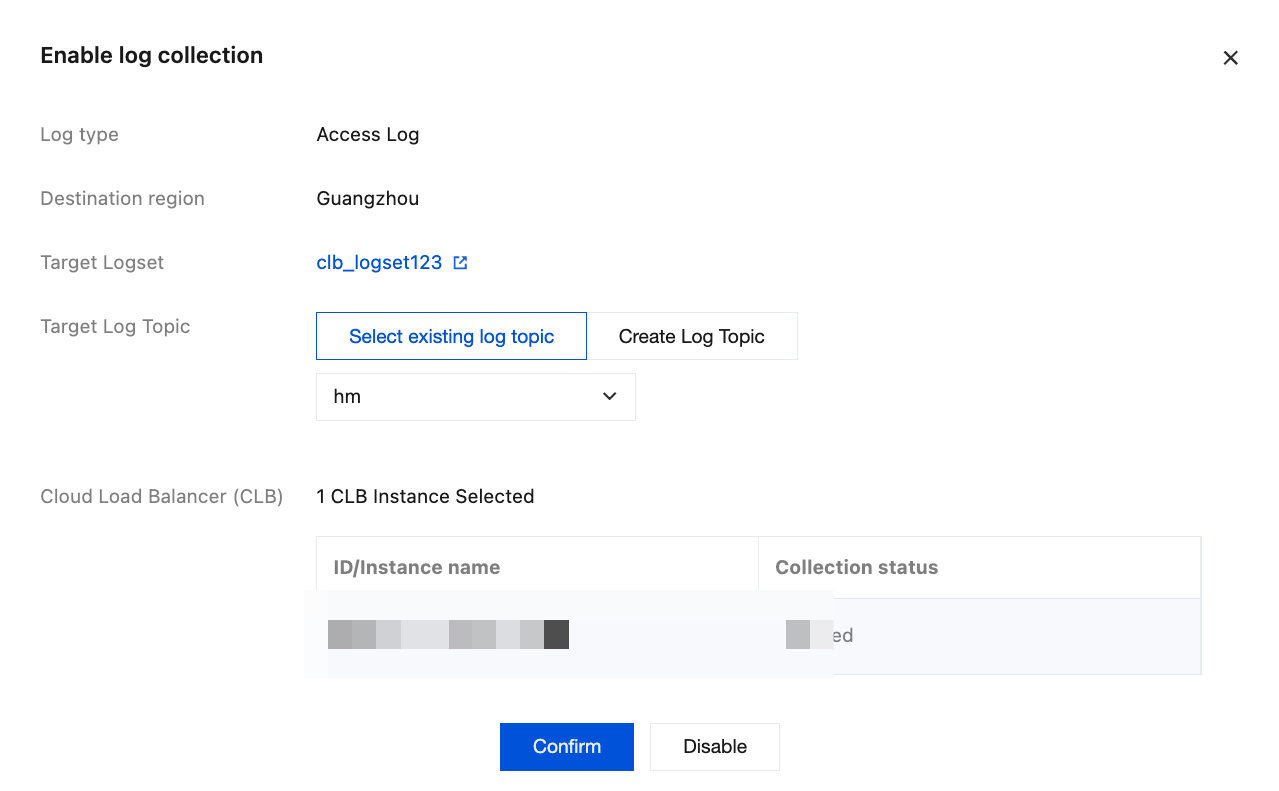
3. In the Enable Log Collection dialog box, select or create a target log topic, and then click Confirm.
Step 3: Sampling (Optional)
In some scenarios, when CLB request volume is high, a large volume of logs is generated. Uploading all logs may lead to high log costs. CLB supports sampling and collecting a portion of logs to reduce the amount of data uploaded, thereby lowering log costs. For details, see Log Sampling Collection.
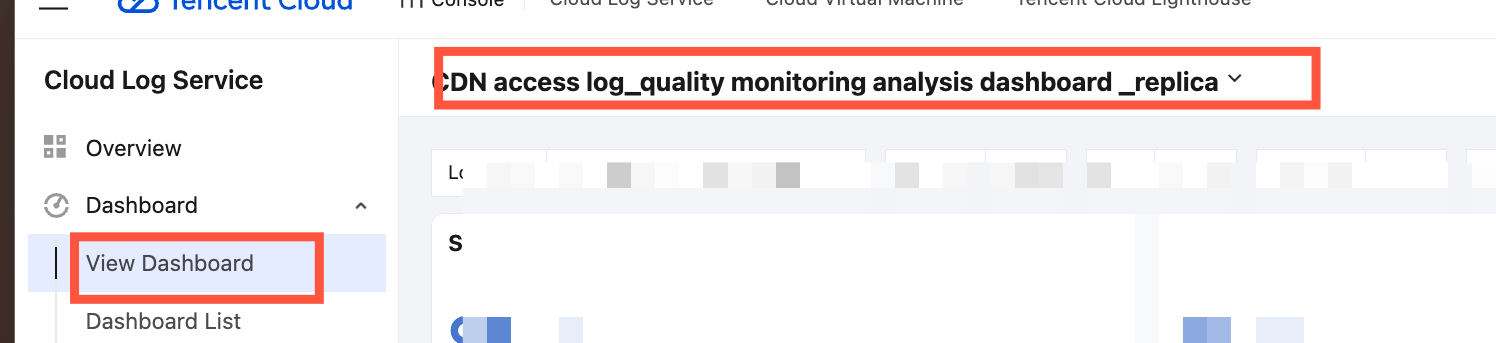
Viewing the CLB Access Analysis Dashboard
After you complete Enabling CLB Access Log Collection, CLS provides a pre-configured Access Analysis Dashboard to help you quickly understand the current CLB access request status.
CLB Access Log Dashboard: It visually presents analysis boards such as CLB Access Traffic Analysis, Status Code Distribution, and User Behavior, facilitating Ops troubleshooting scenarios.
You can view the above CLB pre-configured dashboards by performing the following operations:
In the load balancer instance list, find the instance for which access log collection is enabled. Click Dashboard to go to the CLB Access Log Dashboard.
Searching and Analyzing CLB Access Logs
1. After you enable CLB access log collection, find the CLB instance for which access log collection is enabled in the load balancer instance list. Then, click Log Search to go to the log search page, where you can search and analyze access logs. For detailed descriptions of log fields, see Log Field Descriptions.
Log Field Description
For descriptions of CLB access log fields, see the following table:
Field Name
Description
stgw_request_id
Request ID.
time_local
Access time and time zone, for example, "01/Jul/2019:11:11:00 +0800". The trailing "+0800" indicates that the time zone is 8 hours after UTC, which is Beijing time.
protocol_type
Protocol type (HTTP/HTTPS/SPDY/HTTP2/WS/WSS).
server_addr
VIP of the CLB.
server_port
Listening port of the CLB.
server_name
Domain name configured in the listener of the CLB.
remote_addr
Client IP address
remote_port
Client port.
status
Status code returned by the CLB to the client.
upstream_addr
RS address.
upstream_status
Status code returned by the RS to the CLB.
proxy_host
stream ID.
request
Request line.
request_length
Number of request bytes received from the client.
bytes_sent
Number of bytes sent to the client.
http_host
Request domain name, which is the Host field in the HTTP header.
http_user_agent
user_agent field in the HTTP header.
http_referer
Source of the HTTP request.
http_x_forwarded_for
Content of the x-forwarded-for header in the HTTP request.
request_time
Request processing time: the total time from receiving the first byte from the client until sending the last byte to the client, which includes the time for the client request to reach the CLB, the CLB forwarding the request to the RS, the RS responding with data to the CLB, and the CLB forwarding the data to the client. Unit: second.
upstream_response_time
Total time spent on the backend request: the time from initiating the CONNECT to the RS until the response is fully received from the RS. Unit: second.
upstream_connect_time
Time spent establishing a TCP connection with the RS: the time from initiating the CONNECT to the RS until starting to send the HTTP request.
upstream_header_time
Time spent receiving the HTTP header from the RS: the time from initiating the CONNECT to the RS until the HTTP response header is fully received from the RS.
tcpinfo_rtt
RTT of the TCP connection.
connection
Connection ID.
connection_requests
Number of requests on the connection.
ssl_handshake_time
Records the time spent on each stage of the SSL handshake. Format: x:x:x:x:x:x:x. It is a colon-separated string, with the unit being ms. If the time spent on any stage is less than 1 ms, it is displayed as 0.
The first field indicates whether SSL session reuse is enabled.
The second field indicates the full handshake time.
Fields 3 to 7 indicate the time consumed by each SSL stage.
The third field indicates the time from when the CLB receives the client hello to when it sends the server hello done.
The fourth field indicates the time from when the CLB starts sending the server certificate to when it completes sending the server certificate.
The fifth field indicates the time from when the CLB calculates the signature to when it completes sending the server key exchange.
The sixth field indicates the time from when the CLB starts receiving the client key exchange to when it completes receiving the client key exchange.
The seventh field indicates the time from when the CLB receives the client key exchange to when it sends the server finished.
ssl_cipher
SSL cipher suite.
ssl_protocol
SSL protocol version.
vip_vpcid
The VPC ID to which the CLB instance belongs. For a public network CLB, the value is -1.
request_method
Request method, which supports POST and GET requests.
uri
Resource identifier.
server_protocol
Protocol of the CLB.
Practical Use Cases
You can perform search and analysis and configure dashboards based on CLB access log configurations to analyze data in CLB access logs in real time. The following two examples are provided:
Step 1. Find out the geographical sources of visiting customers
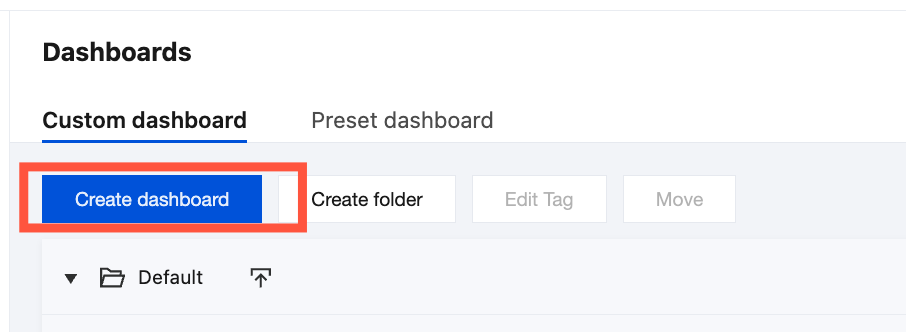
1. Log in to the CLS console, go to the Dashboard List page, click Create Dashboard, and enter the dashboard creation page.
2. On the dashboard creation page, select a blank dashboard and enter the dashboard name: CLB Access Log Geographic Distribution.
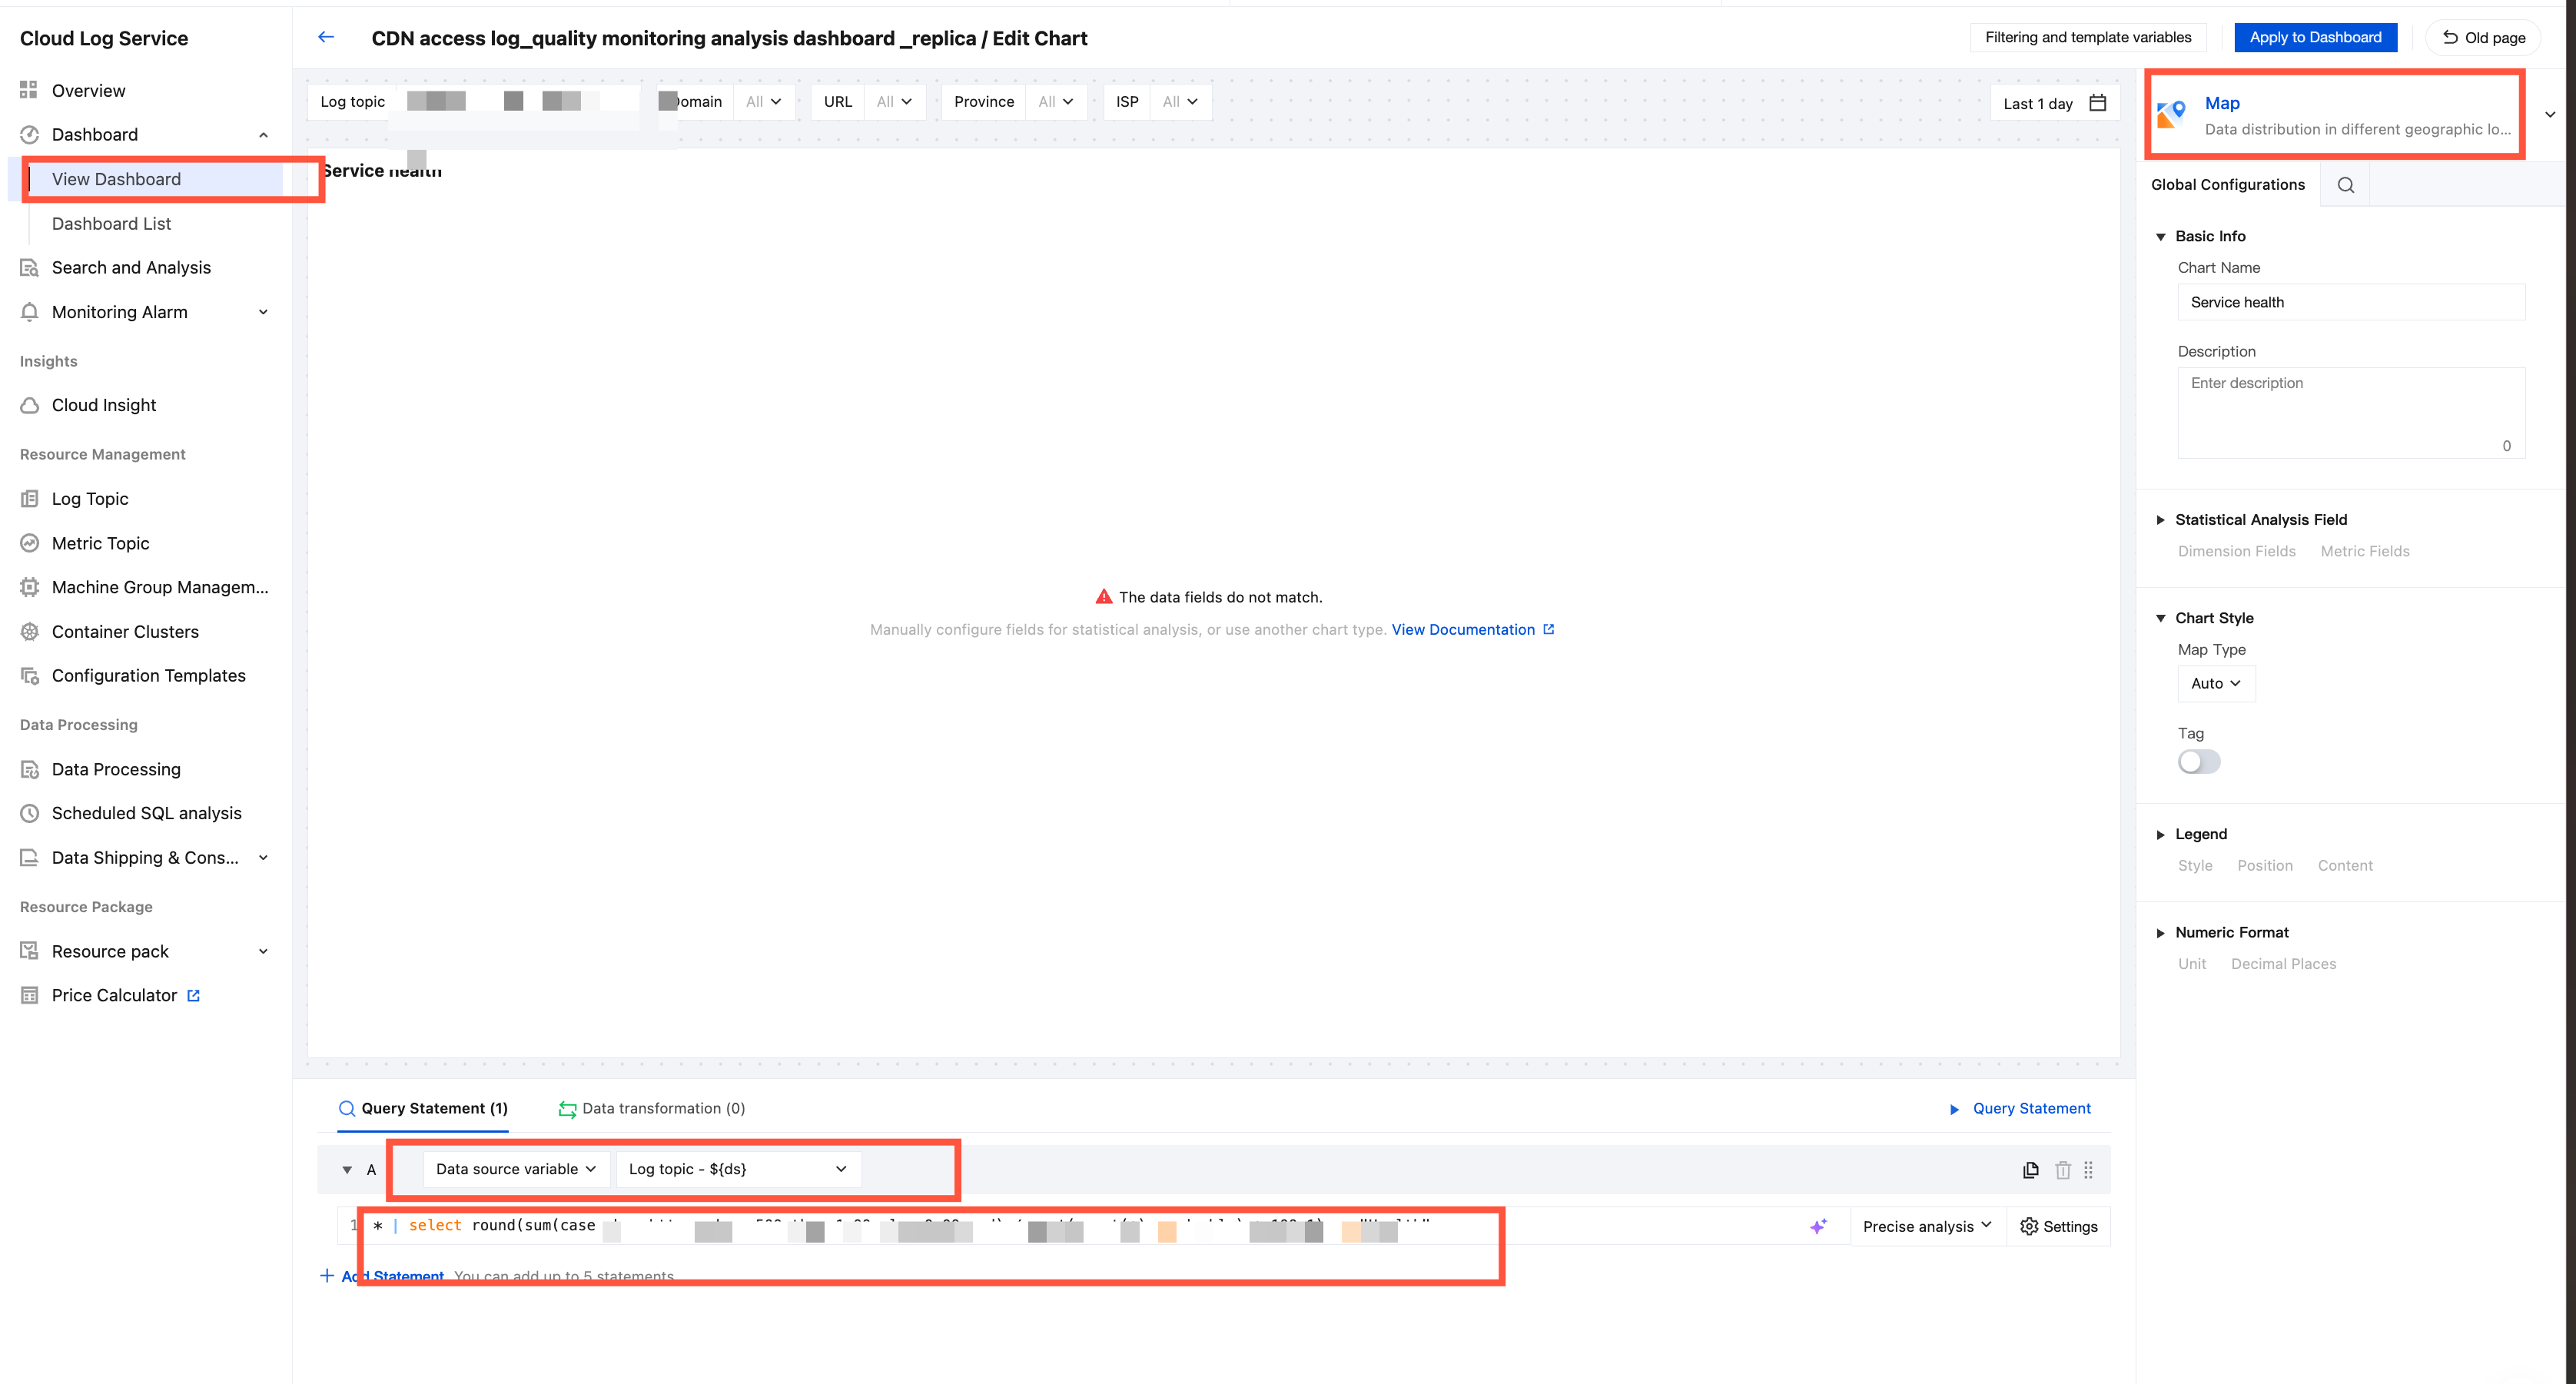
3. After the dashboard is created, click the custom chart to configure the following content.
3. In the execution statement box, enter the following statement to count the number of QBS requests within the selected time range. Then, in the chart configuration, select "Time Series Chart" as the chart type.