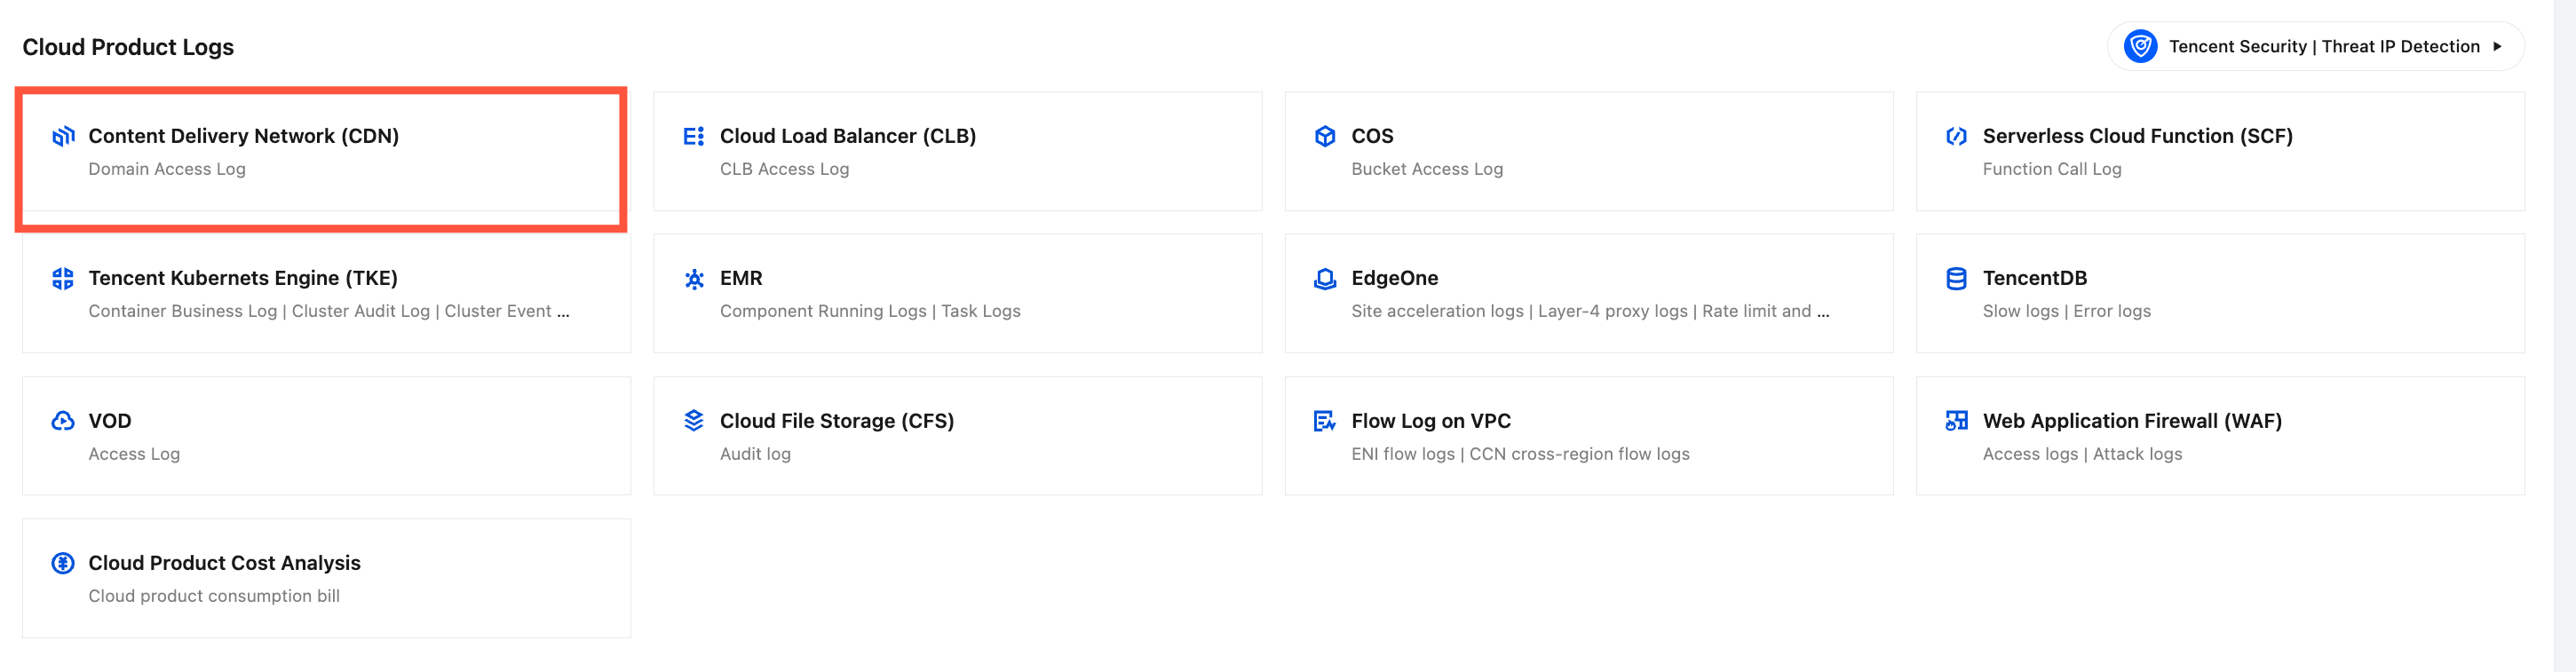
Content Delivery Network (CDN) is a very important internet infrastructure. It allows users to access various images, videos and other resources on the network quickly. During the access process, CDN will generate a large amount of log data. Through the analysis of CDN access logs, users can mine a large amount of useful information for CDN quality and performance analysis, error diagnosis, client distribution analysis, and user behavior analysis.
CLS collects CDN domain access logs in real time, with a data latency of no more than 3 minutes. In traditional CDN log analysis scenarios, logs often need to be downloaded for offline analysis, which typically incurs a latency of within 24 hours.
Analysis reports are ready to use out of the box:
CLS provides an out-of-the-box access analysis dashboard for CDN access log analysis scenarios. This dashboard includes analysis boards for CDN quality and performance, error diagnosis, client distribution, and user behavior. In traditional CDN log analysis scenarios, logs need to be downloaded for offline processing, then uploaded to a data warehouse, followed by a series of data cleansing and data model definition tasks within the warehouse. This process is cumbersome and consumes significant human resources.
Access the Quality Monitoring Analysis Dashboard: It visually displays the access quality of CDN domain names (such as cache hit rate, latency, and so on), assisting in Ops troubleshooting scenarios.
User Behavior Analytics Dashboard: It visually displays user access behavior (such as PV, UV, and so on), assisting in operational analysis scenarios.
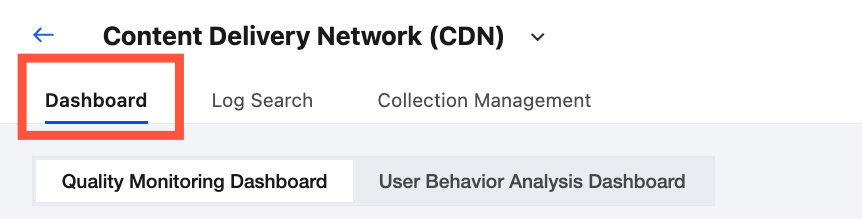
You can view the above CDN pre-configured dashboards by performing the following operations:
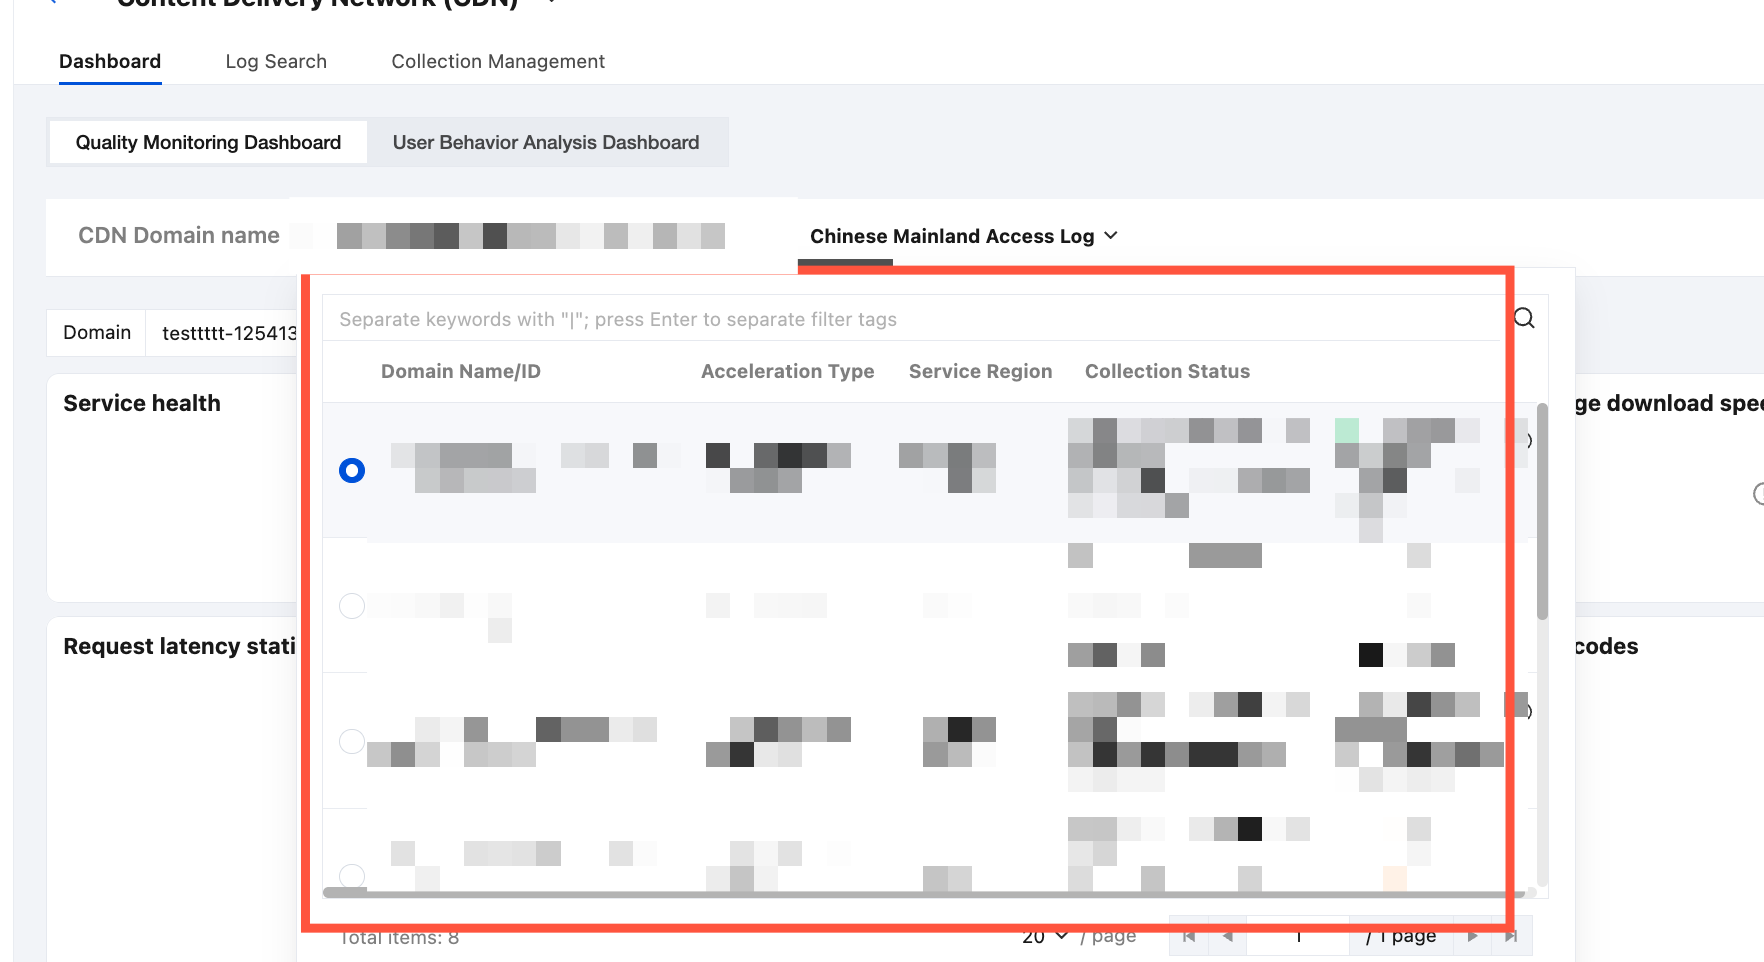
1. On the Tab at the top of the page, click Dashboard, and then select Quality Monitoring Dashboard or User Behavior Analytics Dashboard.
2. Select a domain name for which delivery is enabled in the CDN Domain Name.
Searching and Analyzing CDN Domain Access Logs
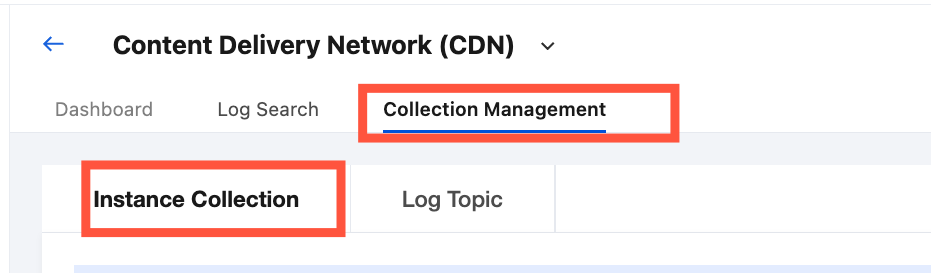
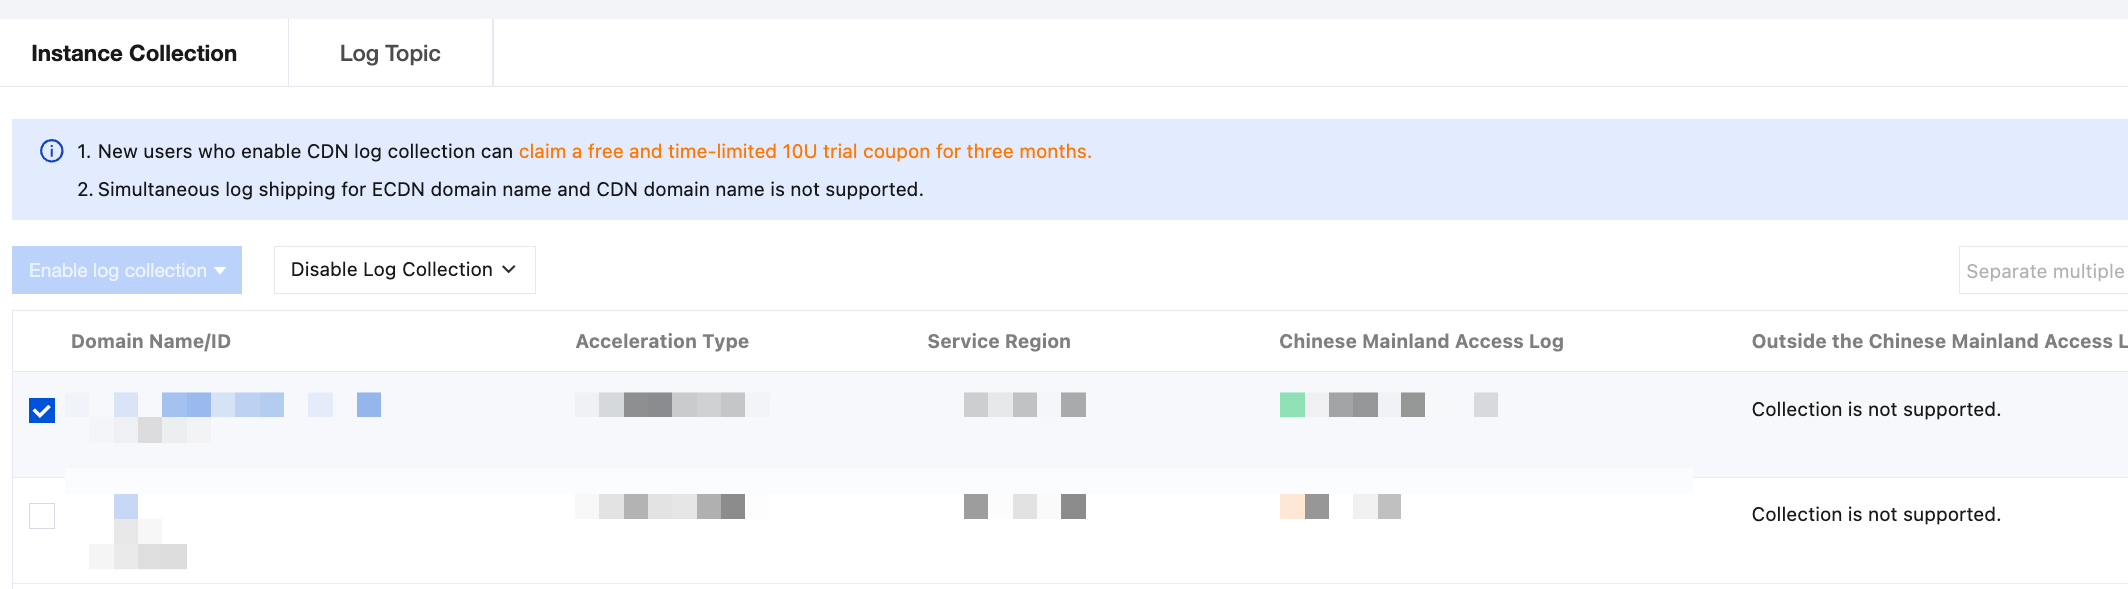
After you enable CDN access log collection, find the instance for which access log collection is enabled in the instance list. Then, go to the log search page to search and analyze access logs. For detailed descriptions of log fields, see Log Field Descriptions.
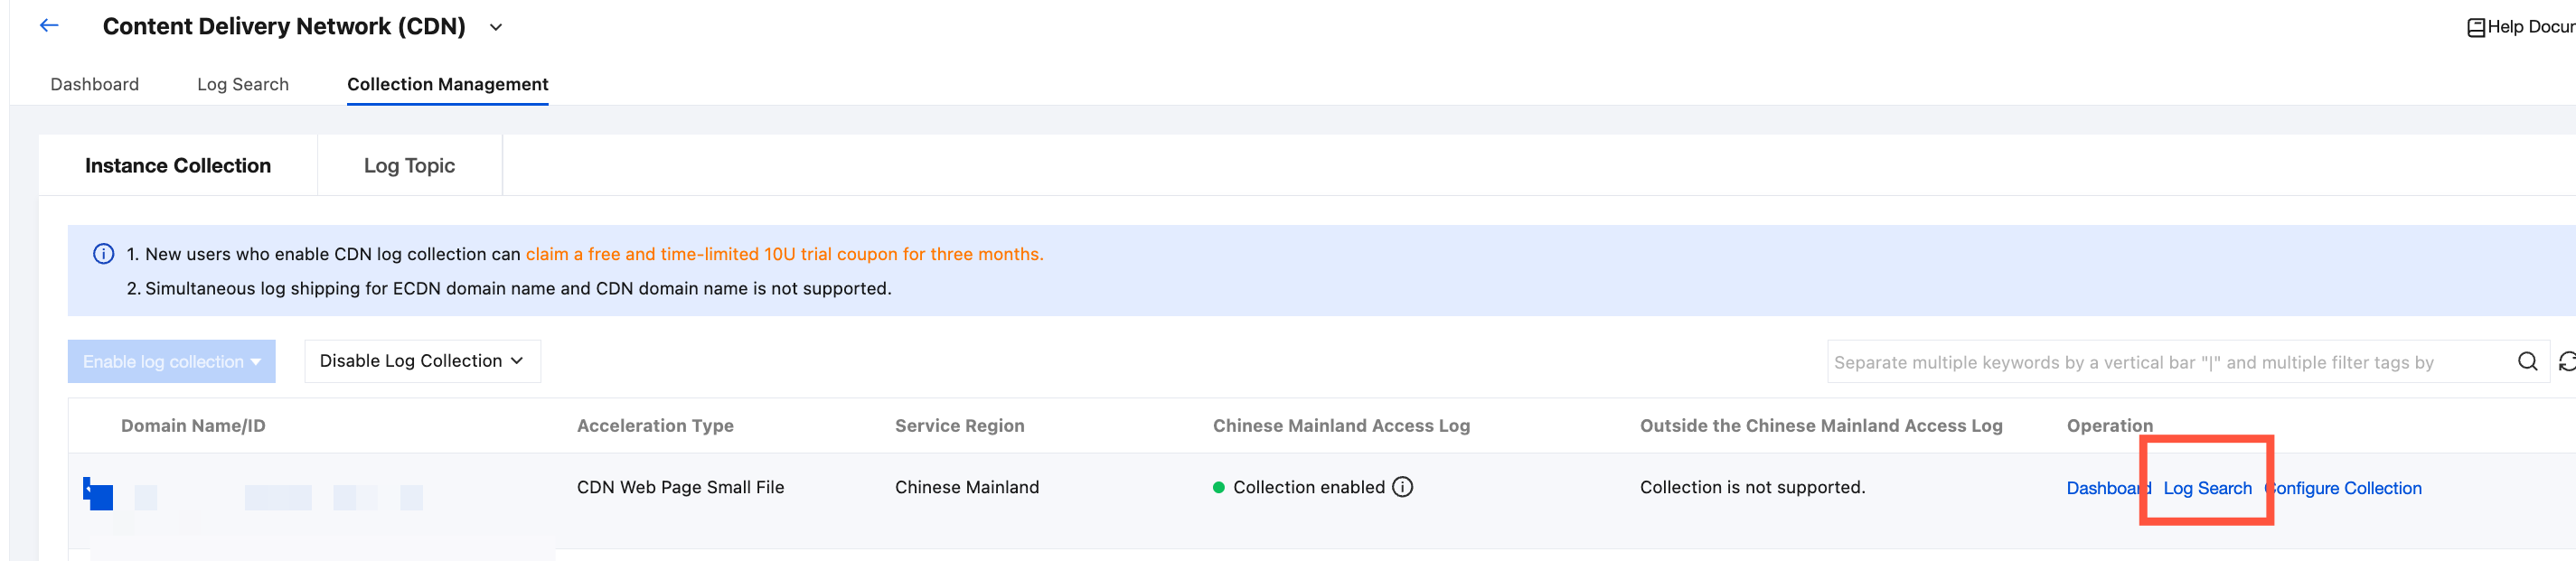
1. After you enable domain access log collection, find the domain name for which access log collection is enabled in the domain name list, and then click Log Search.
2. After clicking, you will be redirected to the log search page, where you can search and analyze access logs. For detailed descriptions of log fields, see Log Field Descriptions.
Introduction to CDN logs
CDN log fields are described as follows.
Log Field
Description
app_id
Tencent Cloud account APPID
client_ip
Client IP
file_size
File size
hit
Cache hit/miss. Both hits on CDN edge servers and parent nodes are marked as hit
host
Domain name
http_code
HTTP status code
isp
ISP
method
HTTP method
param
Parameter carried in URL
proto
HTTP protocol identifier
prov
ISP province
referer
Referer information, i.e., HTTP source address
request_range
Range parameter, i.e., request range
request_time
Response time (in milliseconds), which refers to the time it takes for a node to return all packets to the client after receiving a request.
request_port
A port connecting the client and CDN nodes. This field will be displayed as - if the port does not exist.
rsp_size
Number of returned bytes
time
Request timestamp in UNIX format (in seconds)
ua
User-Agent information
url
Request path
uuid
Unique request ID
version
CDN real-time log version
Using Event Logs for Troubleshooting
You can configure anomaly monitoring alarms based on CDN access logs to monitor anomalies in CDN access traffic in real time. Two examples are provided below.
Scenario 1: monitor CDN access latency and report an alarm when a specified threshold is exceeded
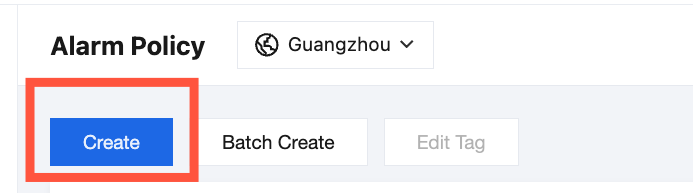
1. Log in to the CLS console, go to the Alarm Policy management page, click Create, and then go to the alarm policy creation page.
2. On the Alarm Policy page, configure the following:
If the latency of the 99th percentile is greater than 100 ms, an alarm is reported and the affected domain name, URL, and client IP are included in the alarm information to facilitate fault locating. The alarm setting statement is as follows:
$1.p99 > 100
Execution cycle: The system is executed every minute at a fixed frequency.
By configuring multidimensional analysis, you can include the affected domain name, URL, and client IP in the alarm information to help developers in fault locating.
Notification Channel Group: By associating a notification channel group, you can configure the method and recipients for sending notifications. Supported notification methods include SMS, email, phone calls, WeChat, WeCom, DingTalk, Feishu, and custom interface callbacks (webhook). For details, see Manage Notification Channel Groups.
3. Once an alarm is triggered, users can obtain key information via WeChat, WeCom, and SMS.
Scenario 2: monitor resource access errors and report an alarm when the period-on-period increase exceeds a specified threshold
1. Refer to Case 1, log in to the CLS console, go to the Alarm Policy management page, click New, and then go to the alarm policy creation page.
2. In the execution statement, enter the following statement, select a time range of 1 minute, and calculate the number of errors increment for the last minute compared to the previous minute.
3. The trigger condition in the alarm policy is configured as follows: Number of errors in the recent minute – Number of errors in the last minute > Specified threshold.