The delivery feature of Cloud Log Service (CLS) integrates with the upstream link of the product ecosystem, allowing data from Tencent Cloud Object Storage (COS) to be imported into Cloud Log Service. It enables operations such as query, analysis, and processing of log data, and mining the value of log data. You only need to perform simple configurations on the log service console to complete data import.
Prerequisites
Activate CLS, create a logset and a log topic, and collect log data.
Activate COS and ensure that the files to be imported have been uploaded to the COS Bucket. For more information, see Upload Objects.
Grant the current operating account access to COS, which authorizes CLS to use the CLS_QcsRole role to access your COS resources. For more information, see Configure COS Delivery Permissions.
Configuration
1. Select a log topic: select an existing log topic or create a log topic for storing the data to be imported from COS to CLS.
2. Configure the data source: path to the COS object to be imported and the corresponding compression mode (GZIP, LZOP, SNAPPY, or no compression).
3. Parsing configuration: Configure the parsing format of the imported files. Currently supported formats include single-line full text/multi-line full text/single-line regular expression/multi-line regular expression/JSON/delimiter.
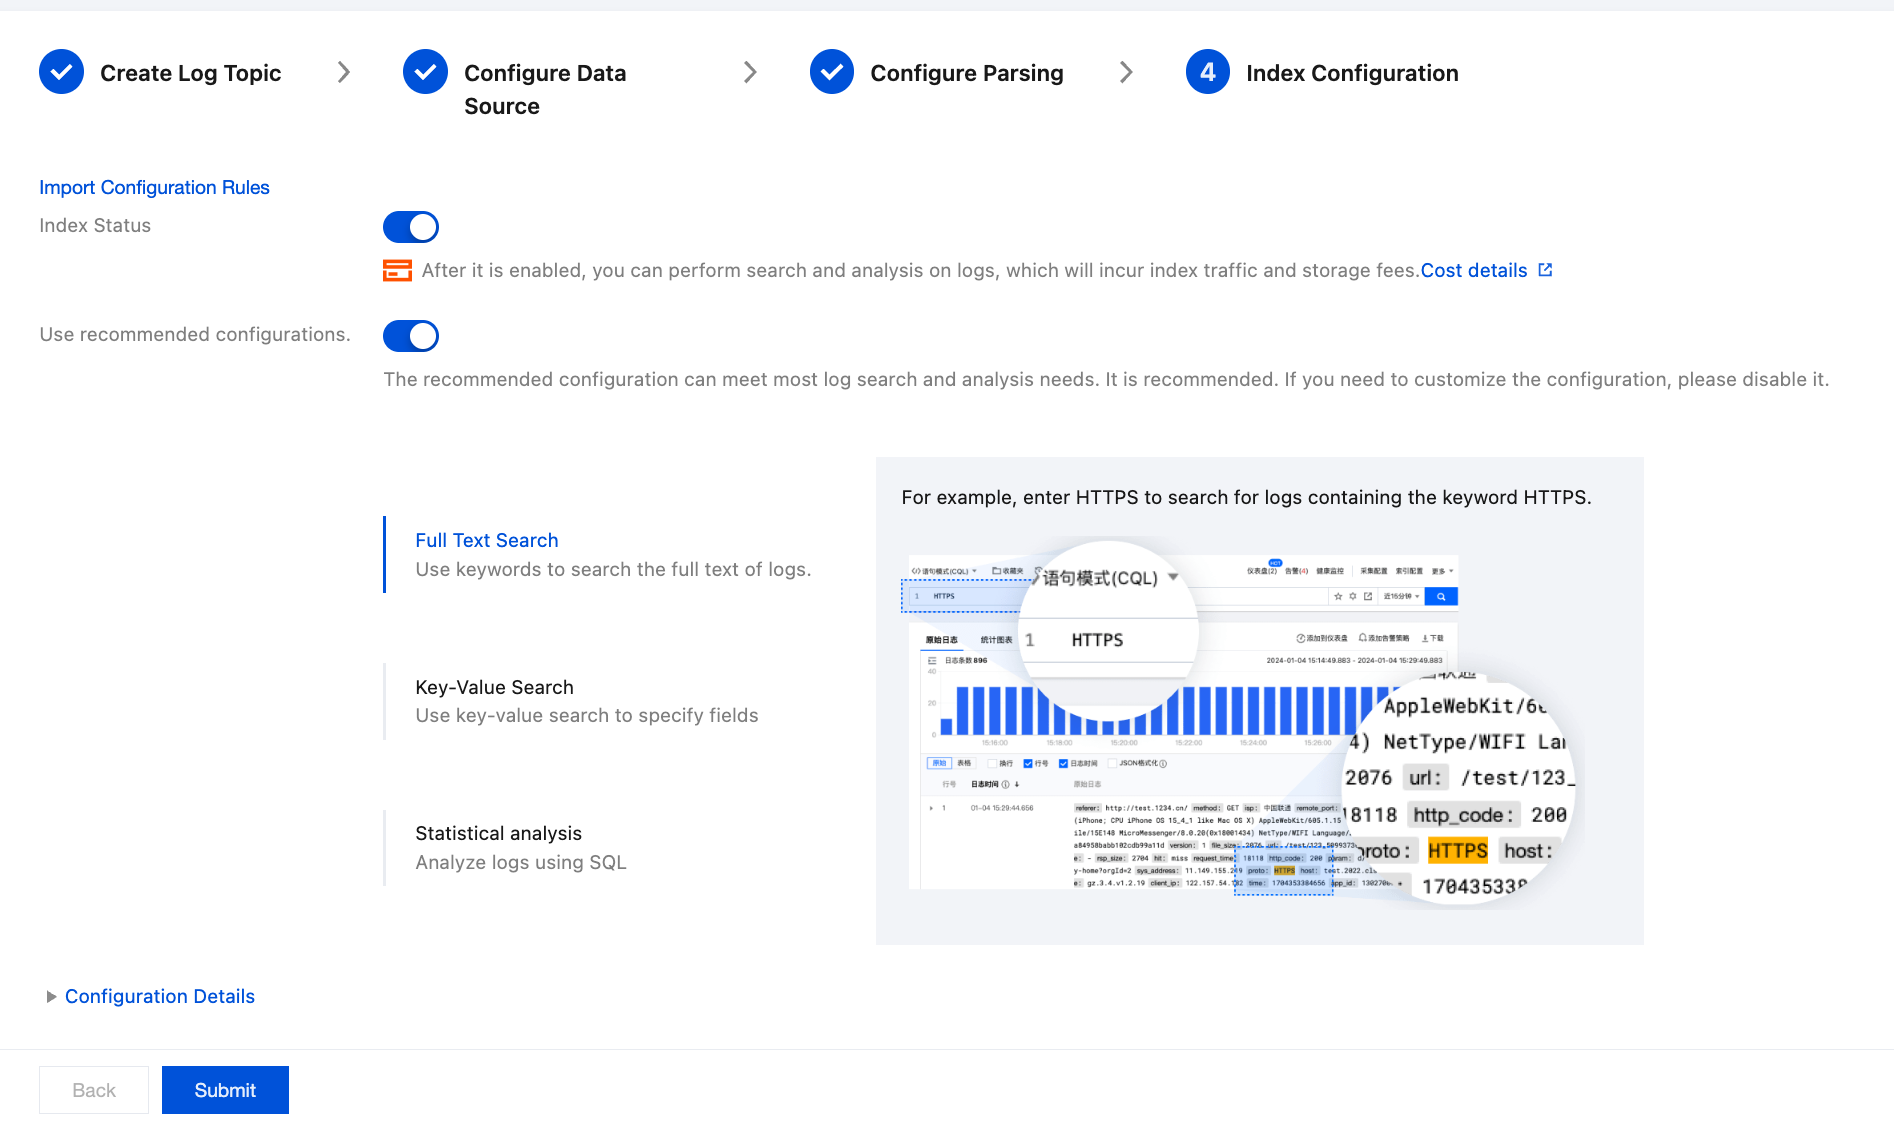
4. Configure indexes: you need to configure indexes for the current topic, and enable index configuration before you can perform searches. If you select an existing log topic, the new index configuration takes effect only for the modified data.
Directions
Step 1: Creating/Selecting a Log Topic
Create a Log Topic
Using an Existing Log Topic
If you want to create a new log topic, perform the following operations:
2. In the left sidebar, select Overview to go to the overview page.
3. In Fast Access, select Data Import, locate and click Import from COS to go to the LogListener collection configuration process.
4. On the Create Log Topic page, enter the log topic name, configure the log storage period, select a logset, and click Next based on your actual needs.
If you want to select an existing log topic, perform the following operations:
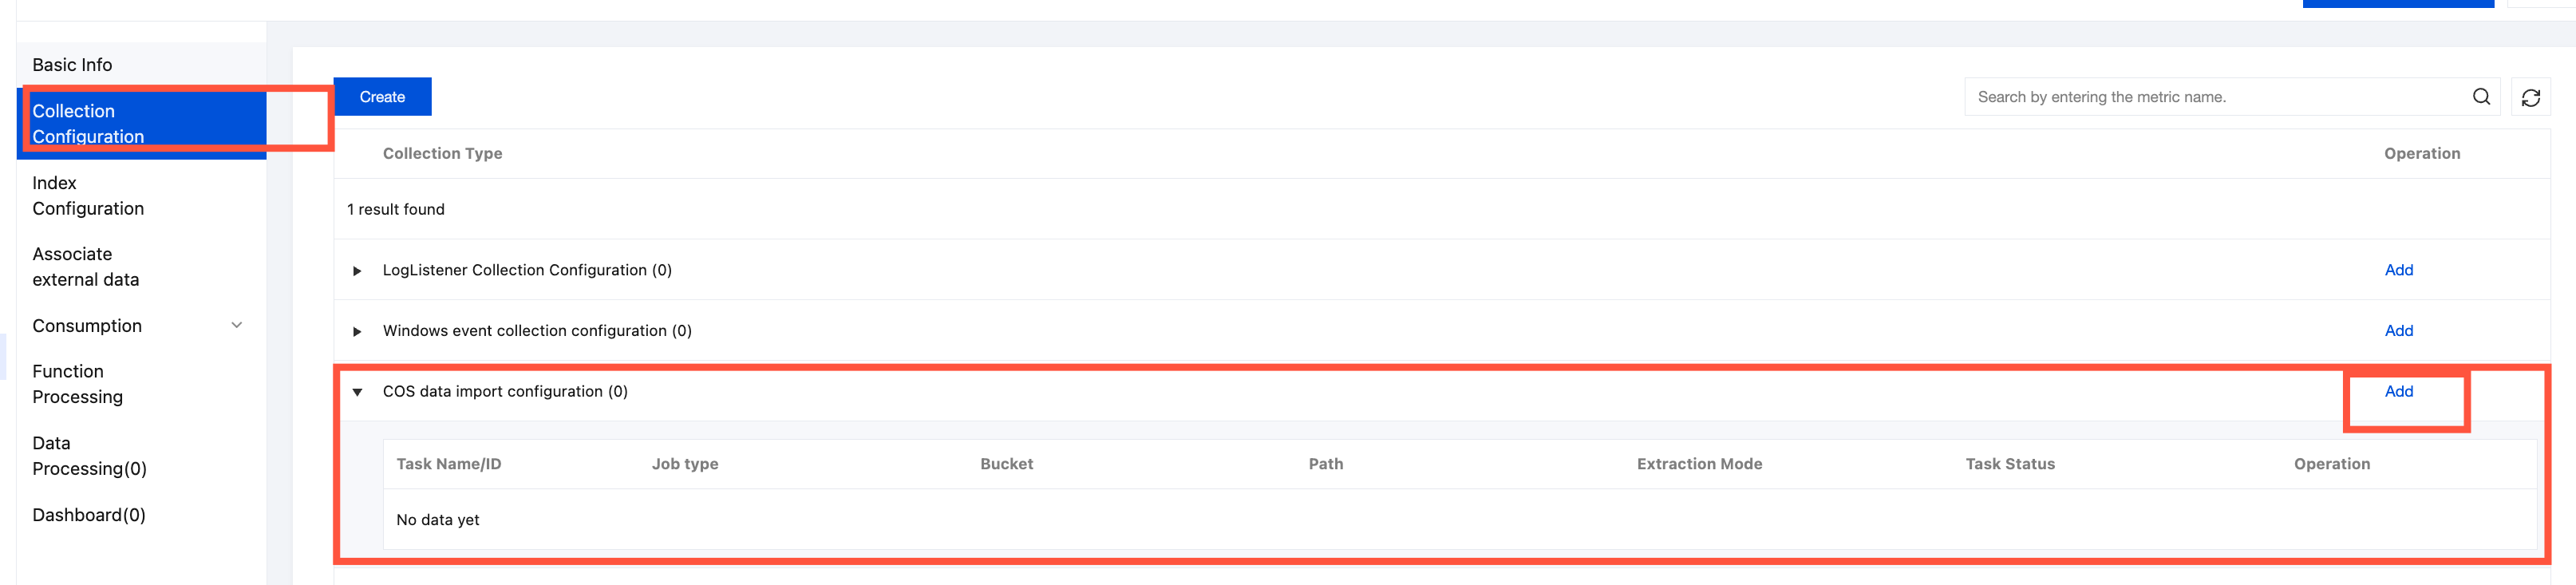
2. In the left sidebar, click Log Topic. Then, select the log topic you want to ship and click its name to go to the log topic management page.
3. Select the Collection Configuration tab, and click Add under COS data import configuration.
Step 2. Configure the data source
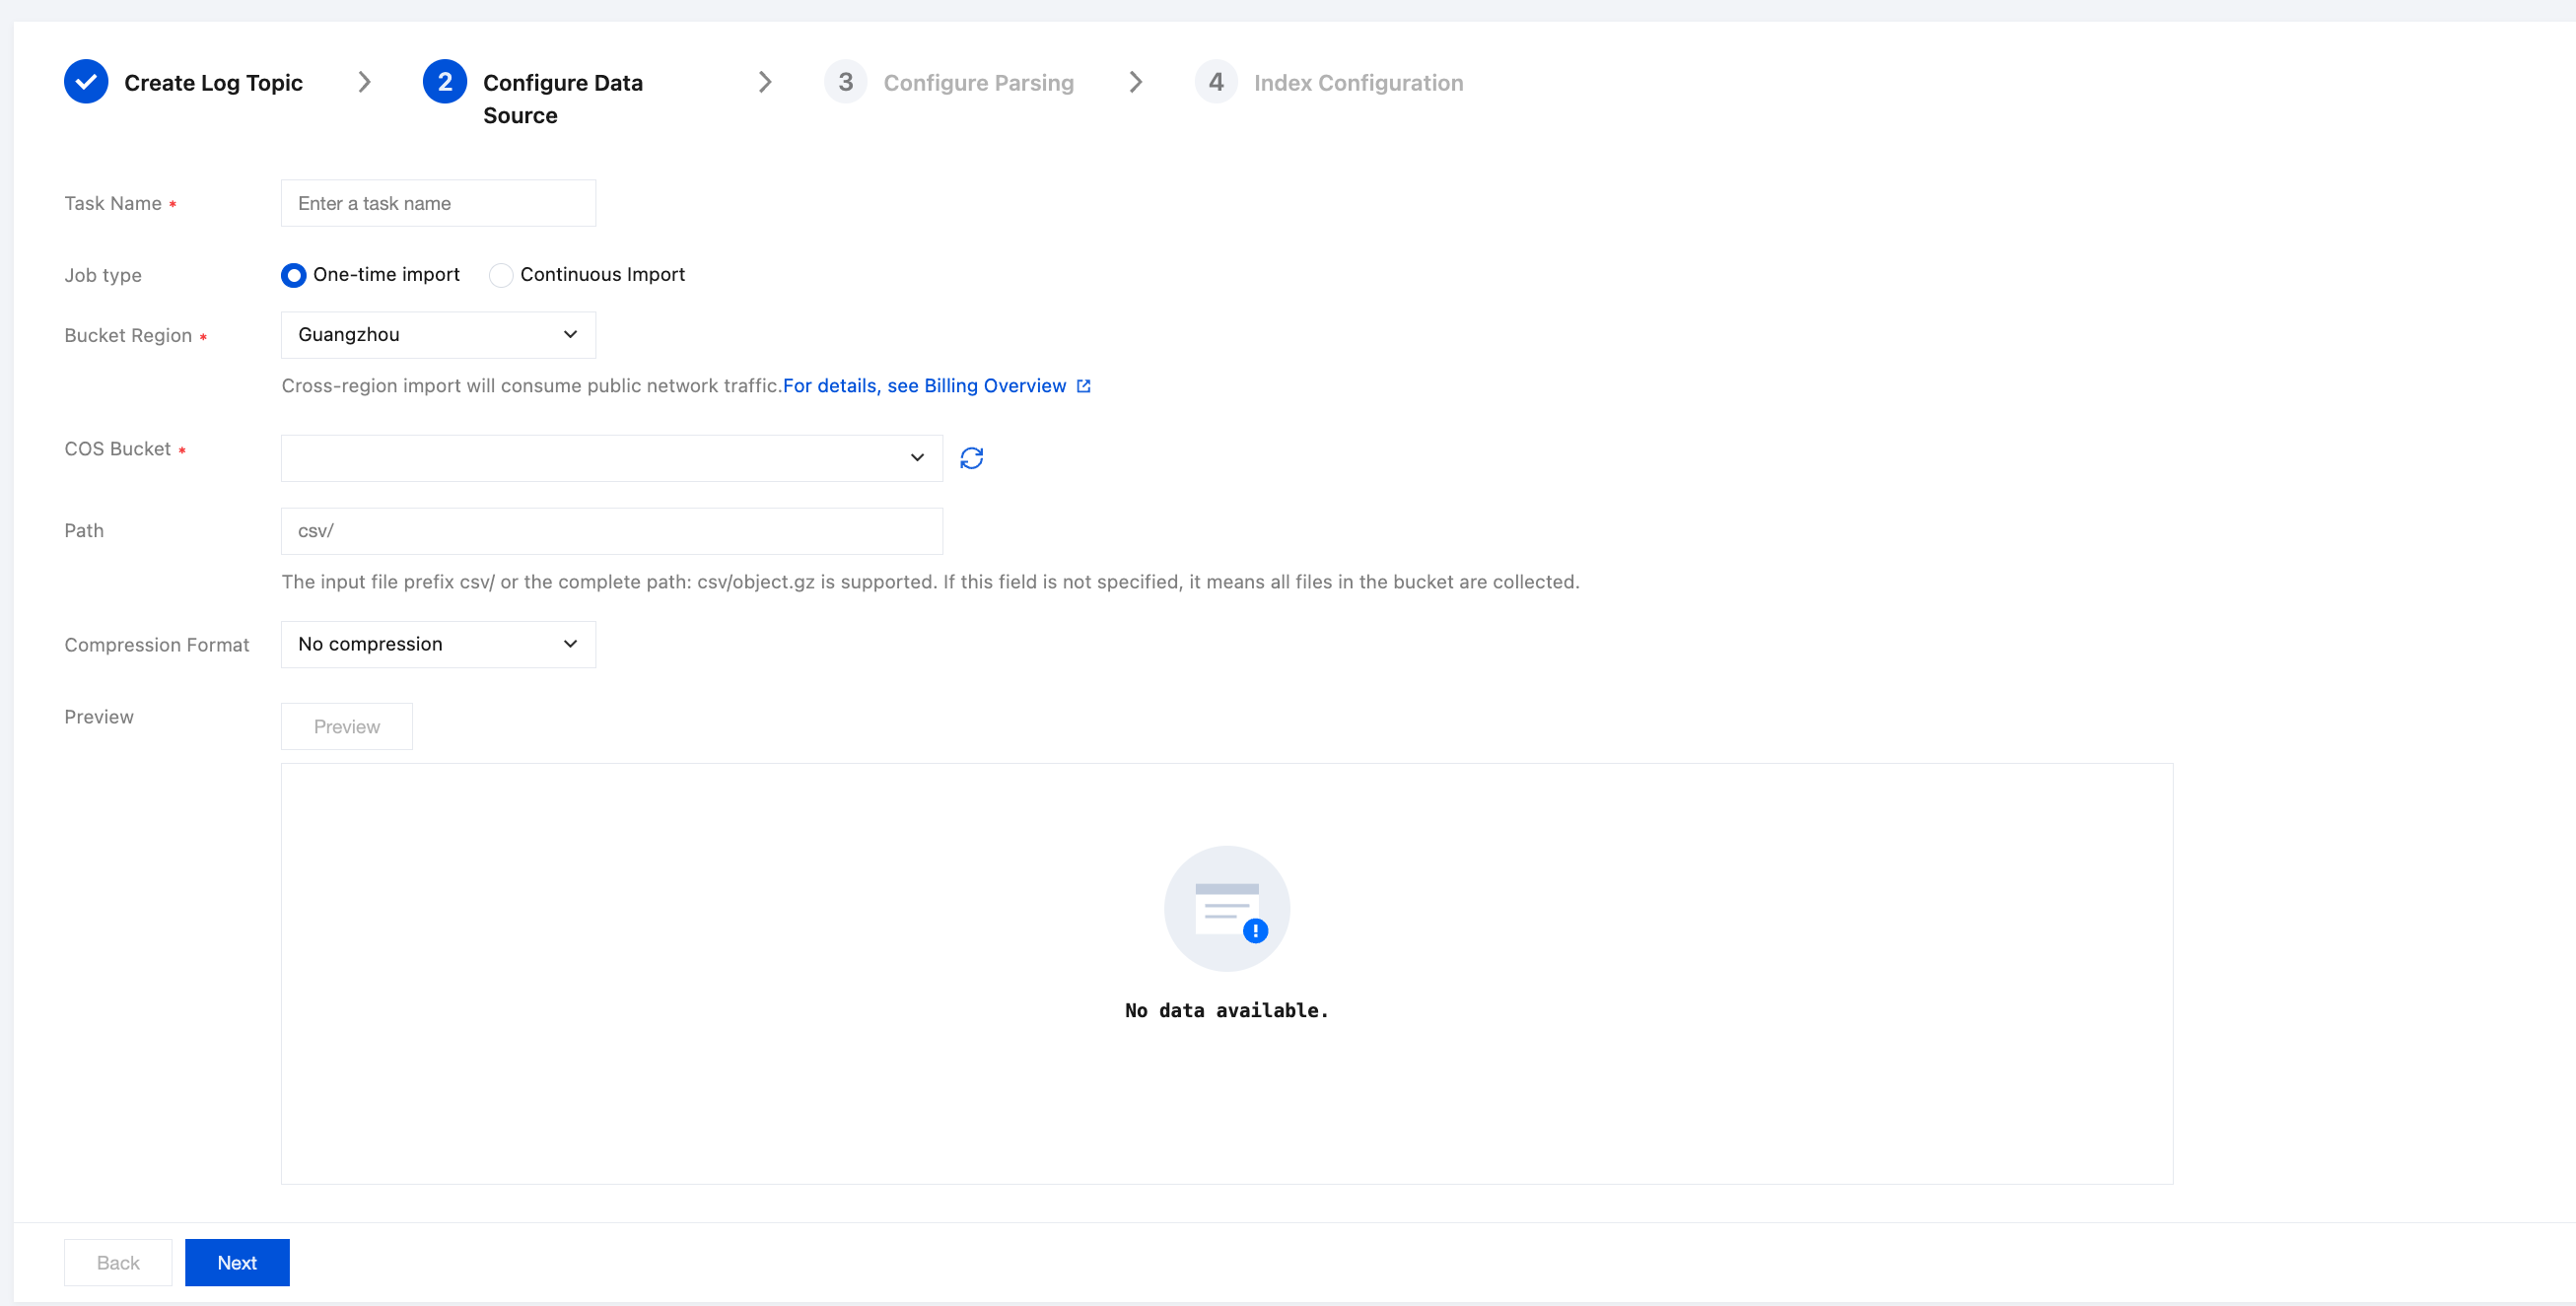
1. On the data source configuration page, configure the following information in sequence:
Configuration Item
Description
Rule
Required
Task Name
Set the name of the import task.
The value can contain letters, numbers, underscores (_), and hyphens (-).
Yes
Job type
Specify whether the import is a one-time operation or a continuous process performed in multiple batches.
Single Selection
Yes
Bucket Region
Set the region of the bucket where the file to be imported resides. If the file to be imported and the destination log topic are in different regions, public network fees will incur due to cross-region access.
Select an option from the list.
Yes
COS Bucket
Select the bucket where the file to be imported resides. The drop-down list box provides all buckets in the selected region for you to choose.
Select an option from the list.
Yes
Path
Enter the prefix of the folder where the COS file to be imported resides for accurate locating. You can enter the file prefix
Note:
Files with the storage type of "Archive Storage" or "Deep Archive Storage" are not supported for collection.
Enter a value.
Yes
Compression Format
Select the compression format of the COS file to be imported. CLS decompresses and reads data according to the corresponding format, supporting gzip/lzop/snappy/bzip2/zip/zstd/deflate/lz4(frame)/no compression.
Select an option from the list.
Yes
2. Click Preview. The system will select a piece of path data that meets the configuration rules for display and indicate the total number of files under the entered file prefix, as shown in the following figure:
3. After confirming that the data for preview is correct, click Next.
Step 3. Configure parsing
1. On the parsing configuration page, configure the following information:
Extraction mode: The following extraction modes can be selected.
Single-Line Full-Text
Single-line - Full regex
Multi-line full-text
Multi-line - Full regex
JSON
Delimiter
A single-line full-text log refers to a log where each line represents a complete log entry. When collecting logs, CLS uses the line break \\n as the delimiter to mark the end of each log entry. For unified structured management, each log will have a default key-value pair __CONTENT__. However, the log data itself will not be processed in a structured manner, nor will log fields be extracted. The time attribute of a log is determined by the time when the log is collected.
Assume that the raw data of a log is:
Tue Jan 2212:08:15 CST 2019 Installed: libjpeg-turbo-static-1.2.90-6.el7.x86_64
The data collected into CLS is:
__CONTENT__:Tue Jan 2212:08:15 CST 2019 Installed: libjpeg-turbo-static-1.2.90-6.el7.x86_64
The single-line full regular expression format is usually used to process structured logs. This represents a log parsing mode in which multiple key-value pairs are extracted from a complete log entry using regular expressions.
http_user_agent: Mozilla/5.0 (Windows NT 10.0; WOW64; rv:64.0) Gecko/20100101 Firefox/64.0
remote_addr: 10.135.46.111
request_length: 782
request_method: GET
request_time: 0.354
request_url: /my/course/1
status: 200
time_local: [22/Jan/2019:19:19:30 +0800]
upstream_response_time: 0.354
Single-Line Full Regular Expression Mode:
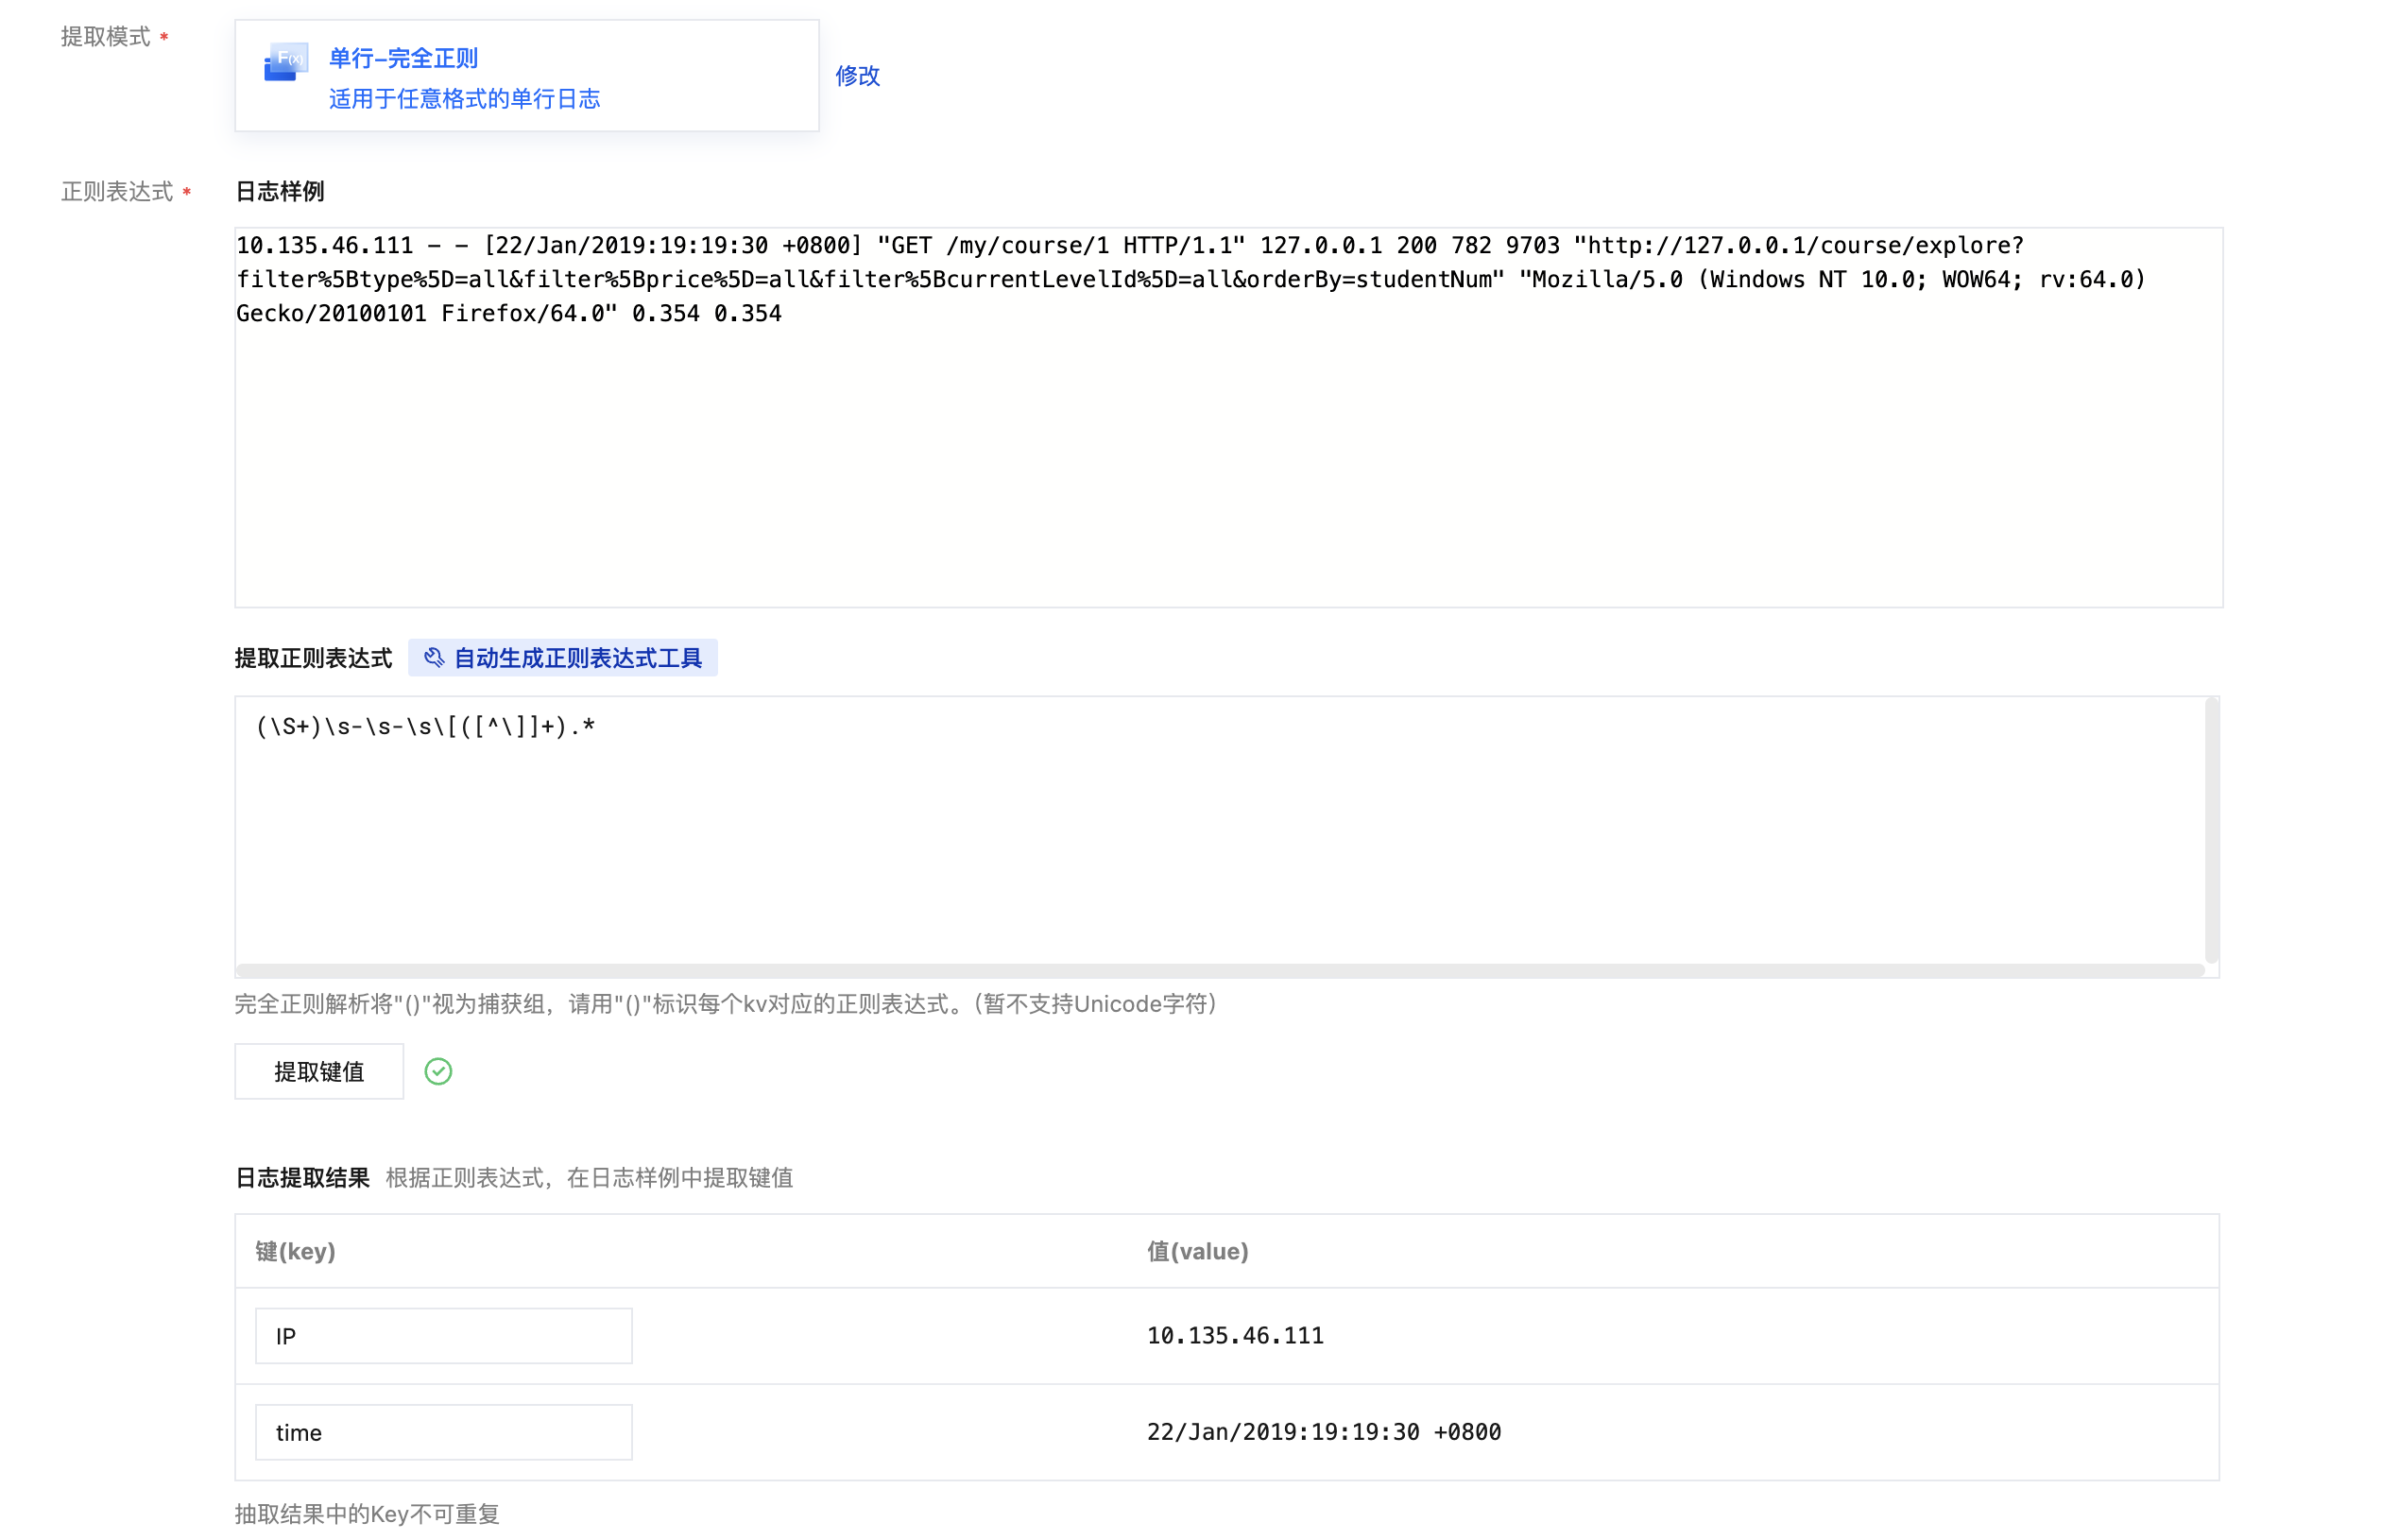
1. On the Collection Configuration page, set "Extraction Mode" to Single-Line Full Regular Expression and enter a log sample in the "Log Sample" text box. As shown below:
2.
Define the regular expression according to the following rules:
The system provides two modes, Manual Mode and Auto Mode, for defining regular expressions. Based on the mode you select and the defined regular expression, the system extracts key-value pairs to verify the regular expression.
Multi-line - Full regex
Manual Mode
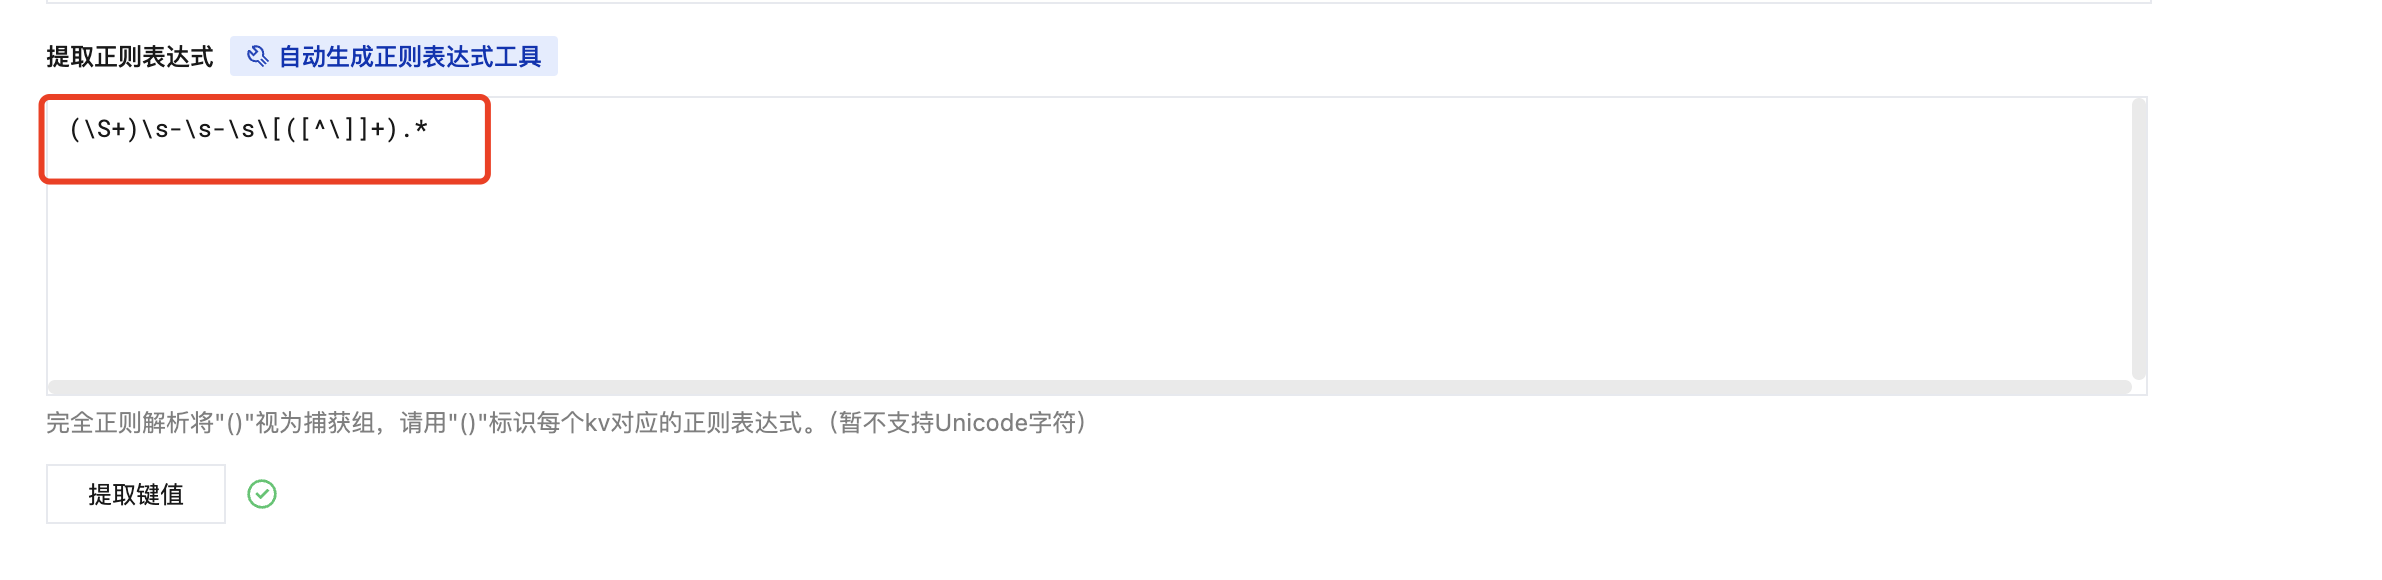
You can manually enter an expression to extract key-value pairs for verification.
(1) In the text box of Regular Expression, enter a regular expression.
(2) Click Verify and the system will judge whether the log sample matches the regular expression.
You can click Auto Regular Expression Tool to switch to Auto Mode:
(1) In the pop-up "
Regular Expression Auto-Generation
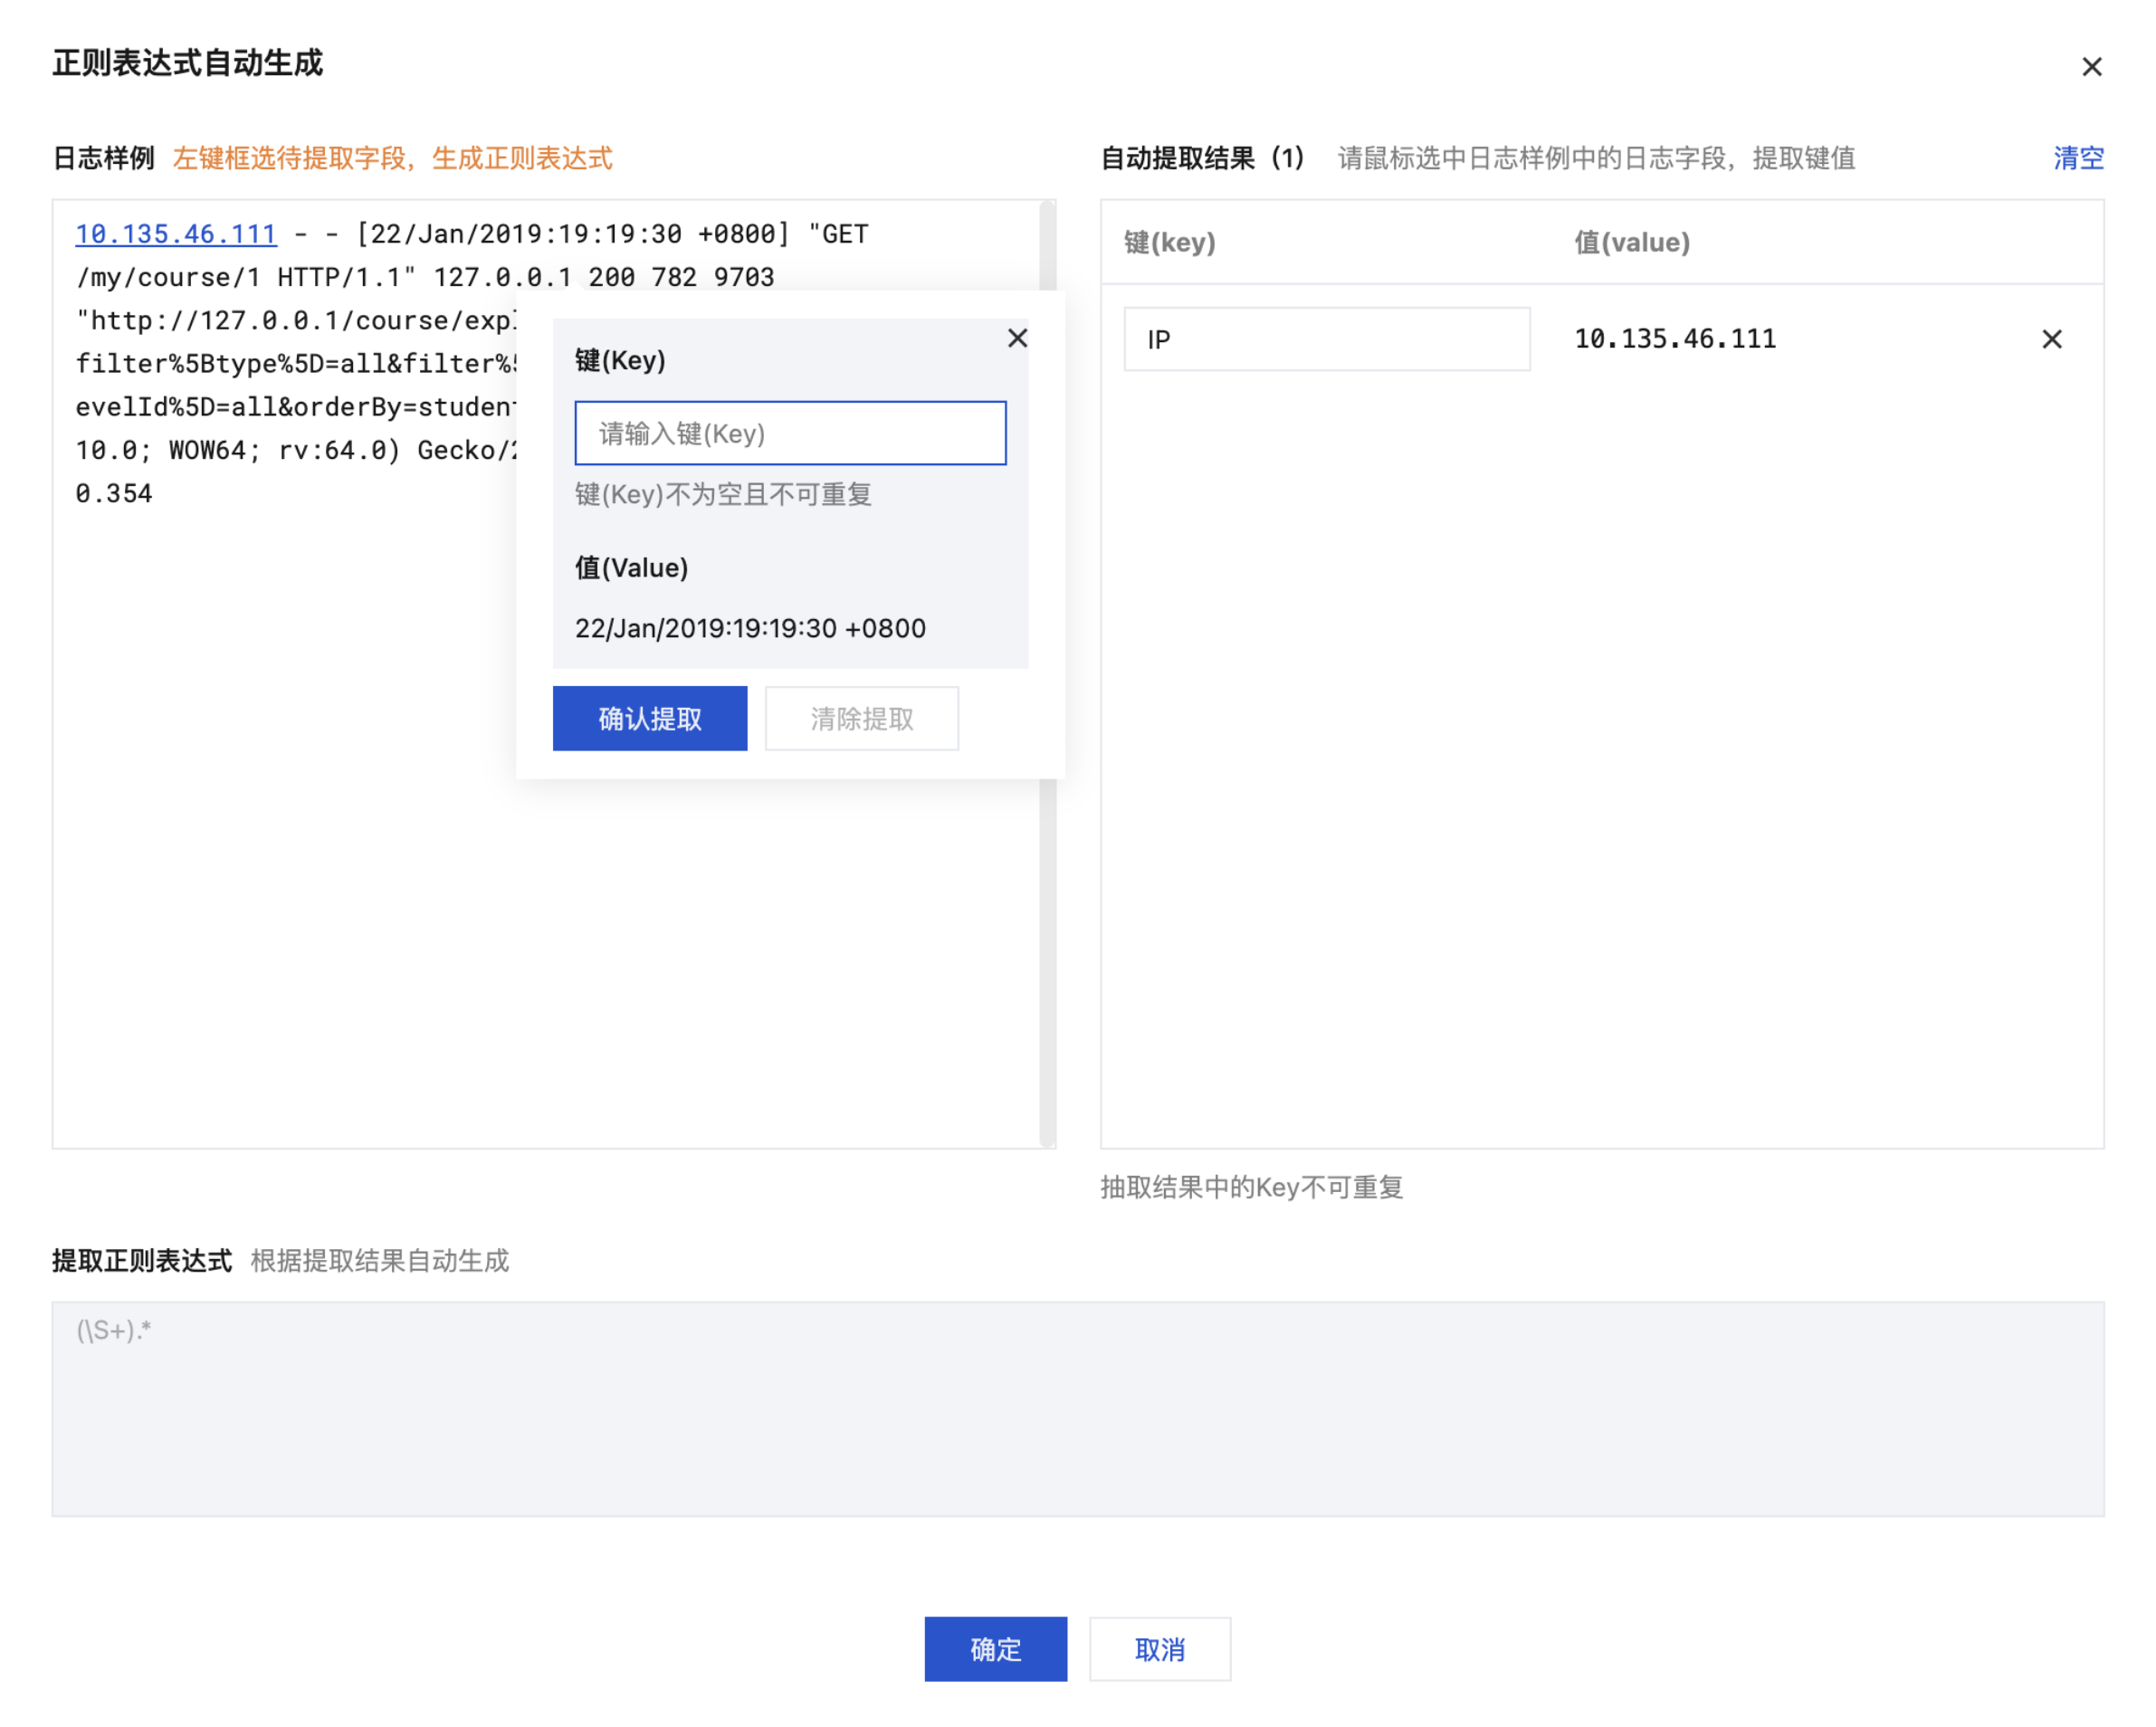
" modal view, based on your actual search and analysis needs, left-click to select the log content from which you need to extract key-value pairs. Then, in the pop-up text box, enter the key name and click Confirm Extraction. As shown below:
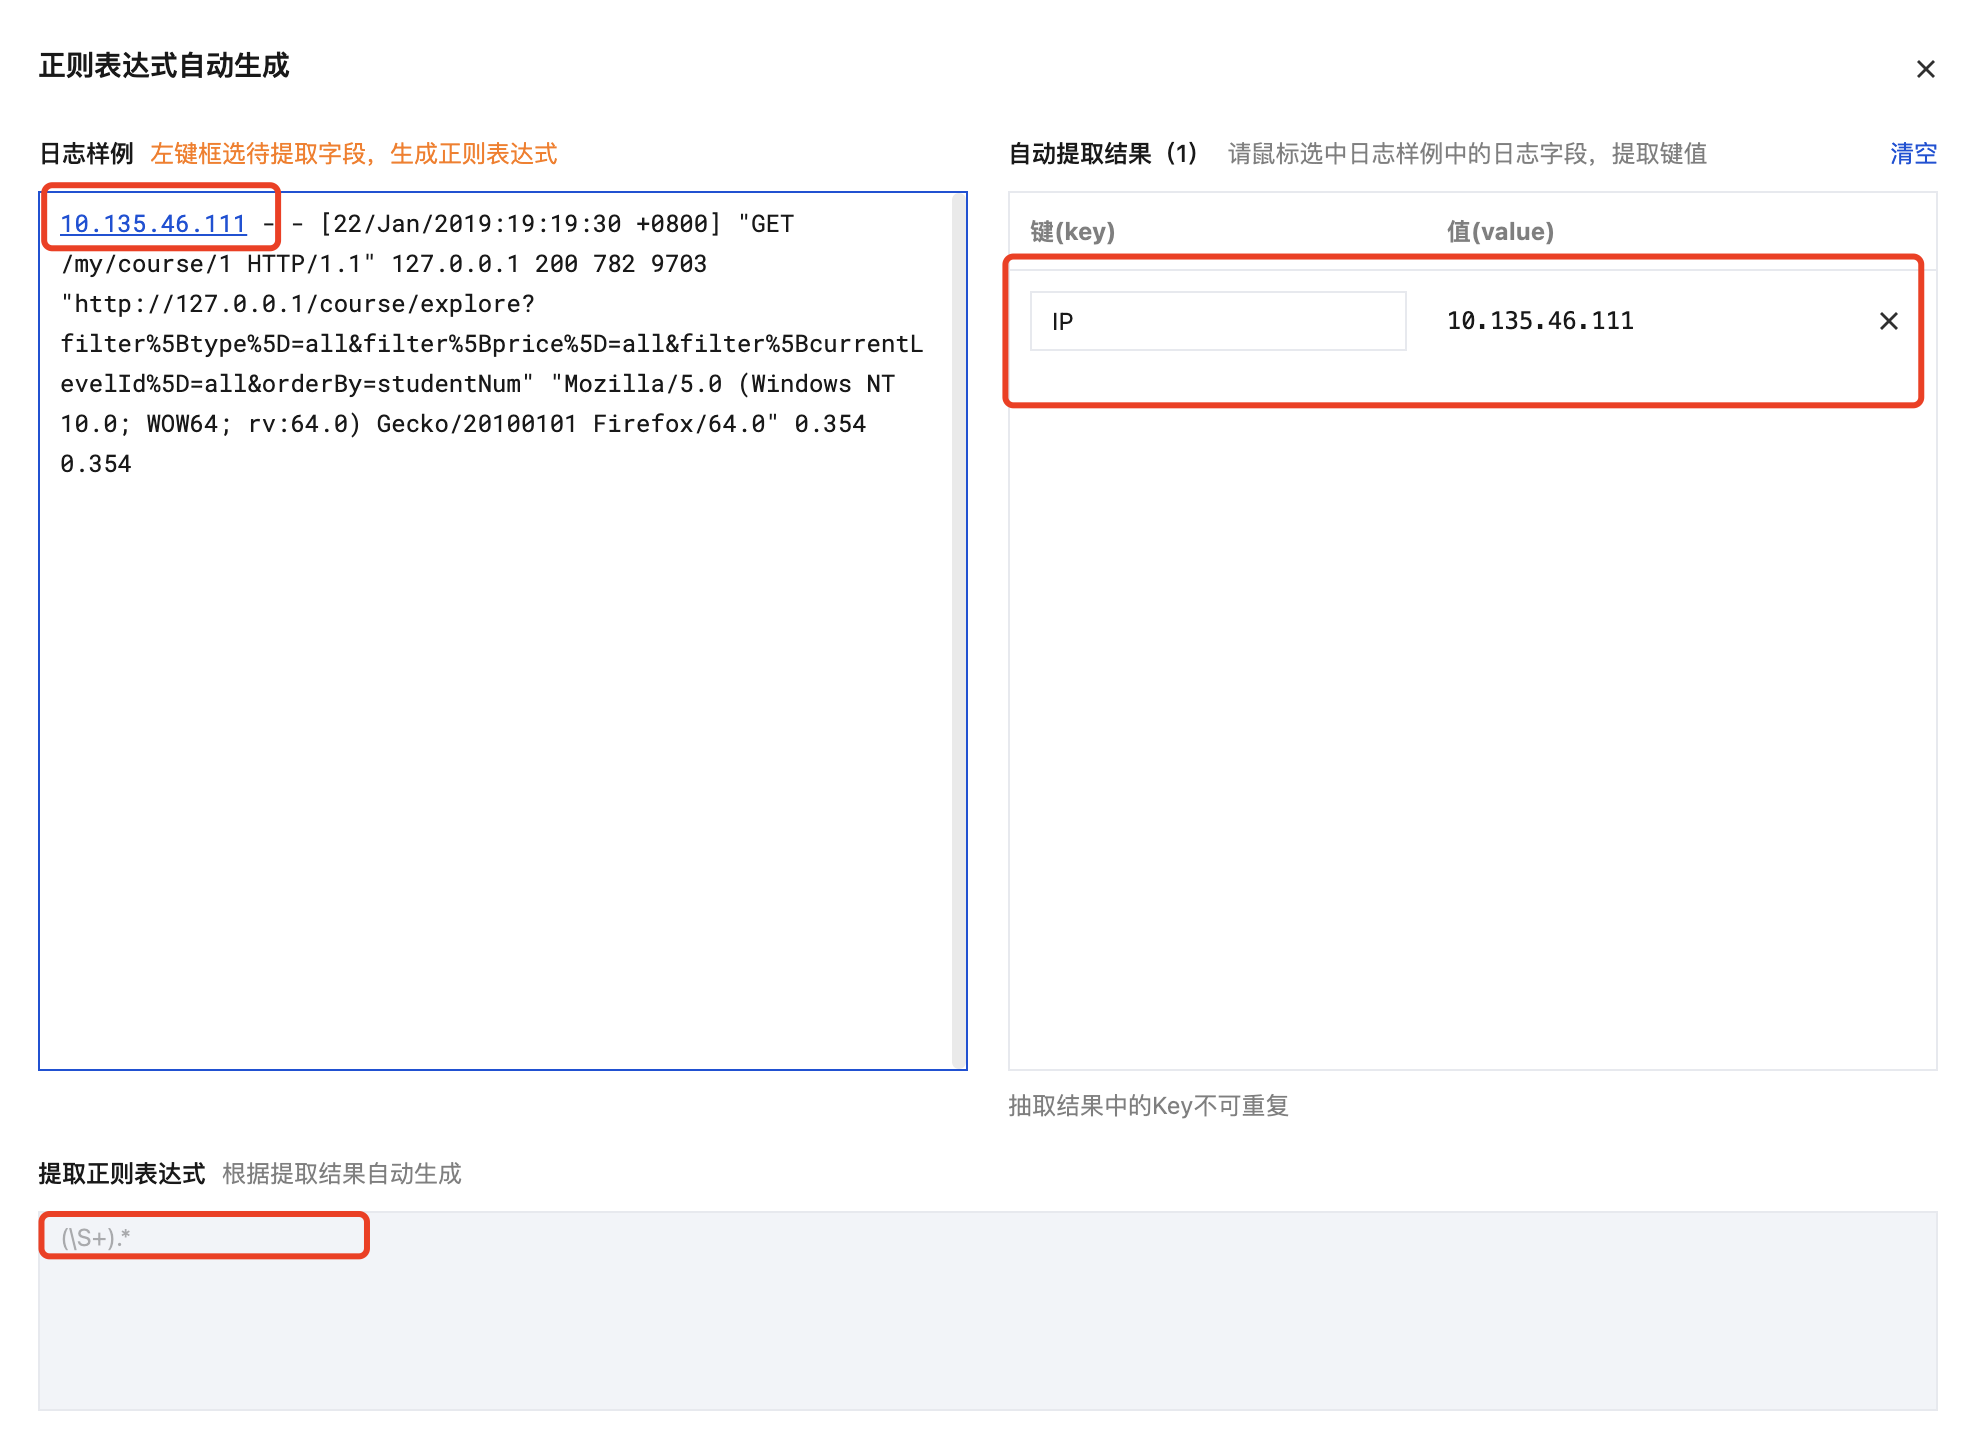
The system will automatically generate a regular expression for this part of the content. The automatic extraction result will appear in the key-value table on the right, and the extraction regular expression automatically generated based on the automatic extraction result will appear in the table below. As shown below:
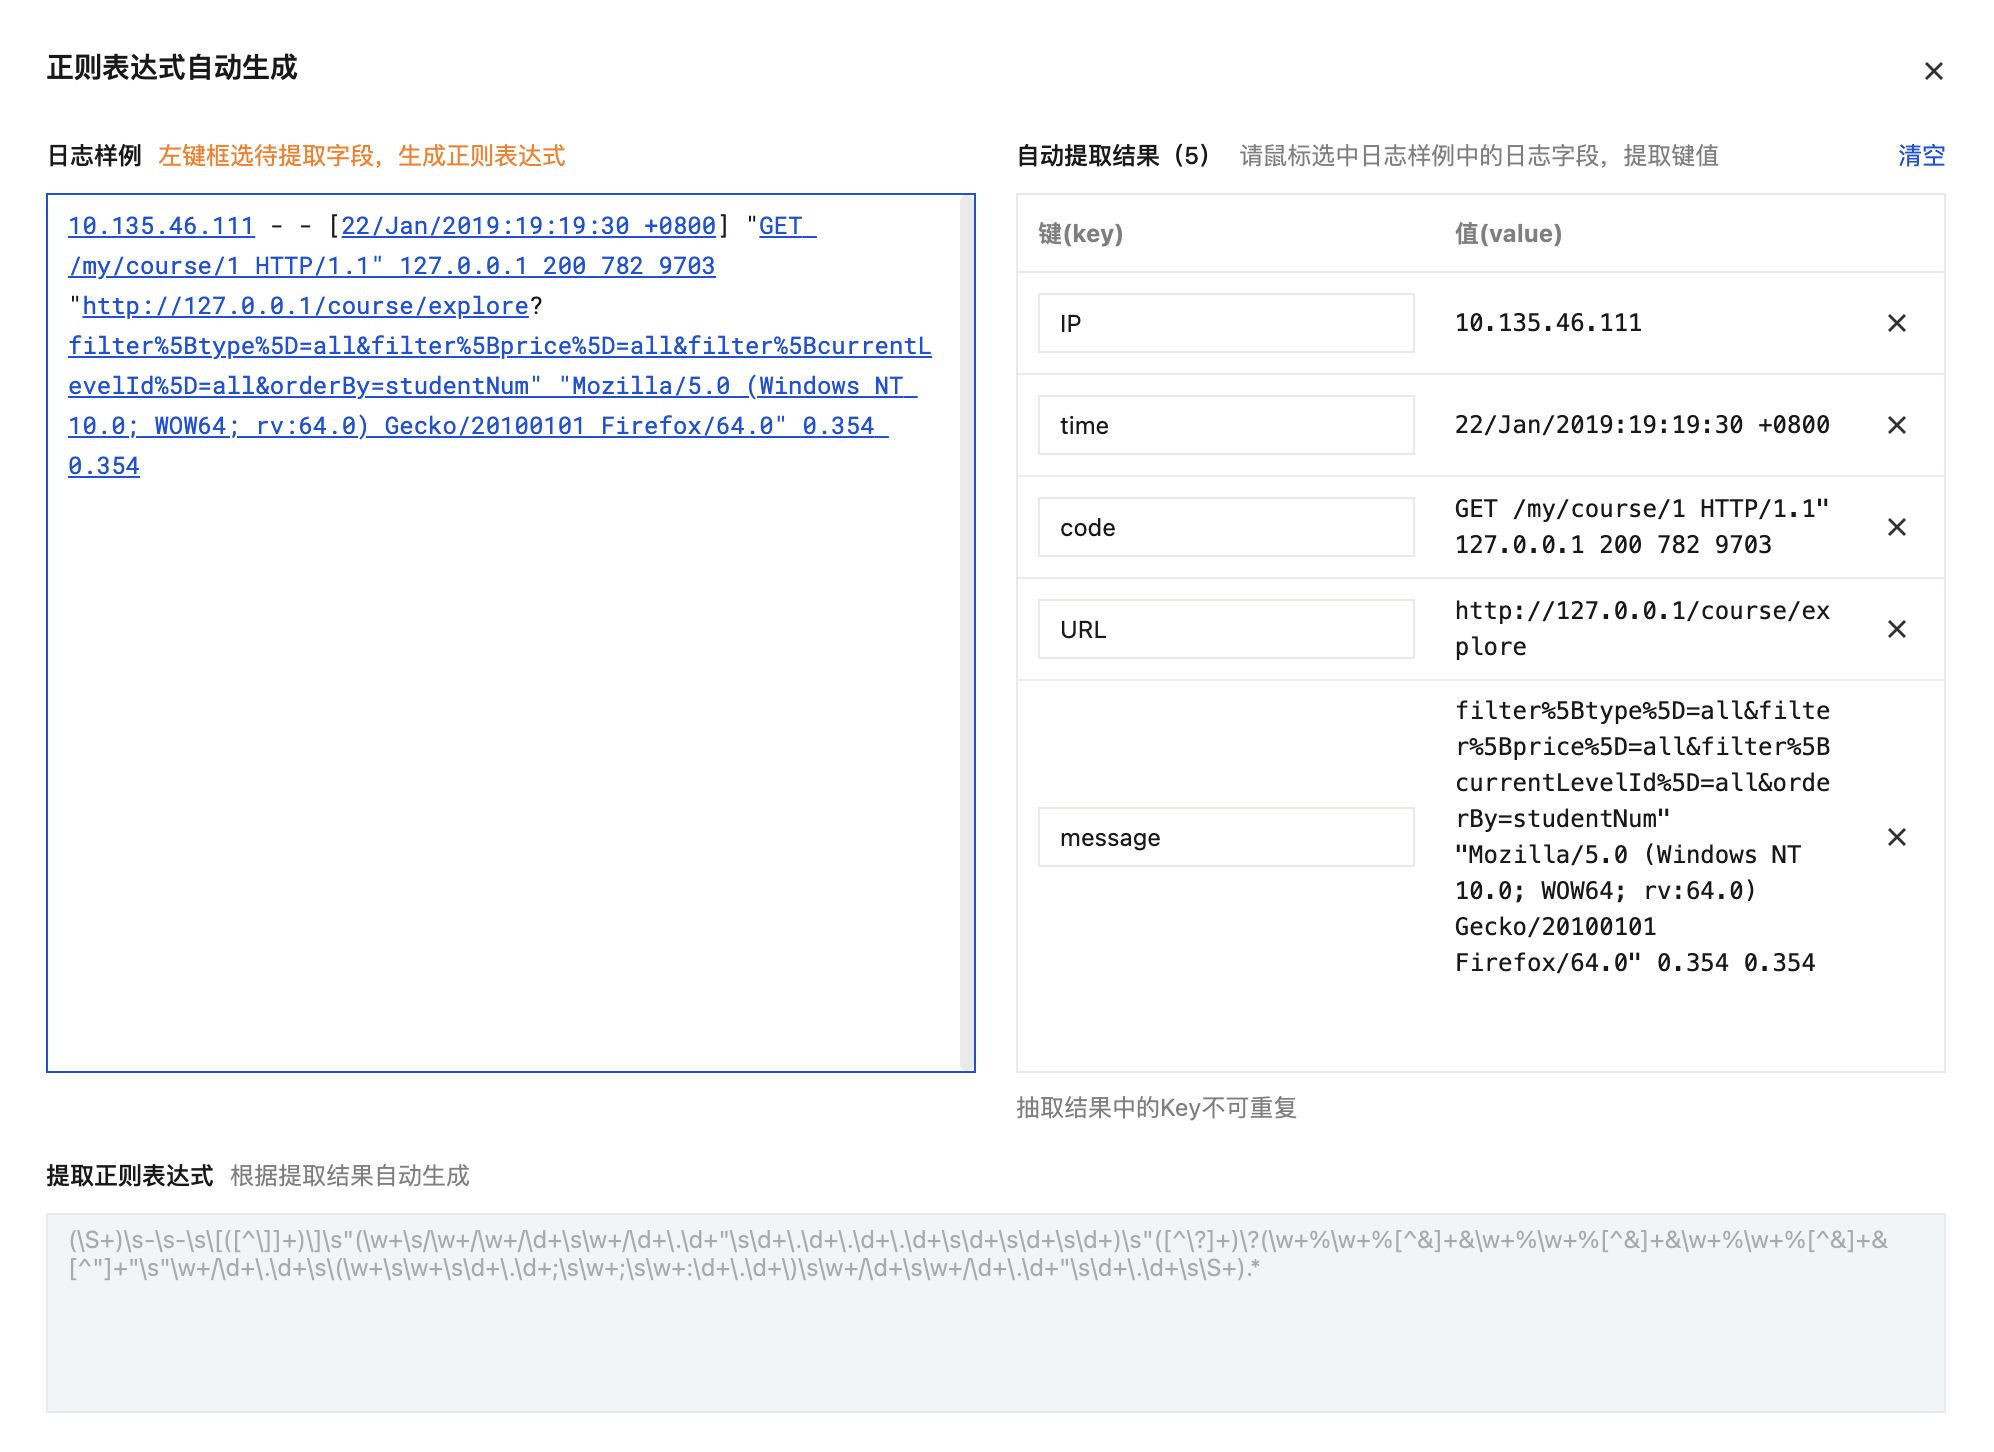
(2) Repeat Step (1) of Auto Mode until all key-value pairs are extracted. As shown below:
(3) Click OK. The system will automatically generate a complete regular expression based on the extracted key-value pairs.
Note:
Regardless of whether you use Manual Mode or Auto Mode, after the definition is completed and verified, the extraction results will be displayed in the "Log Extraction Results" section. If the results do not meet your expectations, you can return to Define Regular Expression to edit it again and re-verify.
You only need to define the key name for each key-value pair, and then you can use that name for log search and analysis.
More Log Verification:
1. When you have multiple complex log sample data, you can set Match More Logs to
to verify the pass rate of your regular expression sample.
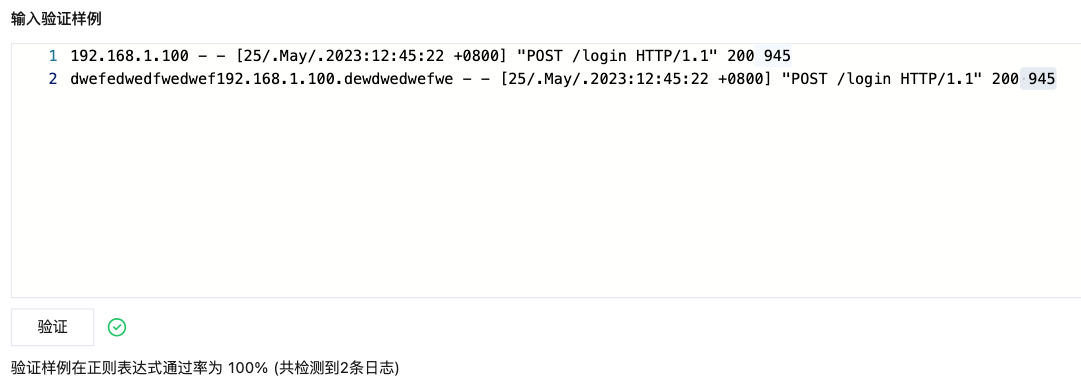
2. Enter the log samples to be verified, separating multiple data entries with line breaks. Click Verify, and the system will verify the sample pass rate. When
appears, it indicates that the verification has passed, as shown below:
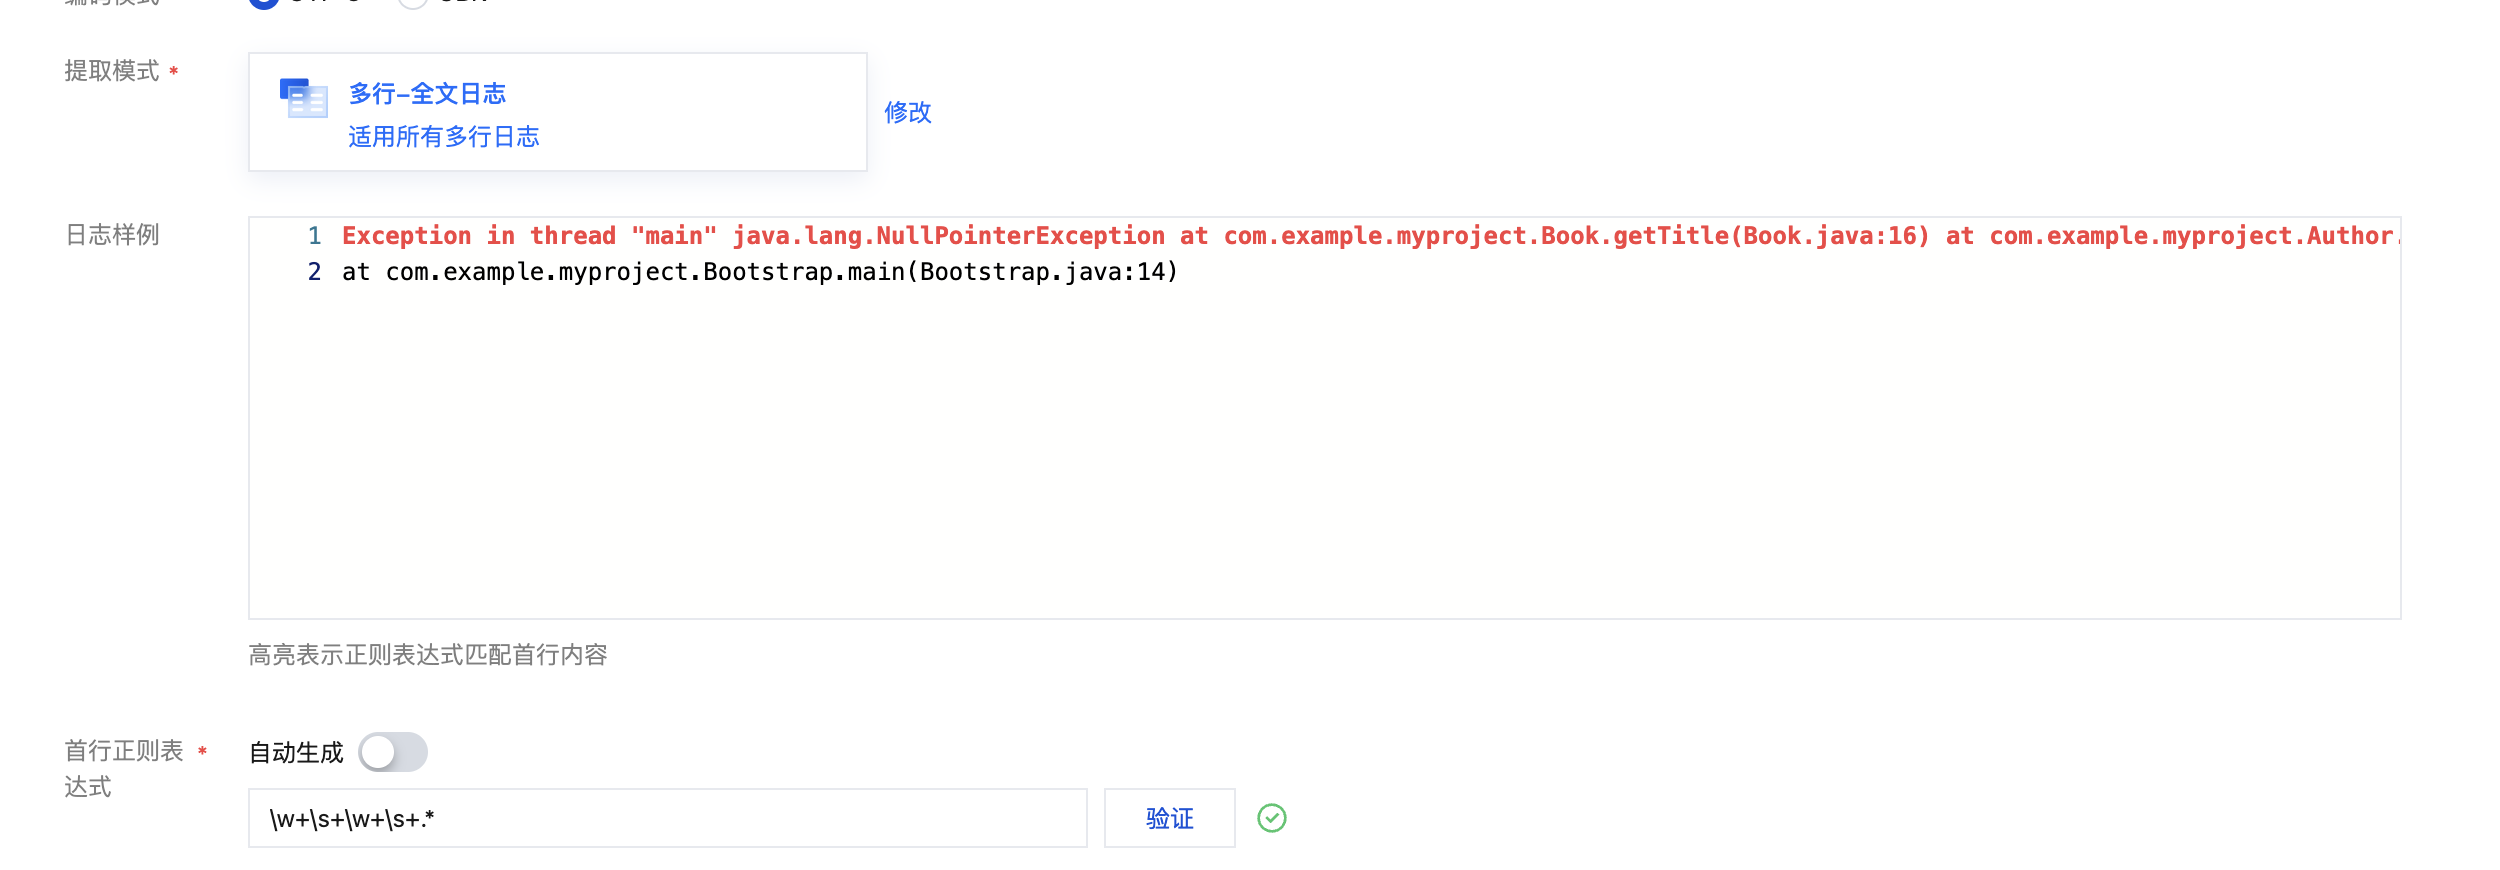
Multi-line full-text logs refer to complete log entries that may span multiple lines (such as Java stack traces). In such cases, to enable the logging system to clearly distinguish between log entries, a first-line regular expression matching method is adopted. When a log line matches the predefined regular expression, it is identified as the start of a log entry, and the appearance of the next matching first line serves as the end marker for that log entry.
A multi-line full-text log will also have a default key-value pair __CONTENT__. However, the log data itself will not be processed in a structured manner, nor will log fields be extracted. The time attribute of a log is determined by the time when the log is collected.
__CONTENT__:2019-12-15 17:13:06,043 [main] ERROR com.test.logging.FooFactory:\\njava.lang.NullPointerException\\n at com.test.logging.FooFactory.createFoo(FooFactory.java:15)\\n at com.test.logging.FooFactoryTest.test(FooFactoryTest.java:11)
Configure Multi-Line Full-Text Format:
1. On the "Collection Configuration" page, set the "Extraction Pattern" to Multiple lines - full-text log. As shown below:
2. Define the regular expression according to the following rules.
3. You can define the first-line regular expression using either the Auto-Generate or Manual Input method. The system will then verify the regular expression based on the sample content.
Auto-Generate: Enter a log sample in the text box and click Auto-Generate. The system will automatically generate a first-line regular expression in the grayed-out text box.
Enter Manually: Enter a log sample in the text box, enter the first-line regular expression, and click Verify. The system will check whether the expression passes verification.
Configure Upload of Parsing-Failure Logs:
It is recommended to enable the upload of logs that failed to be parsed. After this feature is enabled, LogListener will upload various logs that failed to be parsed. If this feature is disabled, the logs that failed to be parsed will be discarded.
After this feature is enabled, you need to configure the key value for parsing failures (which is LogParseFailure by default). All logs that failed to be parsed are uploaded with the input content as the key name (Key) and the raw log content as the key value (Value).
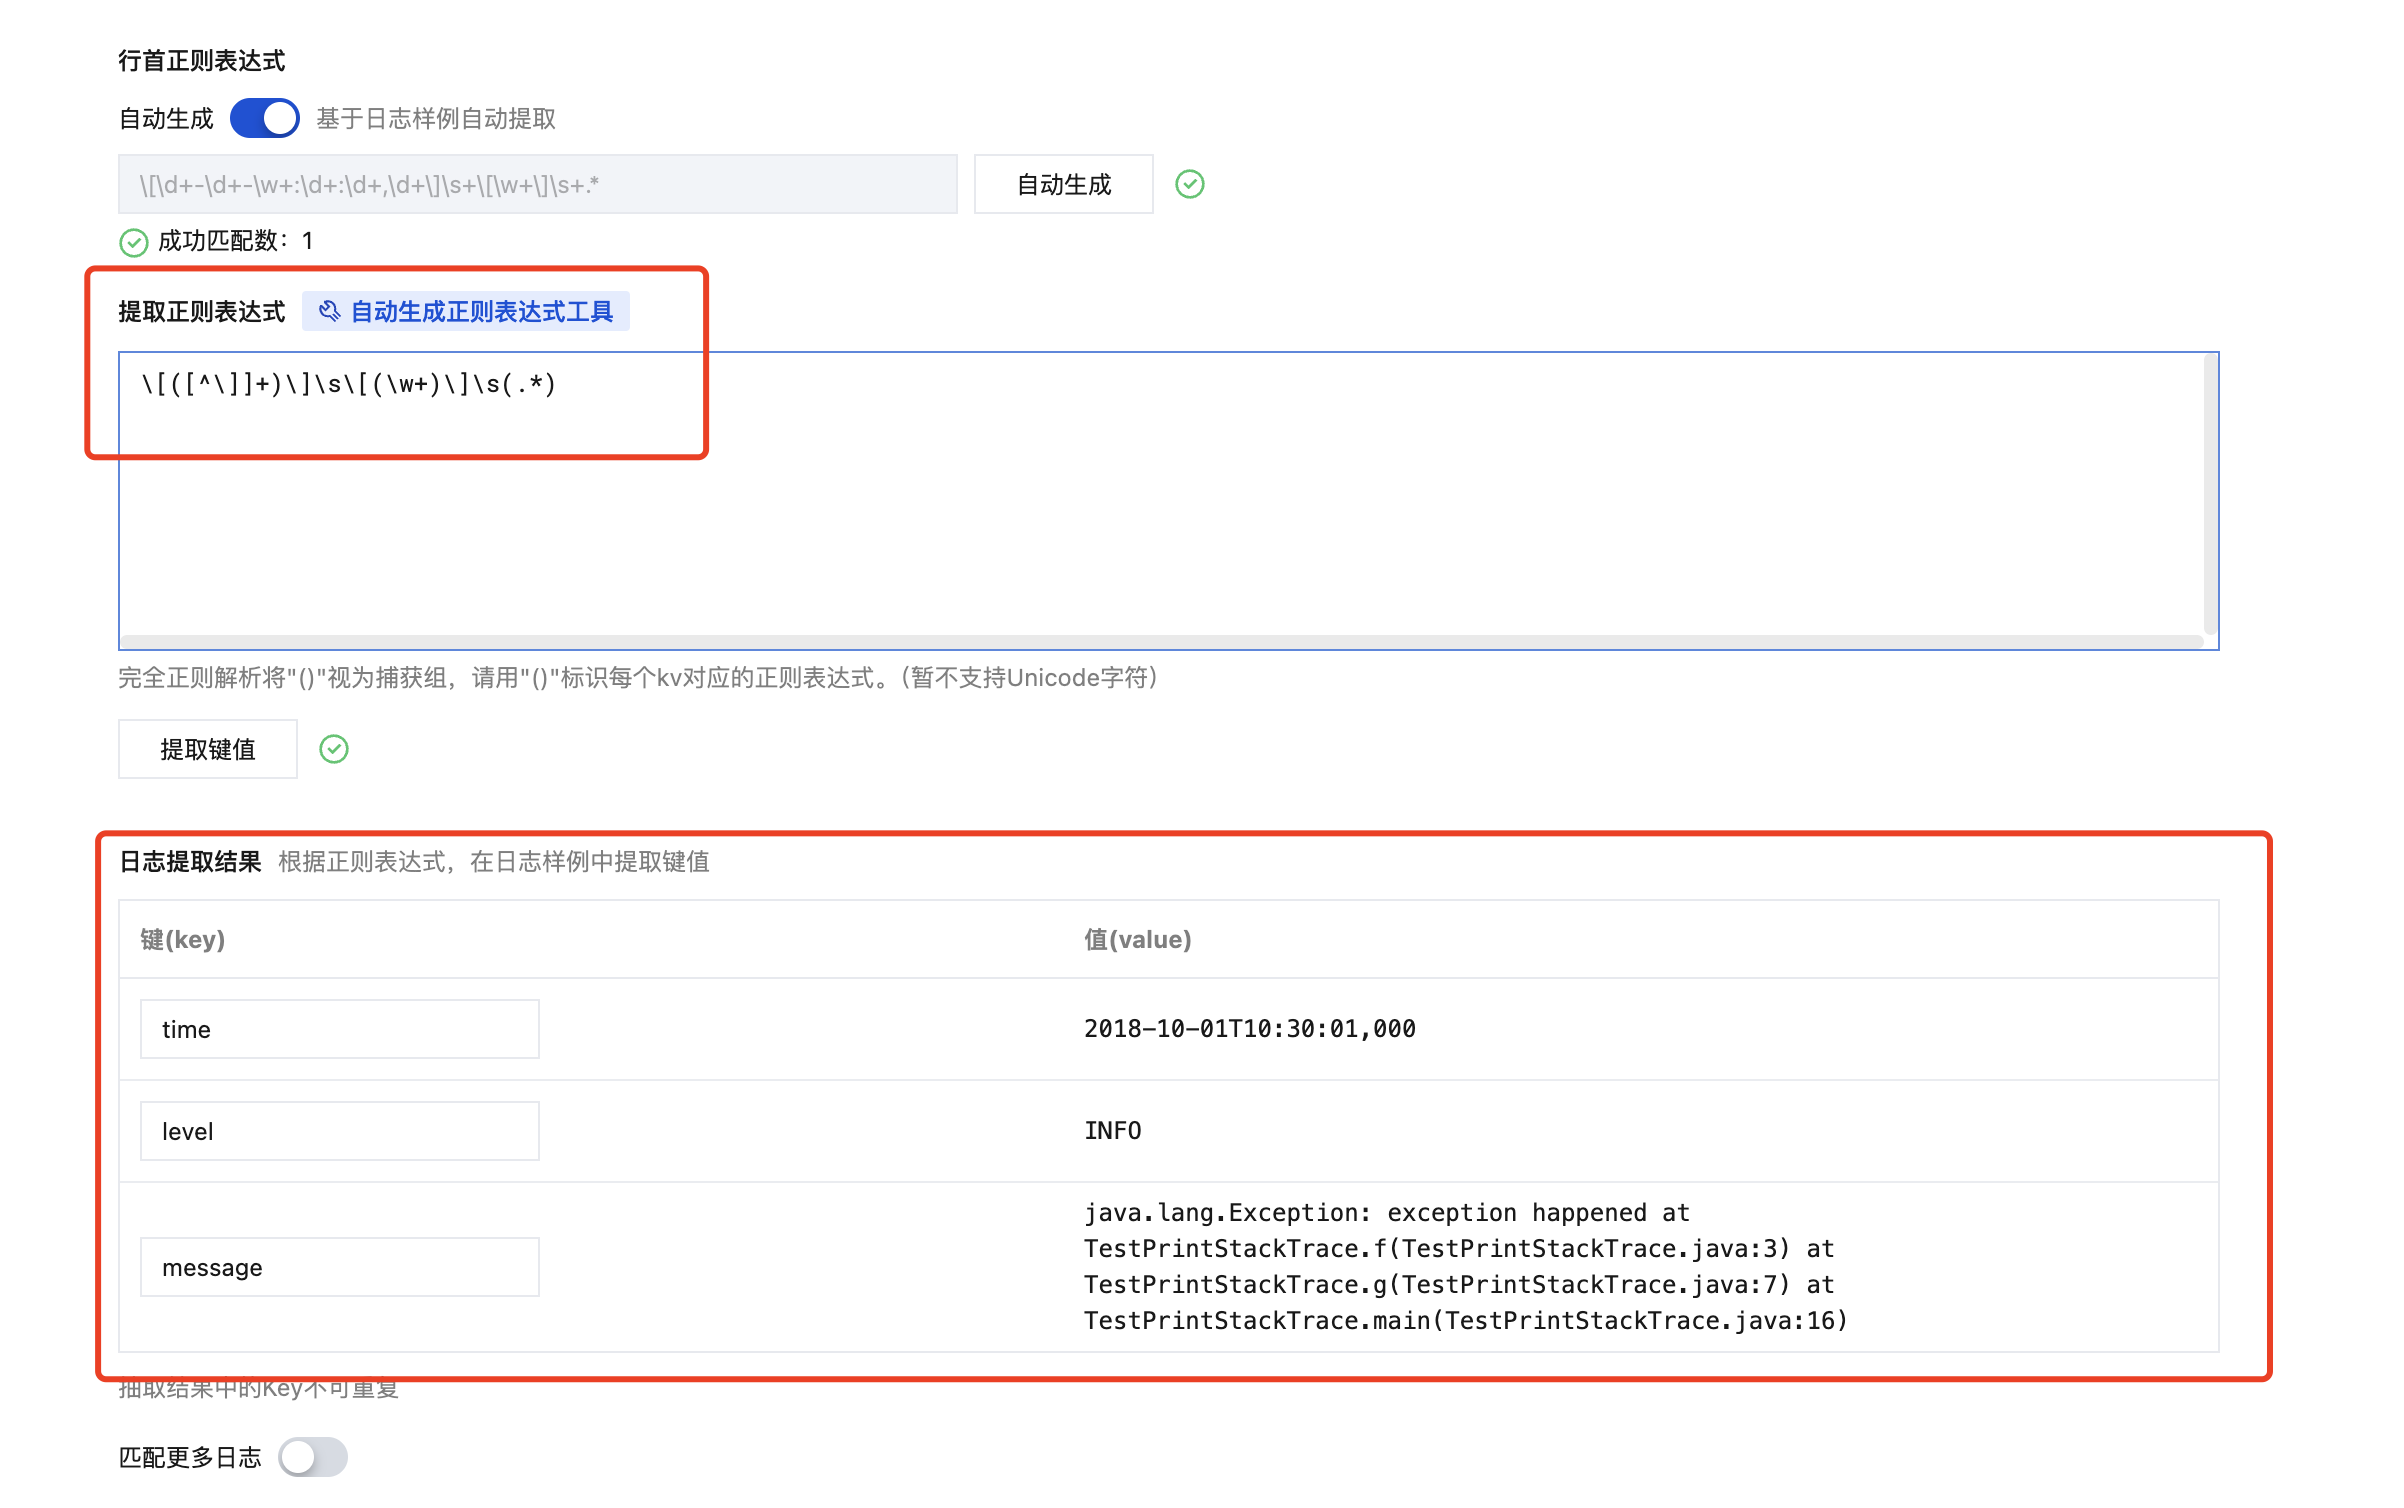
After the system extracts the corresponding key-value pair based on the () capture group, you can customize the key name of each group as follows:
time: 2018-10-01T10:30:01,000`
level: INFO`
msg:java.lang.Exception: exception happened
at TestPrintStackTrace.f(TestPrintStackTrace.java:3)
at TestPrintStackTrace.g(TestPrintStackTrace.java:7)
at TestPrintStackTrace.main(TestPrintStackTrace.java:16)
Multi-Line Full Regular Expression Mode
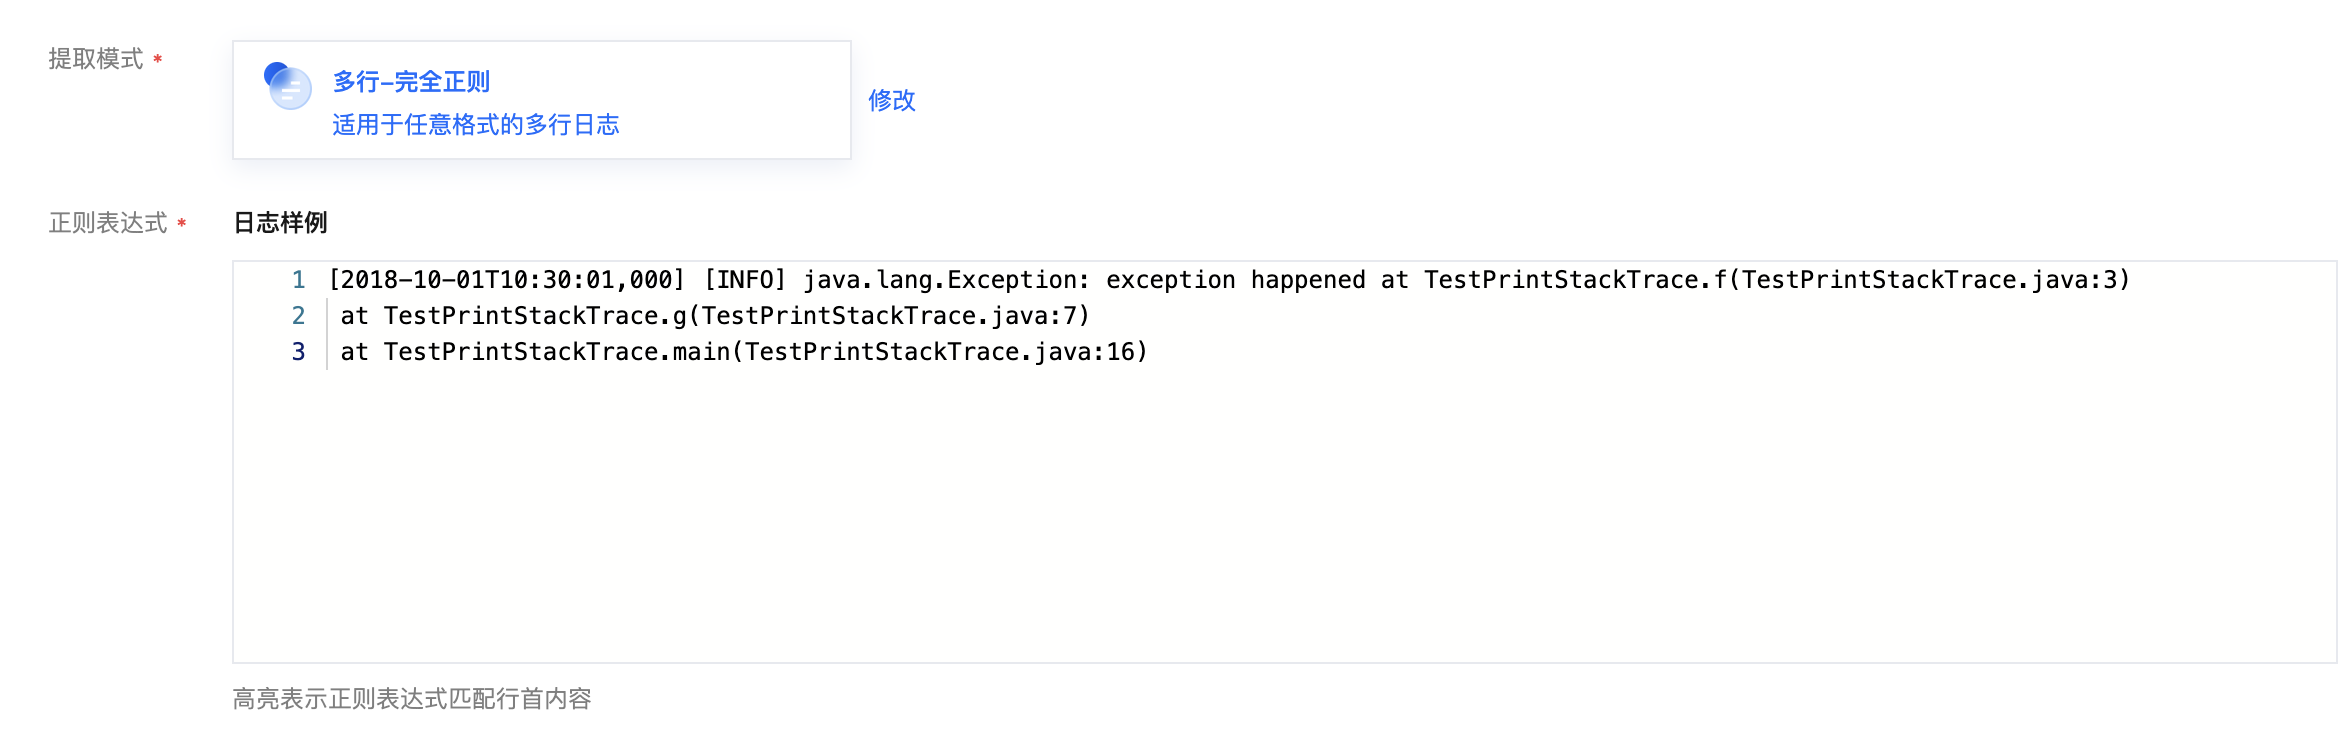
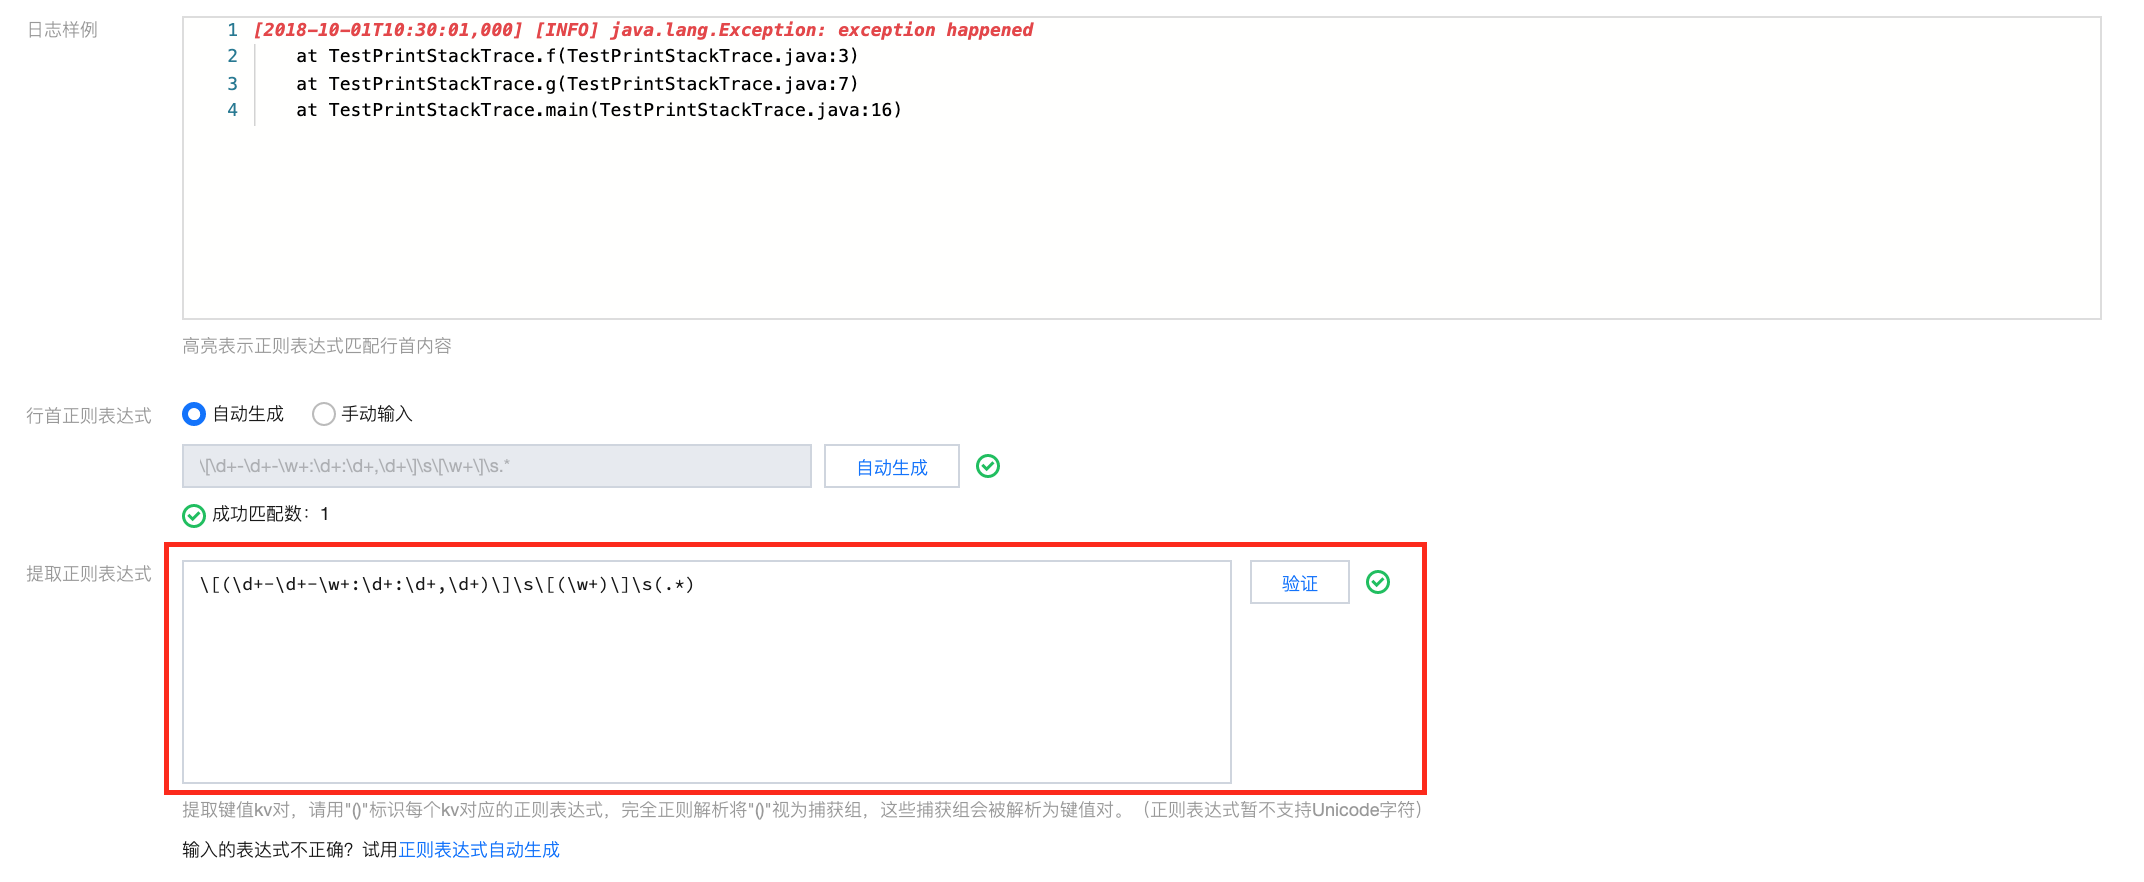
1. On the collection configuration page, set "Extraction mode" to Multi-line Full regular expression, and enter a log sample in the "Log example" textbox. As shown below:
2. Define the first-line regular expression according to the following rules:
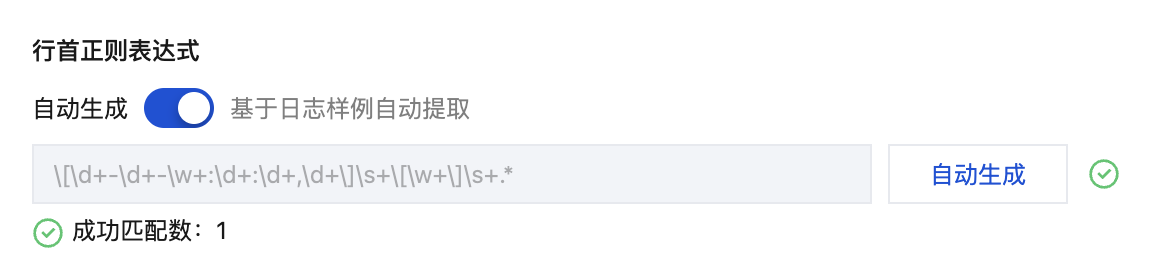
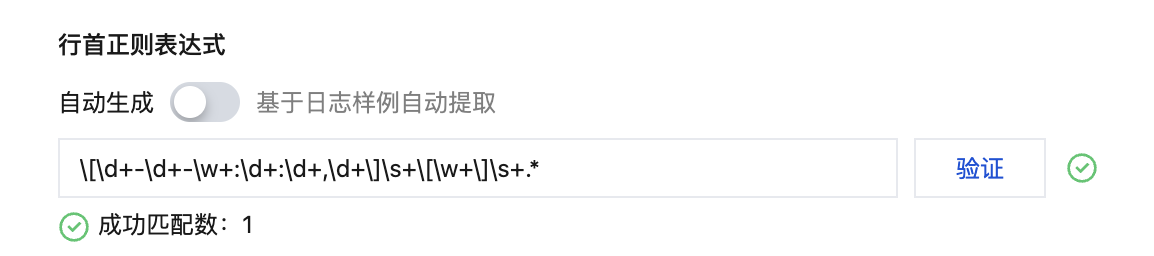
3. You can choose whether to enable the Auto-Generate method to define first-line regular expression (disable it to manually enter), and determine cross-line log boundary. After the expression is verified successfully, the system will determine the number of logs that match the first-line regular expression.
Auto generate: Turn on Auto-Generate, and the system automatically generates the first-line regular expression in the grayed-out text box. As shown below:
Enter manually: In the text box, manually enter the first-line regular expression, click Verify, and the system will determine whether the expression passes verification. As shown below:
Extract Regular Expression
The system provides two modes to define regular expressions: manual mode and auto mode. You can either manually enter the expression to extract key-value pairs for verification, or click Auto-Generate Regular Expression to switch to automatic mode. The system will extract key-value pairs based on the selected mode and the defined regular expression for verification.
Multi-line - Full regex
Manual Mode
1. Enter the regular expression in the Extract Regular Expression text box.
2. Click Verify and the system will determine whether the log sample matches the regular expression.
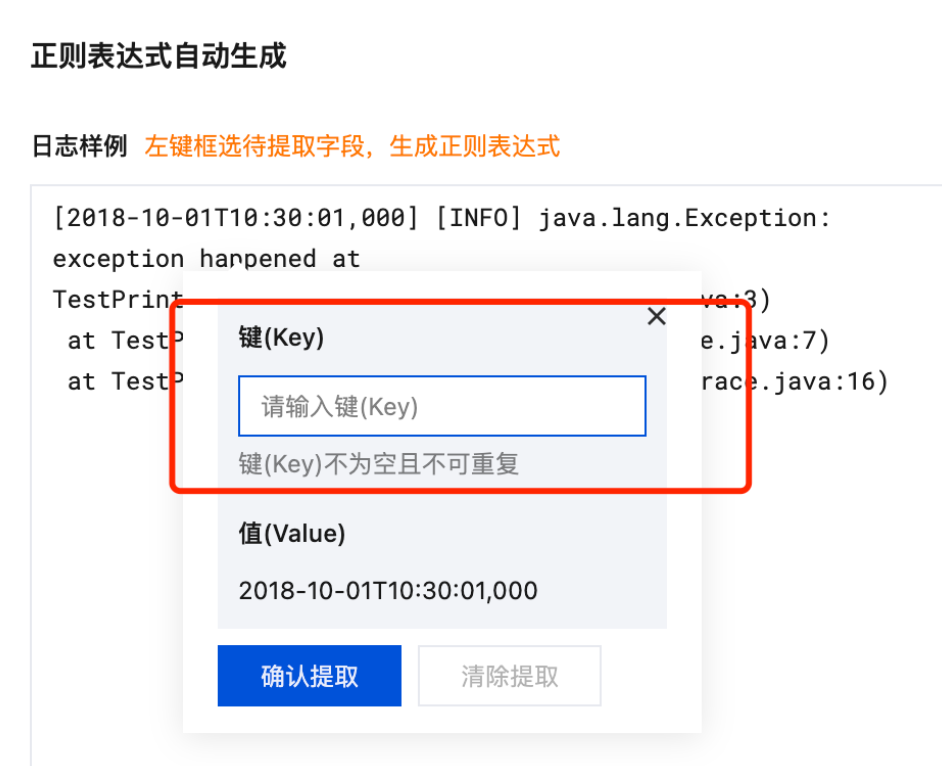
1. In the pop-up "
Regular Expression Auto-Generation
" modal view, based on your actual search and analysis needs, select the log content from which you need to extract key-value pairs. Then, in the pop-up text box, enter the key name and click Confirm Extraction. As shown below:
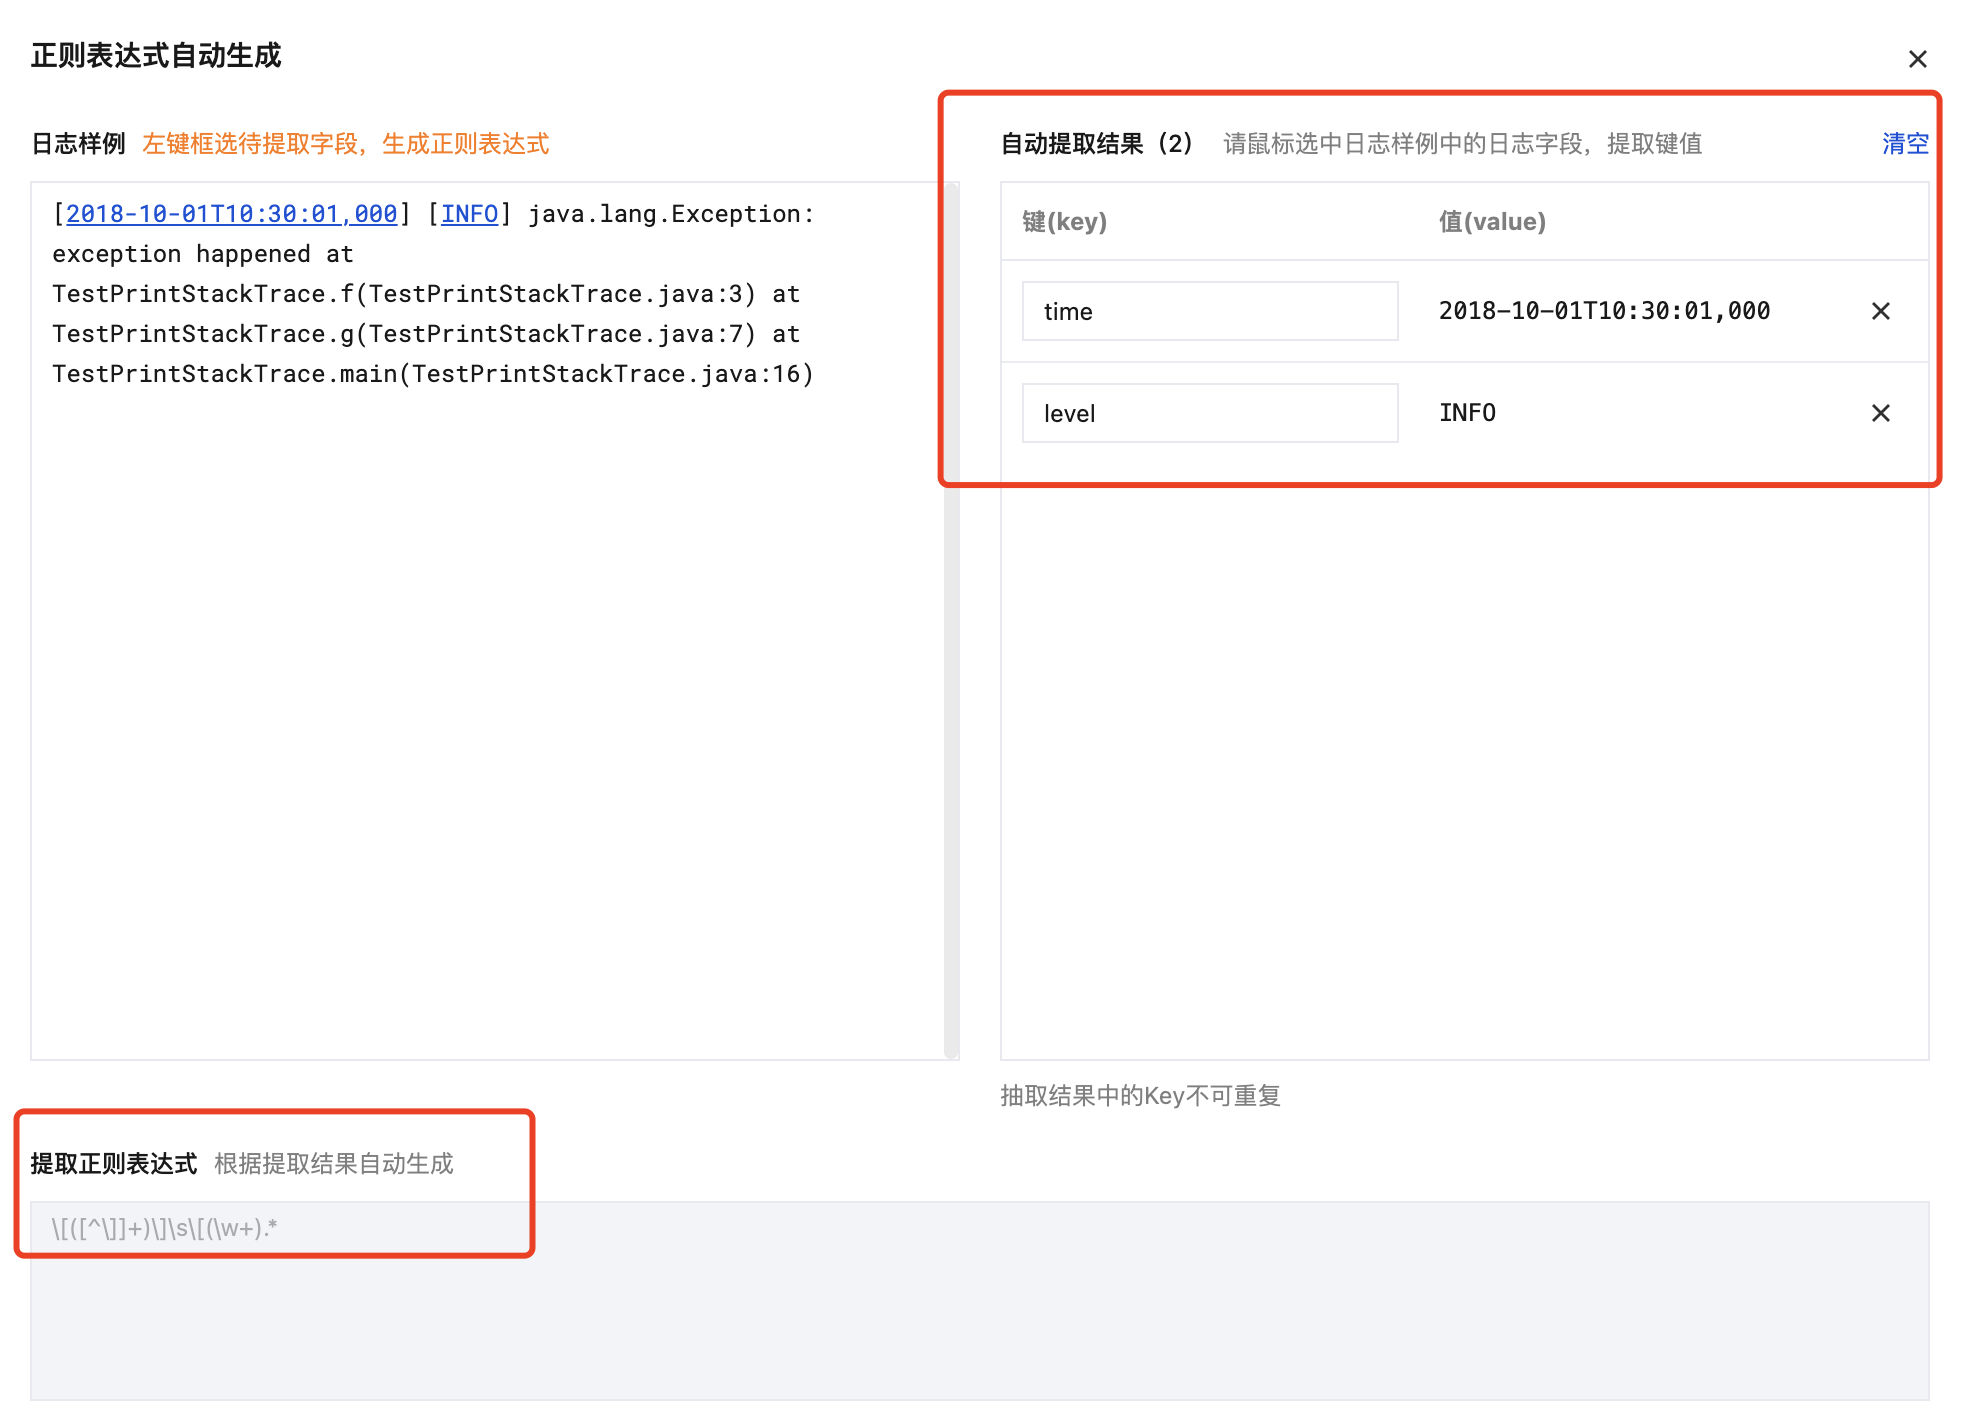
2. The system will automatically generate a regular expression for this part of the content, and the automatic extraction result will appear in the key-value table. As shown below:
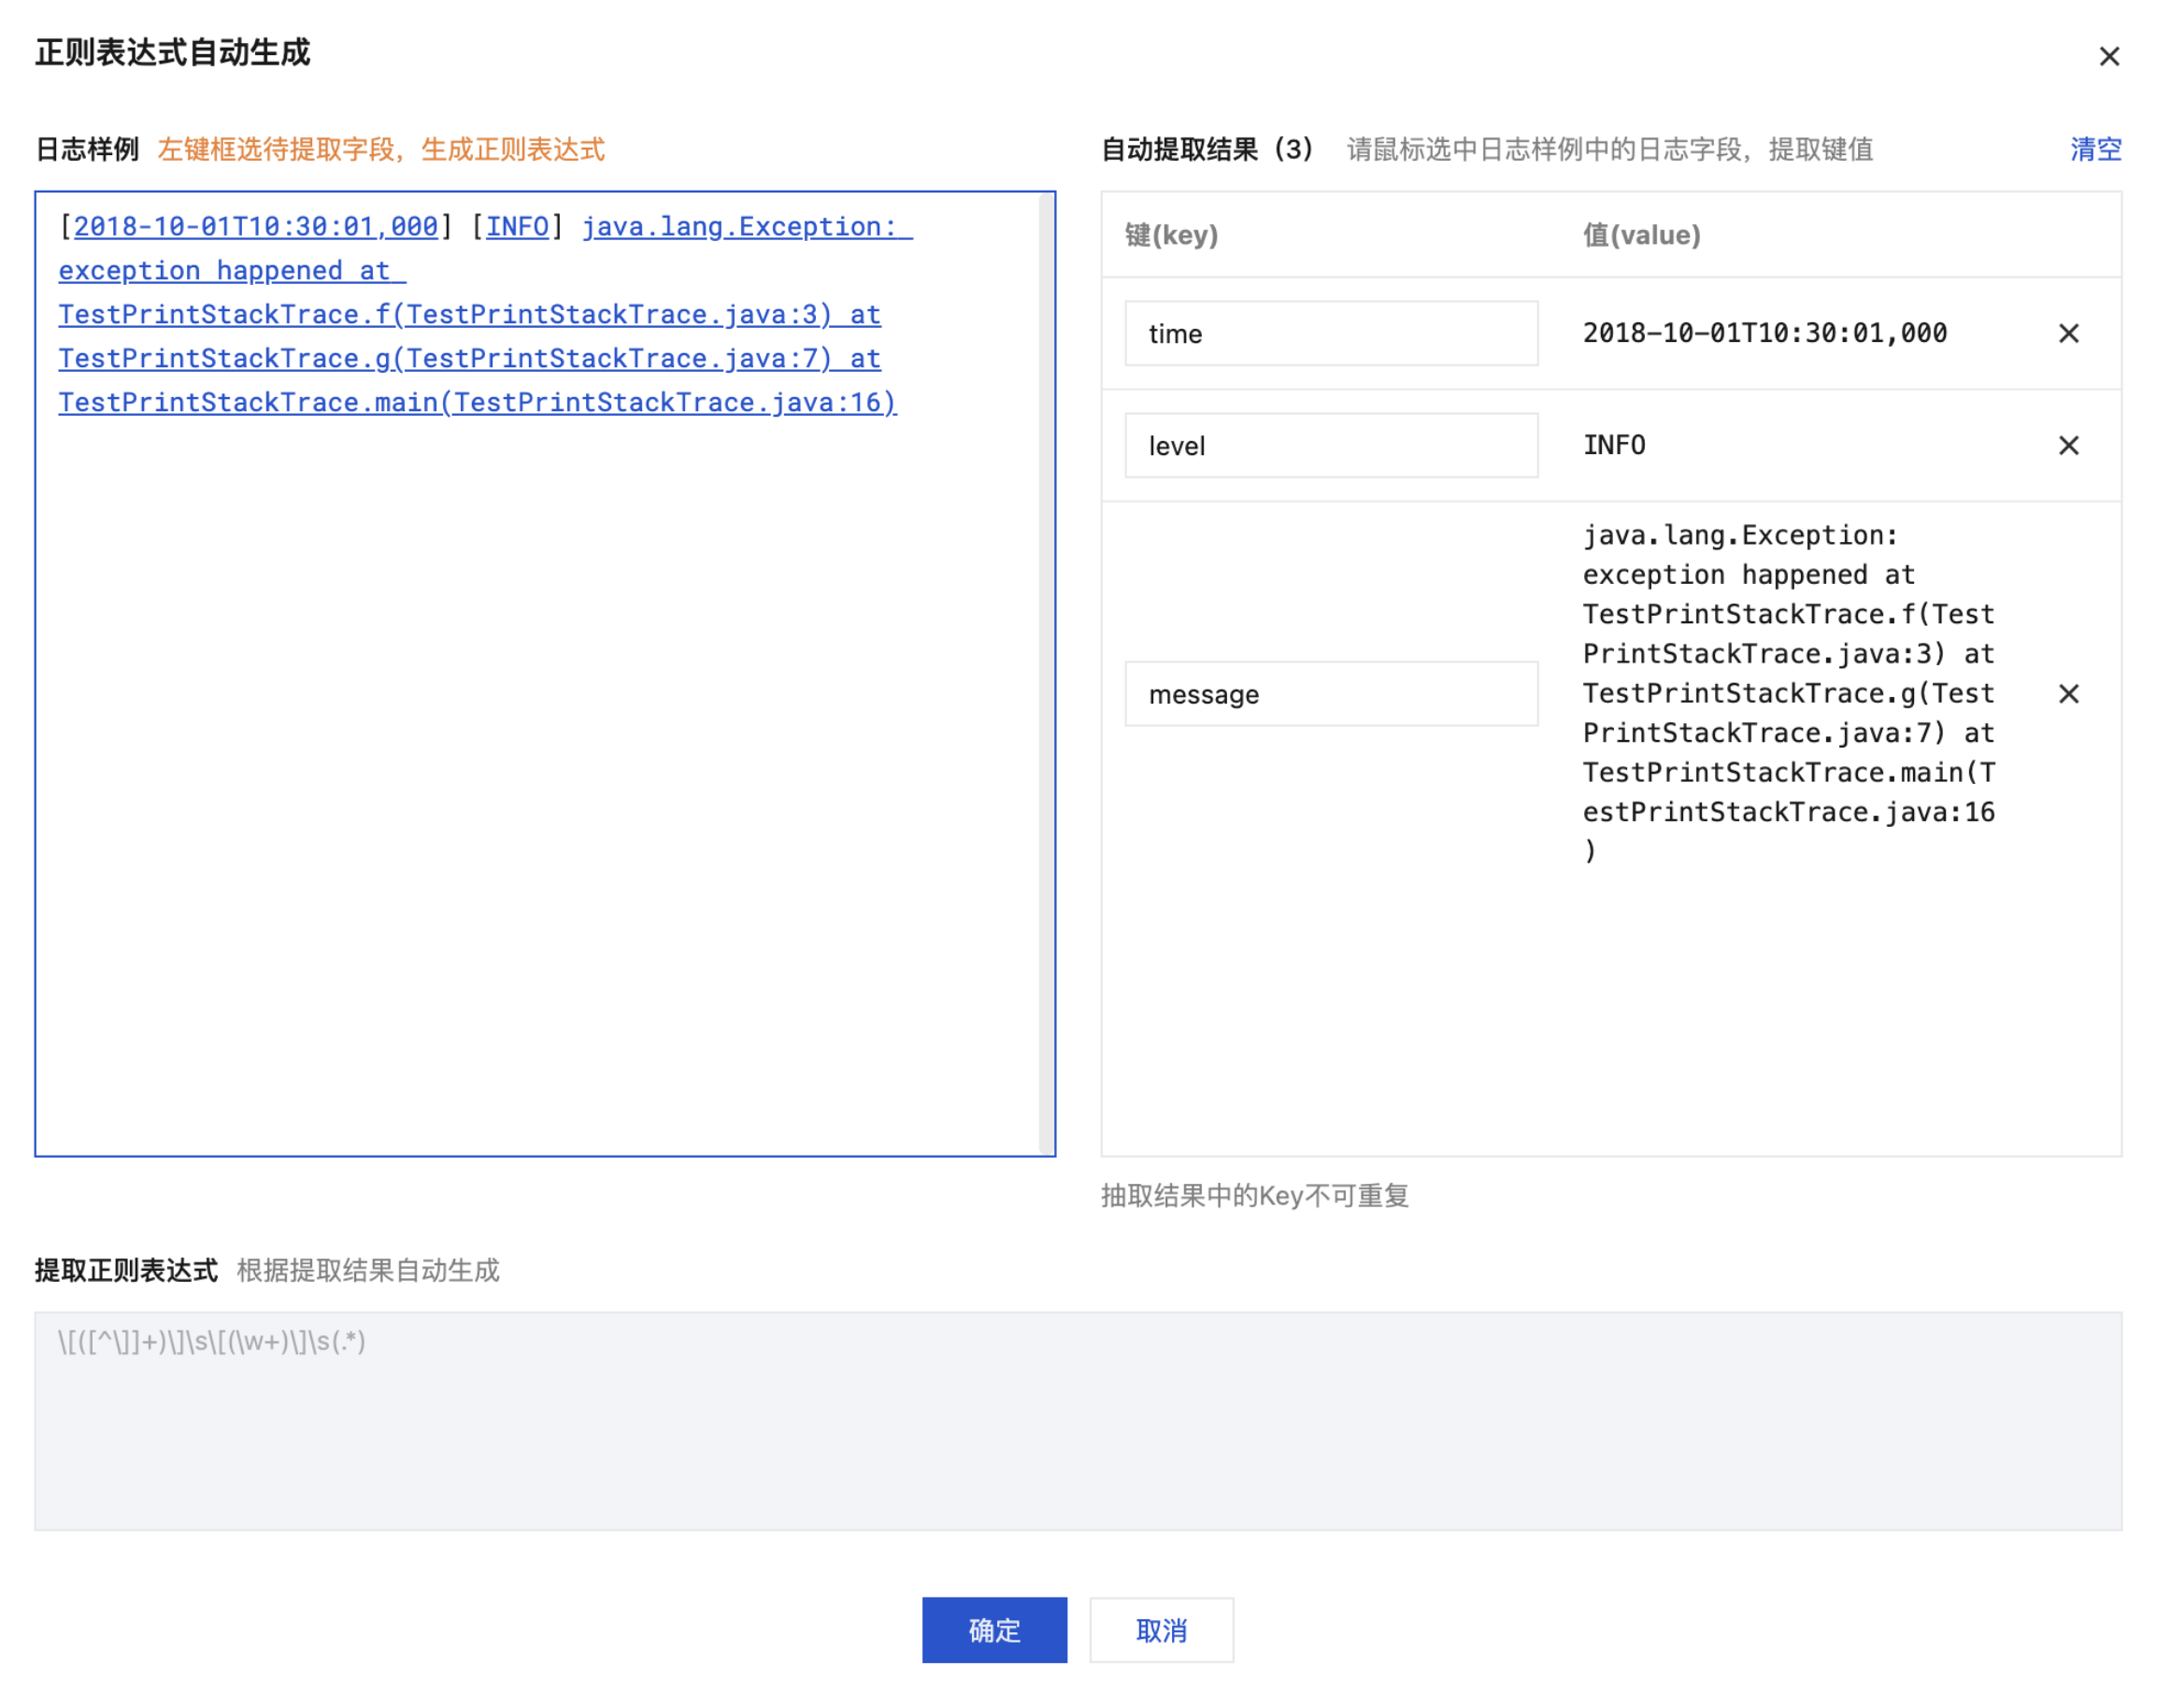
3. Repeat Step 1 of Auto Mode until all key-value pairs are extracted. As shown below:
4. Click OK. The system will automatically generate a complete regular expression based on the extracted key-value pairs. As shown below:
Note:
Whether you choose automatic mode or manual mode, after the regular expression extraction mode is defined and verified, the extraction results will be displayed in the Extraction Results section. You only need to define the key name for each key-value pair, which can then be used for log search and analysis.
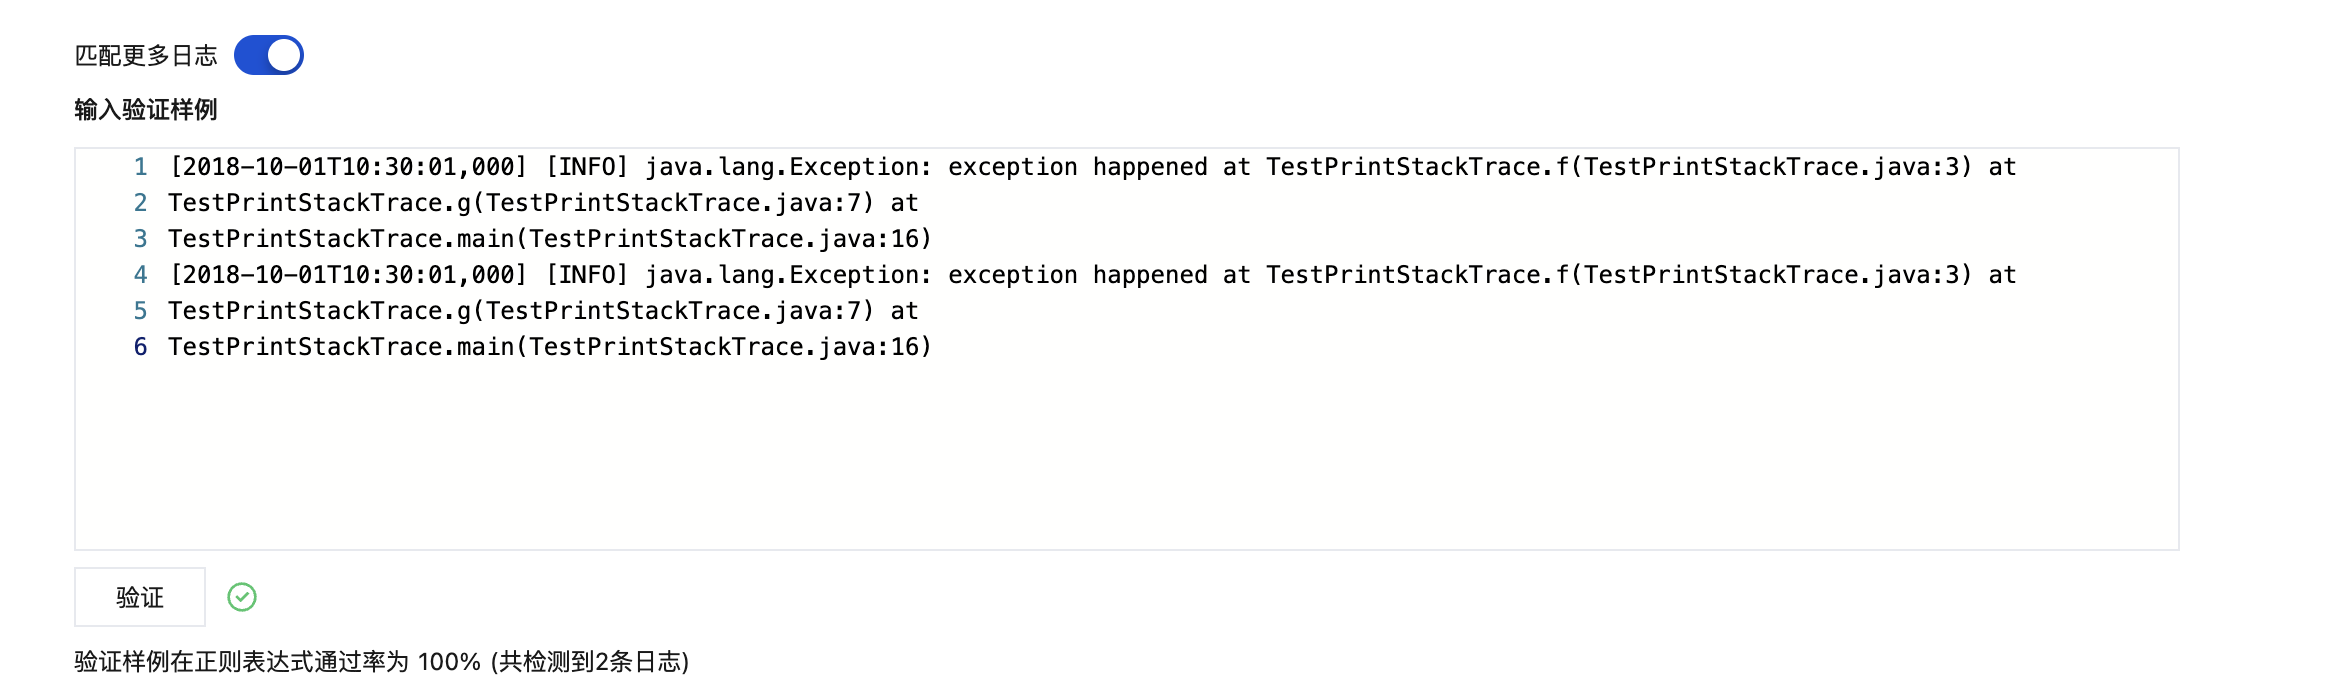
Match More Logs:
1. When your log data is complex, you can set Match More Logs to
to verify the pass rate of your regular expression sample.
2. Enter multiple log samples to be verified and click Verify. The system will then verify the sample pass rate. When
appears, it indicates that the verification has passed, as shown below:
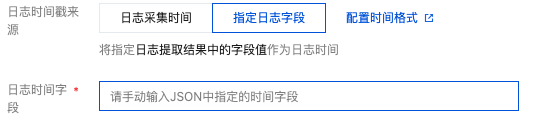
Configure Log Timestamp Source:
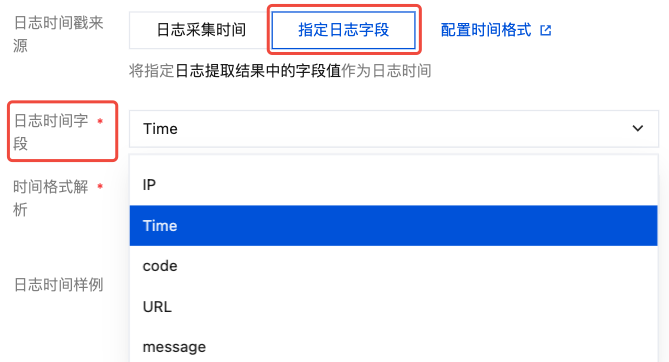
You can choose either log collection time or a specified log field as the timestamp for the logs:
Log Collection Time
Specifying Log Fields
Use the log collection time as the log timestamp.
Use the value from a specified field in the log as the log timestamp.
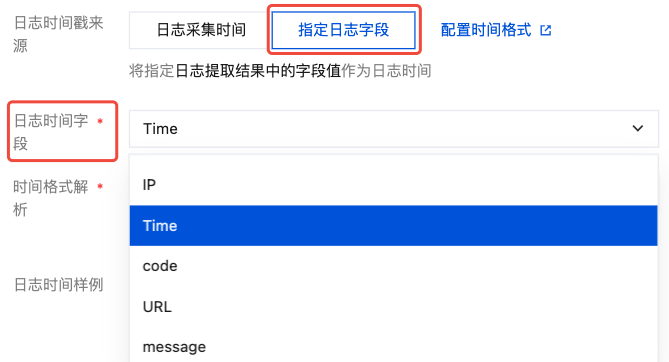
Select the extracted Value from the Log Time Gield as the log time.
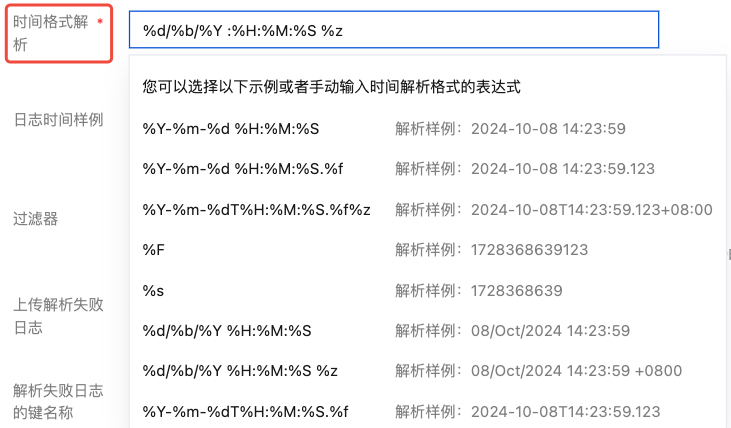
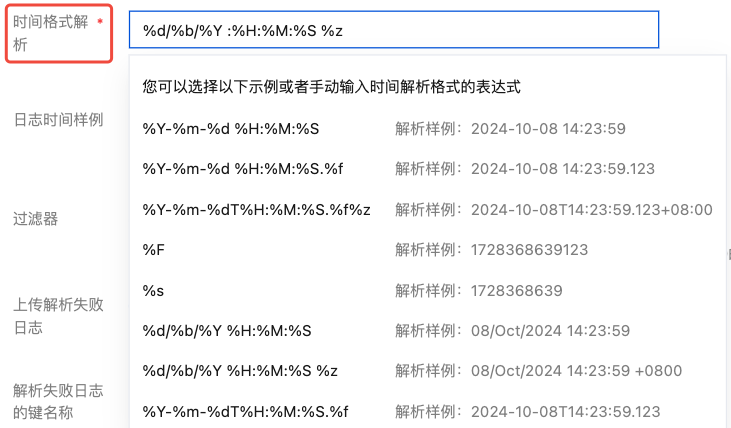
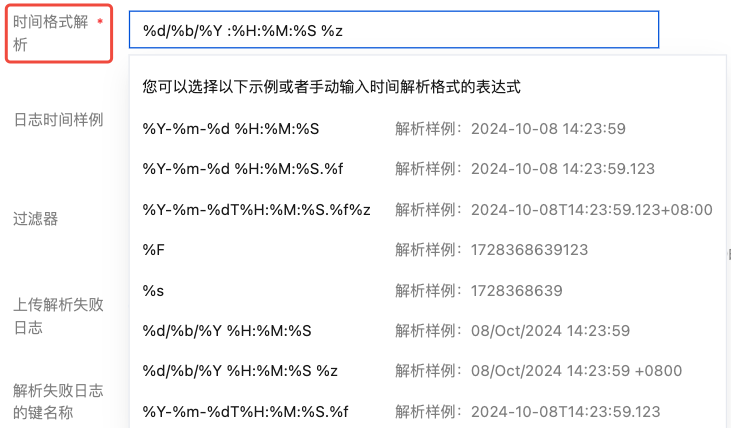
In Time Parsing Format, manually enter or select the corresponding parsing expression. For example: the value representing time in logs is 07/Jul/2025:19:19:30 +0800, and the parsing format is %d/%b/%Y:%H:%M:%S %z. For more information, please refer to configure time format.
Click Verify.
Note:
If the time format is entered incorrectly, the log timestamp will be based on the collection time.
Configure Upload of Parsing-Failure Logs:
It is recommended to enable the upload of logs that failed to be parsed. After this feature is enabled, LogListener will upload various logs that failed to be parsed. If this feature is disabled, the logs that failed to be parsed will be discarded.
After this feature is enabled, you need to configure the key value for parsing failures (which is LogParseFailure by default). All logs that failed to be parsed are uploaded with the input content as the key name (Key) and the raw log content as the key value (Value).
agent: Mozilla/5.0 (Windows NT 10.0; WOW64; rv:64.0) Gecko/20100101 Firefox/64.0
body_sent: 23
http_host: 127.0.0.1
method: POST
referer: http://127.0.0.1/my/course/4
remote_ip: 10.135.46.111
request: POST /event/dispatch HTTP/1.1
response_code: 200
responsetime: 0.232
time_local: 22/Jan/2019:19:19:34 +0800
upstreamhost: unix:/tmp/php-cgi.sock
upstreamtime: 0.232
url: /event/dispatch
xff: -
Configure Log Timestamp Source:
Log Collection Time
Specifying Log Fields
Use the log collection time as the log timestamp.
Use the value from a specified field in the log as the log timestamp.
In the Log Time field, manually enter the time field specified in the JSON as the log timestamp.
In Time Parsing Format, manually enter or select the corresponding parsing expression. For example: the value representing time in logs is 07/Jul/2025:19:19:30 +0800, and the parsing format is %d/%b/%Y:%H:%M:%S %z. For more information, please refer to configure time format.
Click Verify.
Note:
If the time format is entered incorrectly, the log timestamp will be based on the collection time.
Configure Upload of Parsing-Failure Logs:
It is recommended to enable the upload of logs that failed to be parsed. After this feature is enabled, LogListener will upload various logs that failed to be parsed. If this feature is disabled, the logs that failed to be parsed will be discarded.
After this feature is enabled, you need to configure the key value for parsing failures (which is LogParseFailure by default). All logs that failed to be parsed are uploaded with the input content as the key name (Key) and the raw log content as the key value (Value).
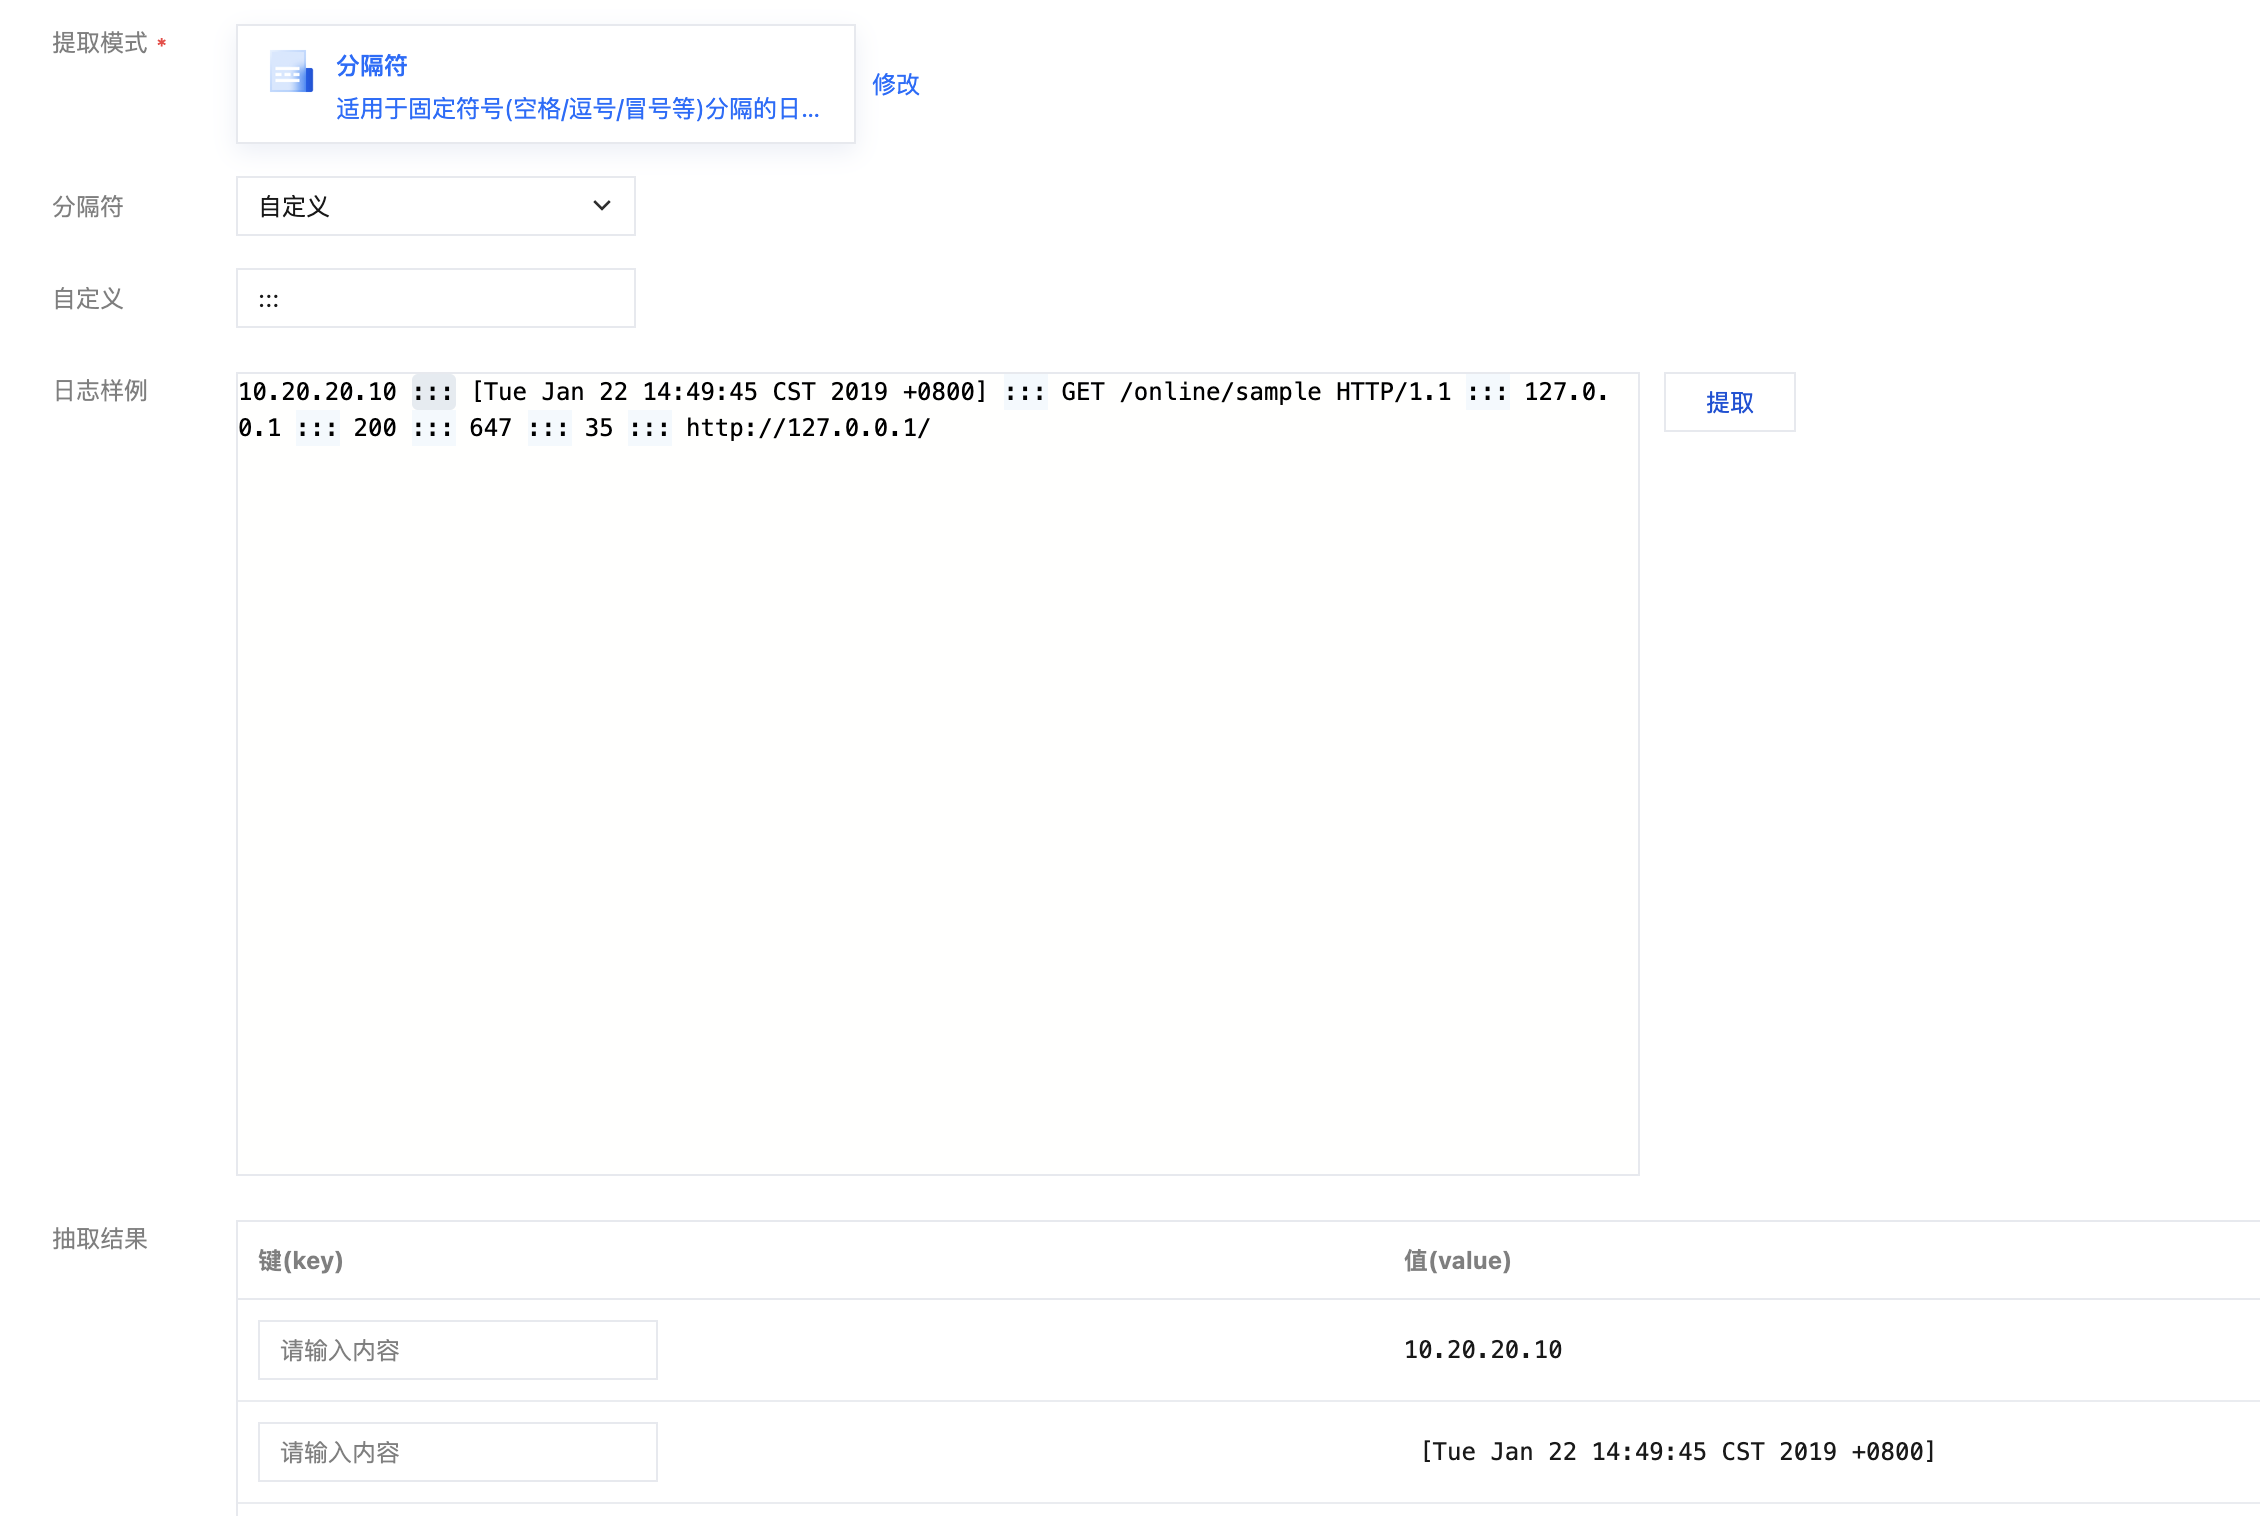
When the delimiter for log parsing is specified as :::, this log will be divided into eight fields, and each of these fields will be assigned a unique key, as shown below:
IP: 10.20.20.10 -
bytes: 35
host: 127.0.0.1
length: 647
referer: http://127.0.0.1/
request: GET /online/sample HTTP/1.1
status: 200
time: [Tue Jan 22 14:49:45 CST 2019 +0800]
Configure Delimiter Mode:
1. Set Extraction Mode to Delimiter.
2. Select Delimiter and enter a log sample in the Log Sample text box, and then click Extract.
The system splits the log sample according to the determined delimiter and displays it in the extraction result panel. Define a unique key for each field. Currently, log collection supports multiple delimiters; common delimiters include: space, tab, comma, semicolon, and vertical bar. If the delimiter used in your log data is another symbol, such as :::, you can also parse it through a custom delimiter.
Configure Log Timestamp Source:
Log Collection Time
Specifying Log Fields
Use the log collection time as the log timestamp.
Use the value from a specified field in the log as the log timestamp.
Select the extracted Value from the Log Time Gield as the log time.
In Time Parsing Format, manually enter or select the corresponding parsing expression. For example: the value representing time in logs is 07/Jul/2025:19:19:30 +0800, and the parsing format is %d/%b/%Y:%H:%M:%S %z. For more information, please refer to configure time format.
Click Verify.
Note:
If the time format is entered incorrectly, the log timestamp will be based on the collection time.
Configure Upload of Parsing-Failure Logs:
It is recommended to enable the upload of logs that failed to be parsed. After this feature is enabled, LogListener will upload various logs that failed to be parsed. If this feature is disabled, the logs that failed to be parsed will be discarded.
After this feature is enabled, you need to configure the key value for parsing failures (which is LogParseFailure by default). All logs that failed to be parsed are uploaded with the input content as the key name (Key) and the raw log content as the key value (Value).
Filter:
Filters help you add log collection filtering rules according to business requirements, to screen out valuable log data. Filtering rules are Perl regular expressions. The created rules are inclusion rules, meaning only logs matching the regular expression will be collected and reported.
For separator-formatted logs, you need to configure a filter rule according to the defined custom key-value pair. For example, if you want to collect all log data with a
Metadata: includes two types: bucket (bucket name) and object (full object path). Selected metadata will be imported with logs in the format __TAG__.{metadata}:xxx. For example: __TAG__.object: csv/object.gz.
If you need to further process the collected CLS logs, such as structuring, masking, or filtering, before writing them into the log topic, you can click Data Processing at the bottom of the page, add data processing, and then configure the index.
Note:
For data processing-related operations, see the Preprocessing of Data tab in Creating Processing Task.
Data processing will incur fees. For details, see Billing Overview.
2. Click Next.
Step 4. Configure indexes
1. Click Next to go to the index configuration page.
2. On the Index Configuration webpage, configure the following information. For configuration details, please see index configuration.
Note:
Index configuration must be enabled before you can perform searches.
3. Click Submit to go to the Edit Index Configuration confirmation page. Then click OK.
If you want the index configuration you have set to take effect only for newly written logs, click Confirm. If you want this configuration to take effect for historical data, click Confirm, then for details, see Rebuild Index for further settings.
4. The operation is successful. The collection configuration step ends.