Collecting Host Monitoring Metrics
Download
포커스 모드
폰트 크기
This document describes how to collect host-related monitoring metric data (such as CPU, memory, network, disk, and system metrics) to Cloud Log Service (CLS) via LogListener.
Prerequisites
The relevant permissions for host metric collection have been configured. For details, see Access Policy Templates.
A logset and metric topic have been created. For detailed instructions, see Logset and Metric Topic.
Use Limits
LogListener (3.4.2 and later versions) should be installed on the hosts from which metrics need to be collected. If your LogListener version is earlier than 3.4.2, upgrade it first. For detailed operations, see LogListener Upgrade Guide.
Windows versions are not supported.
Operation Steps
Step 1: Selecting a Metric Topic
1. Log in to the CLS console.
2. In the left sidebar, click Metric Topic, select the metric topic to which you want to ship the logs, and click the metric topic name to go to the topic details page. If you have not yet created a metric topic, click Create Metric Topic to create one. For details, see Metric Topic.
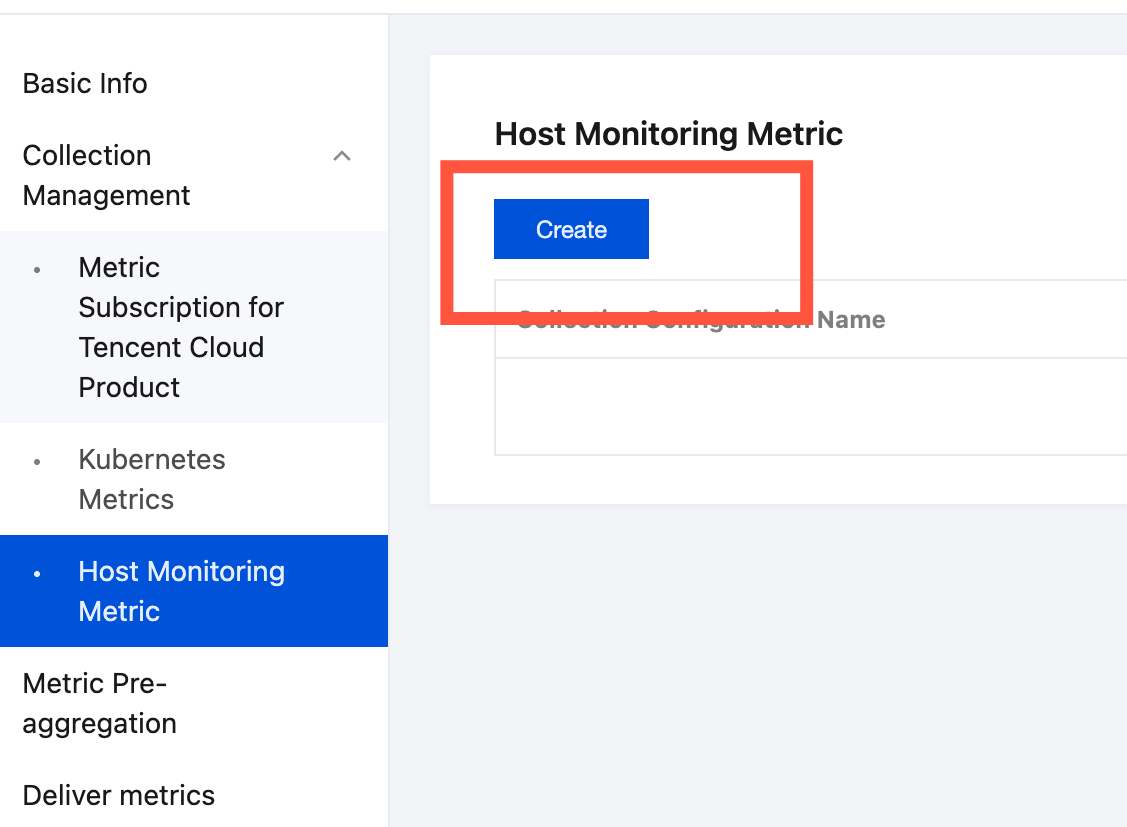
3. On the topic details page, choose Collection Management > Host Monitoring Metrics in the left sidebar, and then click Create on the management page on the right to enter the host monitoring metric configuration process.
Step 2: Selecting a Machine Group
1. Select a machine group. Select the machine group from which host monitoring metrics need to be collected.
If you want to create a machine group, click Create Machine Group:
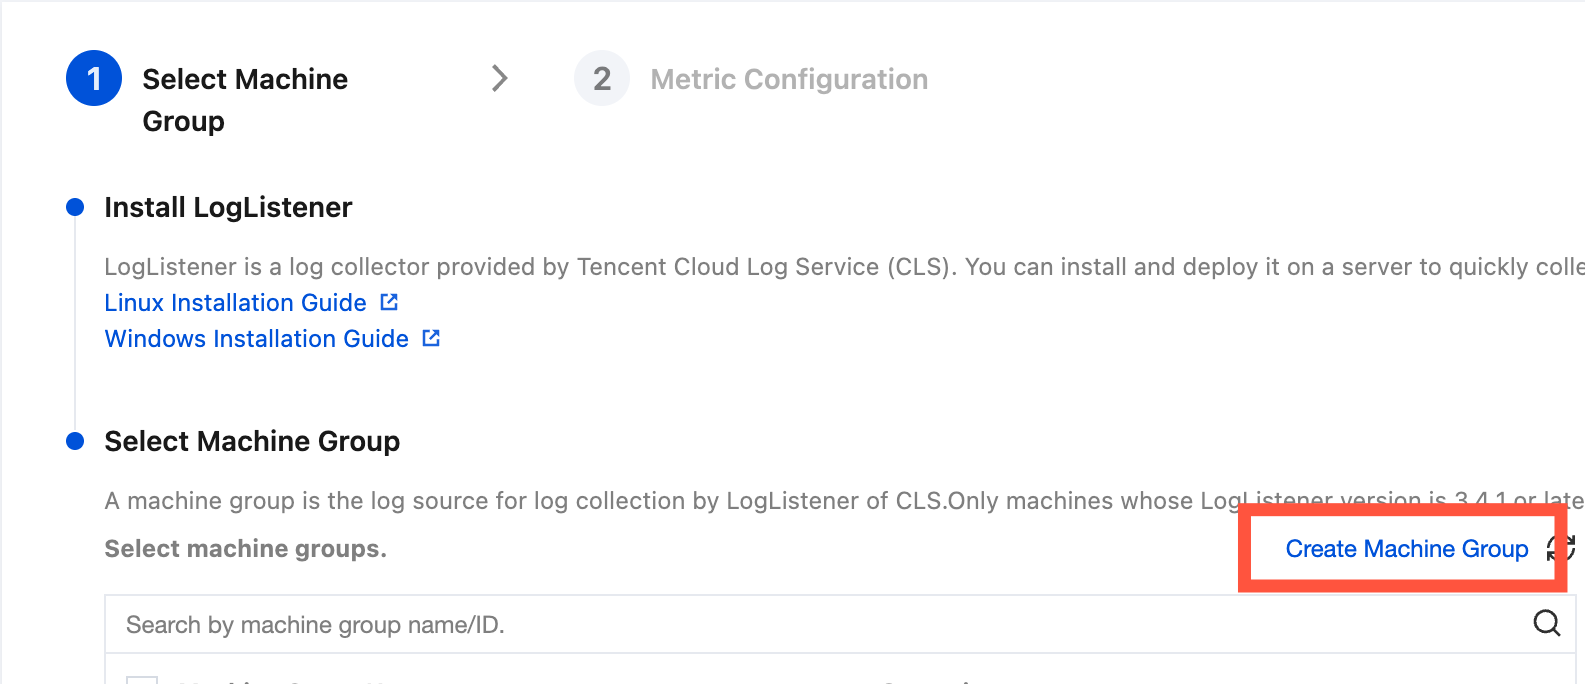
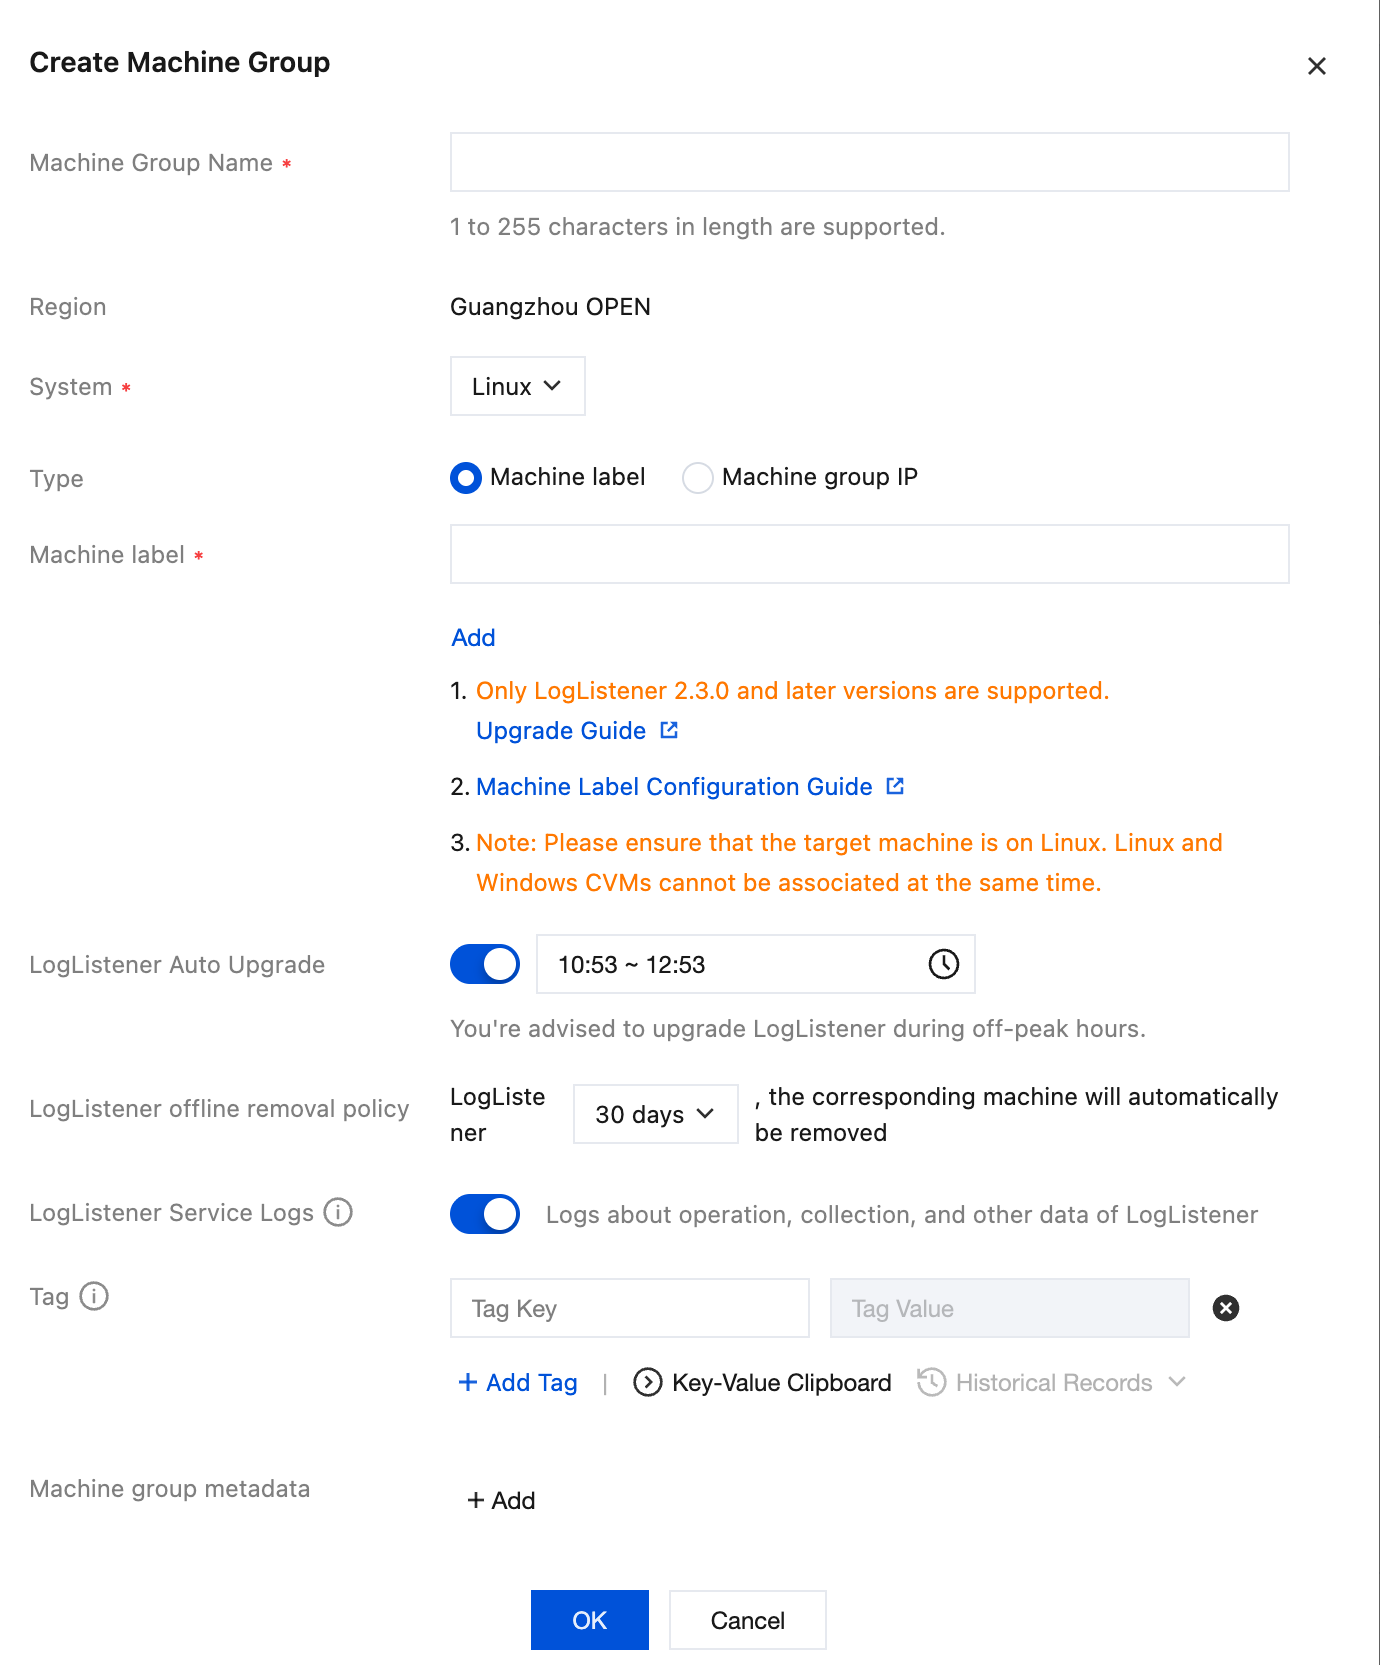
1. Fill in the machine group name, associate the target server with LogListener installed via the machine label (see Machine Group Management for details), and then click Next.
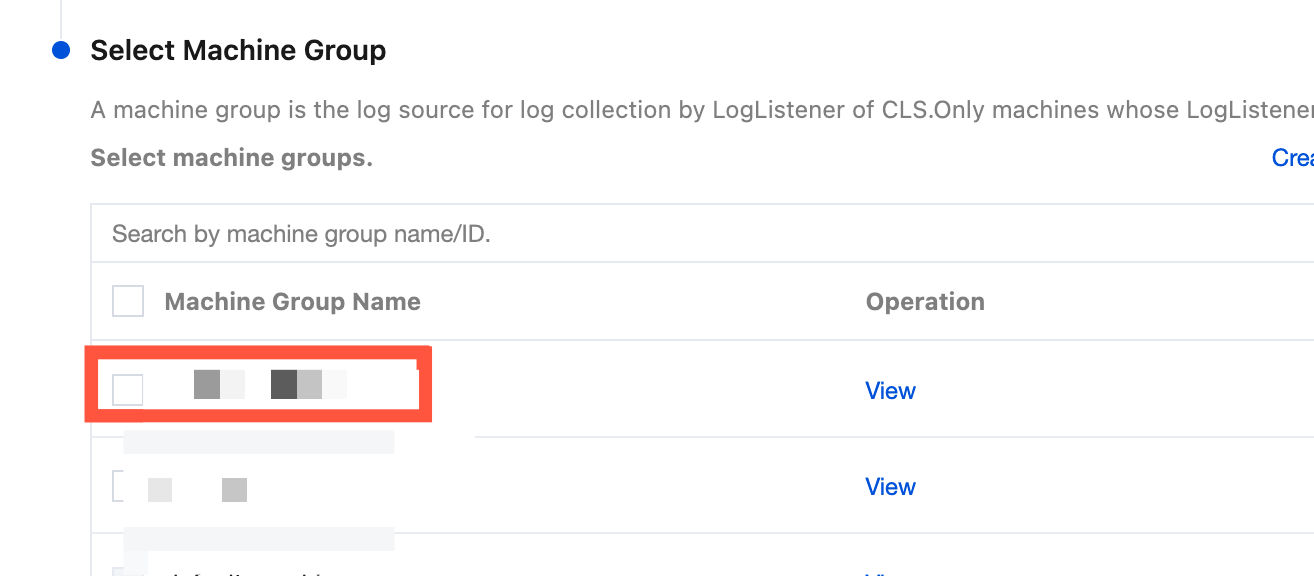
2. After the machine group is created, select it in the list.
If you want to select an existing machine group, perform the following operations:
Select your target machine group in the list and click Next.
2. Configure the collection name and collection interval.
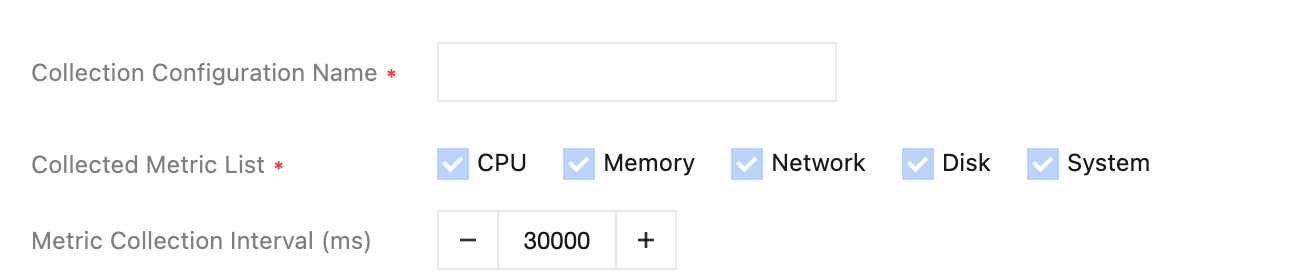
Metric collection interval: The time interval for each request, in milliseconds. The default value is 30000, and the value cannot be lower than 5000.
Step 3: Searching and Analyzing Metrics
At this point, you have completed the configuration of the cloud product metric subscription. Next, you can go to the search and analysis page, select the target metric topic on the left side of the console, and proceed to search and query metrics. For metric search syntax rules, see Syntax and Rules.
Other Operations: Viewing the Host Metric Data Monitoring Dashboard
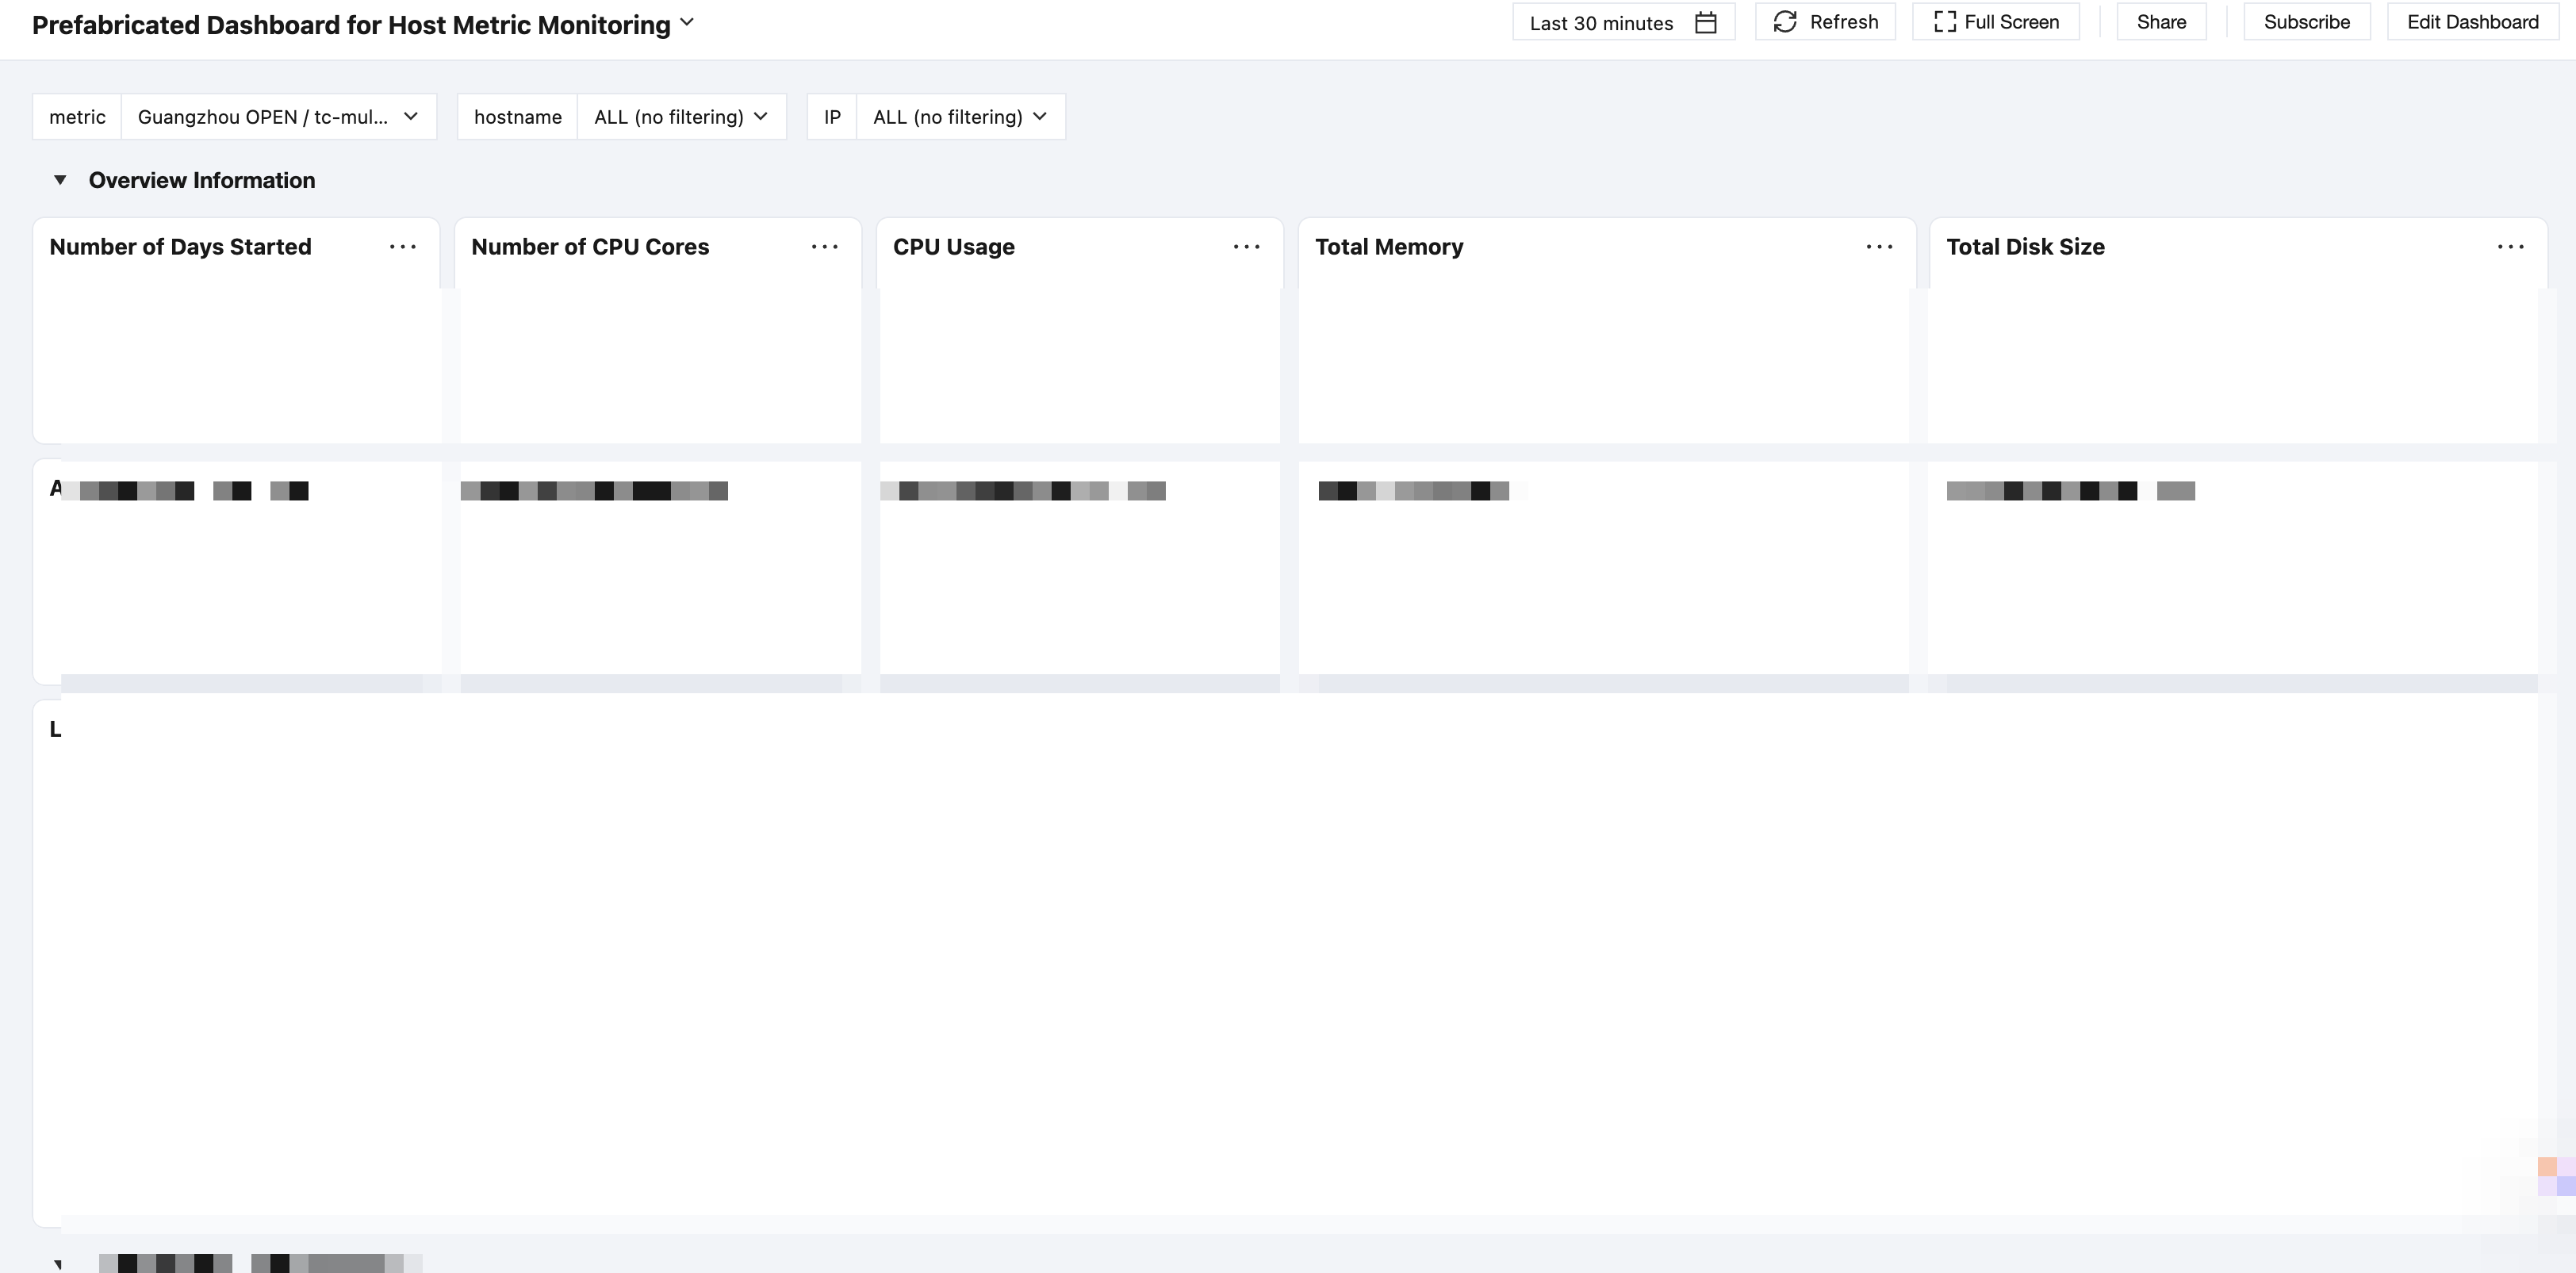
CLS provides preset dashboard capability for host monitoring. Click View Preset Dashboard on the host monitoring metrics list page to open the host monitoring metrics statistics dashboard.

In the preset host metrics monitoring dashboard, you can view all collected data metrics in the visual statistics dashboard.
Metric Description
The descriptions of the collected host monitoring metrics are as follows:
CPU metrics
Metric Name | Description | Unit |
cpu_count | Number of CPU Cores | Core |
cpu_util | CPU utilization, calculated as the percentage excluding idle, wait, and steal | % |
cpu_guest_util | Guest time percentage | % |
cpu_guestnice_util | Nice guest time percentage | % |
cpu_irq_util | Hard IRQ time percentage | % |
cpu_nice_util | Nice time percentage | % |
cpu_softirq_util | Soft IRQ time percentage | % |
cpu_steal_util | Steal time (time waiting for the host CPU) percentage | % |
cpu_sys_util | System time (kernel mode) percentage | % |
cpu_user_util | User time (user mode) percentage | % |
cpu_wait_util | Waiting time (time waiting for I/O) percentage | % |
Memory metrics
Metric Name | Description | Unit |
mem_util | Memory Utilization | % |
mem_cache | Applied for but unused memory | byte |
mem_free | Unused memory | byte |
mem_available | Available memory | byte |
mem_used | Used memory | byte |
mem_swap_util | Swap memory utilization | % |
mem_total | Total memory | byte |
System metrics
Metric Name | Description | Unit |
system_boot_time | System boot time | s |
system_load1 | System average load, 1-minute average | Not involved |
system_load5 | System average load, 5-minute average | Not involved |
system_load15 | System average load, 15-minute average | Not involved |
protocol_tcp_established | Number of established TCP connections | Core |
protocol_tcp_insegs | Total number of received TCP packets | Core |
protocol_tcp_outsegs | Number of sent TCP packets | Core |
protocol_tcp_retran_segs | Number of retransmitted TCP packets | Core |
protocol_tcp_retran_util | Ratio of retransmitted packets to total sent packets | % |
fd_allocated | Number of allocated file descriptors | Core |
fd_max | Maximum number of allocatable file descriptors | Core |
Disk metrics
Metric Name | Description | Unit |
disk_rbps | Disk read throughput per second | byte/s |
disk_wbps | Disk write throughput per second | byte/s |
disk_riops | Disk read operations per second | Times per second |
disk_wiops | Disk write operations per second | Times per second |
disk_rlatency | Average read latency | ms |
disk_wlatency | Average write latency | ms |
disk_util | I/O utilization | % |
disk_space_usage | Disk usage percentage | % |
disk_inode_usage | Inode utilization | % |
disk_space_used | Used disk capacity | byte |
disk_space_total | Total disk size | byte |
disk_inode_total | Total number of inodes | Core |
disk_inode_used | Used inode capacity | Core |
Network metrics
Metric Name | Description | Unit |
net_drop_util | Ratio of discarded packets to total packets | % |
net_err_util | Ratio of error packets to total packets | % |
net_in | Network receiving rate | byte/s |
net_in_pkt | Packets received per second | Packets per second |
net_out | Network sending rate | byte/s |
net_out_pkt | Packets sent per second | Packets per second |
피드백