Exception Diagnosis
Baixar
Modo Foco
Tamanho da Fonte
Scenarios
Exception diagnosis provides real-time health inspection, performance exception detection, and fault localization capabilities for TDSQL Boundless (TDStore engine) instances. This feature collects and displays performance metrics and diagnosis events on a per-instance basis. It helps users quickly perceive exception events such as CPU utilization spikes, memory pressure, high disk usage, slow session accumulation, and deadlocks on a unified page, and further troubleshoot root causes based on diagnosis details.
Scenarios
When CPU/memory utilization spikes abnormally during peak business hours, quickly locate the abnormal instance and view its corresponding TOP active sessions.
When a disk space alarm is triggered, identify the disk usage of the instance.
When a deadlock alarm occurs, view the deadlock blocking cycle, the rolled-back transactions, and the involved SQL statements.
When the business side reports slow database responses, use historical diagnosis to trace back to the abnormal time window and the corresponding events.
Background Information
Exception diagnosis provides comprehensive diagnostic capabilities for TDSQL Boundless instances:
Instance-Level Diagnosis: All diagnosis items are calculated and triggered on a per-instance basis. The alarm values and diagnosis details are aggregated and then uniformly presented in the instance view.
Diagnosis Event: When a key metric of an instance exceeds its threshold, a diagnosis event with a corresponding risk level is generated. The event contains three parts: event summary, description, and intelligent analysis.
On-Site Snapshot: For CPU-related diagnosis events, the TOP active sessions and performance monitoring curves of the instance at that time are automatically captured and attached to the "Description" section of the diagnosis details.
Deadlock Awareness: It has built-in incremental deadlock detection capability, identifies deadlock blocking cycles, and displays the IDs of rolled-back transactions and the involved SQL statements.
Implementation Mechanism
Exception diagnosis employs a dual-channel approach of real-time event-driven detection and scheduled inspection.
Real-Time Channel: It continuously monitors the key metrics of an instance through the performance monitoring data stream and triggers a real-time diagnosis event when a metric exceeds its threshold.
Scheduled Channel: By default, it performs a health inspection every 10 minutes and incrementally scans for deadlock information.
Diagnosis results are persistently saved as "events". Each event contains three parts: event summary, description, and intelligent analysis, and is displayed hierarchically by risk level.
Diagnosis Item Description
Diagnosis | Category | Trigger Condition | Risk level classification |
CPU utilization | Performance | Excessively high CPU utilization | Critical: 80% < CPU utilization Severe: 60% < CPU utilization ≤ 80% Alarm: 40% < CPU utilization ≤ 60% |
Dead lock | Reliability | Database deadlocks | Critical |
Use Limits
Deadlock Version Dependency: Deadlock diagnosis relies on the deadlock system view on the kernel side and takes effect only on instances with kernel version 21.6.1 or later.
Deadlock Inspection Cycle: Deadlock diagnosis employs a "scheduled inspection + incremental scan" approach. By default, it is performed every 10 minutes, with a maximum retrospective period of 30 days per inspection.
Notes
In high-traffic scenarios, resource alarms such as those for CPU, memory, and disk may be triggered consecutively within a short period. DBbrain automatically deduplicates alarms of the same type within a short time window, retaining only the first event.
Prerequisites
The TDSQL Boundless instance has been correctly connected in DBbrain.
The currently logged-in account has DBbrain view permissions for this instance.
View Diagnostic Information
1. Log in to the DBbrain console.
2. In the left sidebar, select Performance Optimization.
3. At the top of the page, select TDSQL Boundless as the database type, and then select the target instance ID.
4. Click the Exception Diagnosis tab.
5. On the right side of the page, select to view real-time or historical diagnosis information.
6. View the core health metrics, exception event diagnosis charts, SQL status, and diagnosis tips for the selected time range.
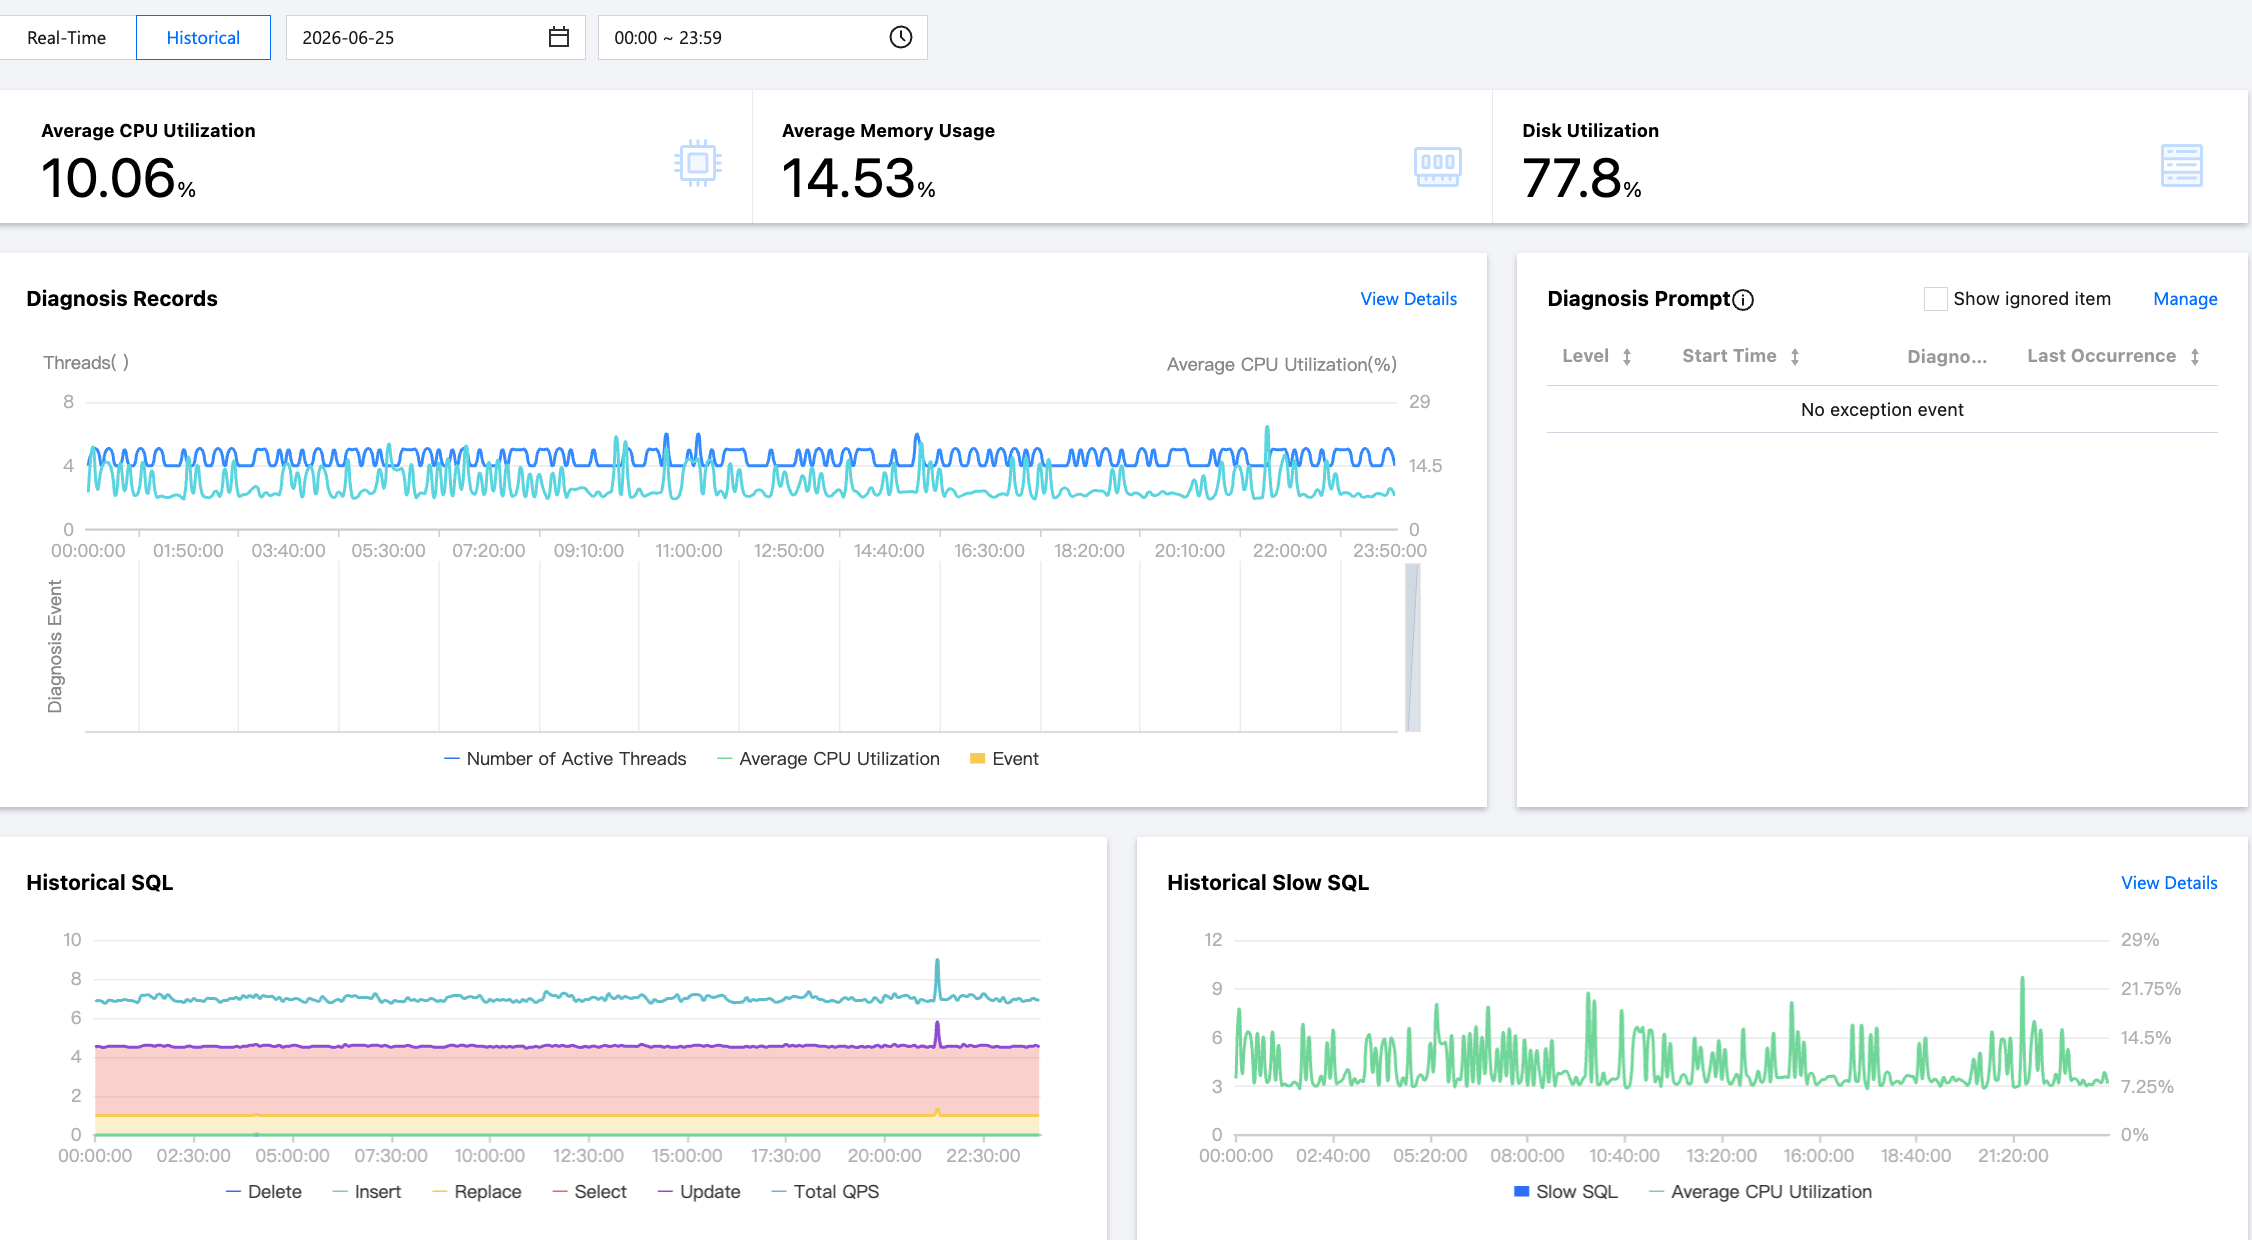
View core health metrics
Average CPU utilization: Check whether it is within the normal range, and pay attention to the trend arrows (↑ for increase, ↓ for decrease).
Average Memory Usage: Pay attention to the trend arrows (↑ for increase, ↓ for decrease) to assess whether there is a risk of memory leaks.
Disk utilization: Check whether it is close to the alarm threshold (recommended < 80%).
Analyze real-time/historical diagnosis
The time series of active threads (Threads) and average CPU utilization is displayed. The location of diagnosis events is marked by red blocks below the curve.
6.1.1 Observe the trend of active threads and average CPU utilization.
A sudden spike in thread quantity + a synchronous surge in CPU utilization: This may be caused by a sharp increase in concurrent requests.
A sharp increase in CPU utilization with no significant change in thread quantity: This may be caused by a single complex SQL query.
6.1.2 Hover the cursor over the diagnosis event bar chart to display information such as risk level, overview, and start/end time. Click the bar chart to go to the event details page to view information such as event details, description, intelligent analysis, and optimization suggestions. For more information about how to view event details, see Exception Alarms.
Review the color distribution on the event timeline below to quickly locate periods with dense abnormal activity. If you need to view more dimensional metrics, click View Details in the upper-right corner.
View real-time/historical SQL trend charts and real-time/historical slow SQL trend charts
Real-time/Historical SQL: View the trend of execution counts for various SQL types, such as Select and Update.
A sudden surge in a specific type of SQL may be caused by a backlog resulting from business exceptions or slow queries.
Real-time/Historical Slow SQL: View the correlation curve between the number of slow SQLs and average CPU utilization.
If the slow SQL and CPU utilization curves rise synchronously, it indicates that slow queries may be the primary cause of CPU resource consumption. If you need to perform an in-depth analysis, click View Details to go to the slow SQL analysis page.
Viewing Diagnosis Prompts
List diagnosis events triggered within the last 3 hours, including fields such as event level, start time, diagnosis item, and last occurrence time.
Diagnosis events are displayed at the following levels: Healthy, Informational, Alarm, Critical, and Fatal.
Viewing the diagnosis event details
In the Diagnosis Prompt section, click the row of a specific event alarm, or hover the cursor over the event alarm and click View to go to the event details page and view the event details.
Event details mainly include event details, description, intelligent analysis, and optimization suggestions. The event details displayed vary depending on the diagnosis type. The details actually displayed shall prevail.
Event details: includes information such as diagnosis item, start/end time, risk level, and overview.
Description: includes information such as problem snapshots and performance trends of the exception or health inspection event.
Intelligent analysis: displays descriptions such as problem description and possible causes to help you understand the event.
Optimization suggestions: provides corresponding handling suggestions for different diagnostic items such as resource, session, and deadlock.
Ignoring/Unignoring Diagnosis Prompt Alarms
Note:
This feature is only applicable to exception alarms for diagnostic items that are not Health Inspections.
In the Diagnosis Prompt section, hover the cursor over an event alarm, click Ignore, and select either Ignore this item or Ignore this type, then click OK.
Ignore This Item: ignores only this specific alarm.
Ignore This Type: ignores exception alarms caused by the same root cause.
Ignored diagnosis events will be displayed in gray.
To unignore, click Unignore and then click OK.
To display ignored alarms, select Show Ignored item.
Click Manage to view ignored content and ignored types.
You can go to the event details page and click Ignore or Unignore in the upper-right corner.
Related Documentation
Following Steps
If CPU/memory alarms persist, go to the Performance Trends page to view metric curves over a longer time range, and use Slow SQL Analysis to identify specific high-consumption SQL statements.
If disk utilization is high, it is recommended that you go to the Space Analysis page to view the space usage of the TOP tables and identify data objects with rapidly growing space consumption.
If you find slow SQL, go to the slow SQL analysis page to view the execution plan and optimization suggestions.
If the number of threads is abnormal, go to the Real-time Session page to view current active connections and Kill abnormal sessions if necessary.
FAQs
Q1: Why Are There No Event Markers in the Historical Diagnosis Chart?
No diagnosis events were triggered during this period, indicating that the instance is running normally.
It is also possible that the diagnosis feature was not enabled at that time. Check whether the enabling time is later than the start time of the query.
Q2: Are Green Blocks on the Event Timeline a Concern?
All green indicates that all diagnosis events are at the "Healthy" level, requiring no special handling.
It is recommended that you still check whether the metrics in the trend chart show a slow upward trend (for example, a gradual increase in memory usage). Such situations may not have triggered the alarm threshold yet.
Q3: Why Does the Instance CPU Average Utilization Exceed 100%?
Average CPU Utilization reflects the overall CPU pressure of an instance. It may exceed 100% in high-load scenarios, influenced by the instance specification and statistical method. For specific alarm values and trigger times, view the corresponding diagnosis events in the Diagnosis Hints list.
Ajuda e Suporte
Esta página foi útil?
Você também pode entrar em contato com a Equipe de vendas ou Enviar um tíquete em caso de ajuda.
comentários