This document describes how to use dynamic thresholds and their use cases.
Creating Dynamic Threshold Alarm Policy
1. Log in to the TCOP console and go to Alarm Policy.
2. Go to the Alarm Policy page and click Create.
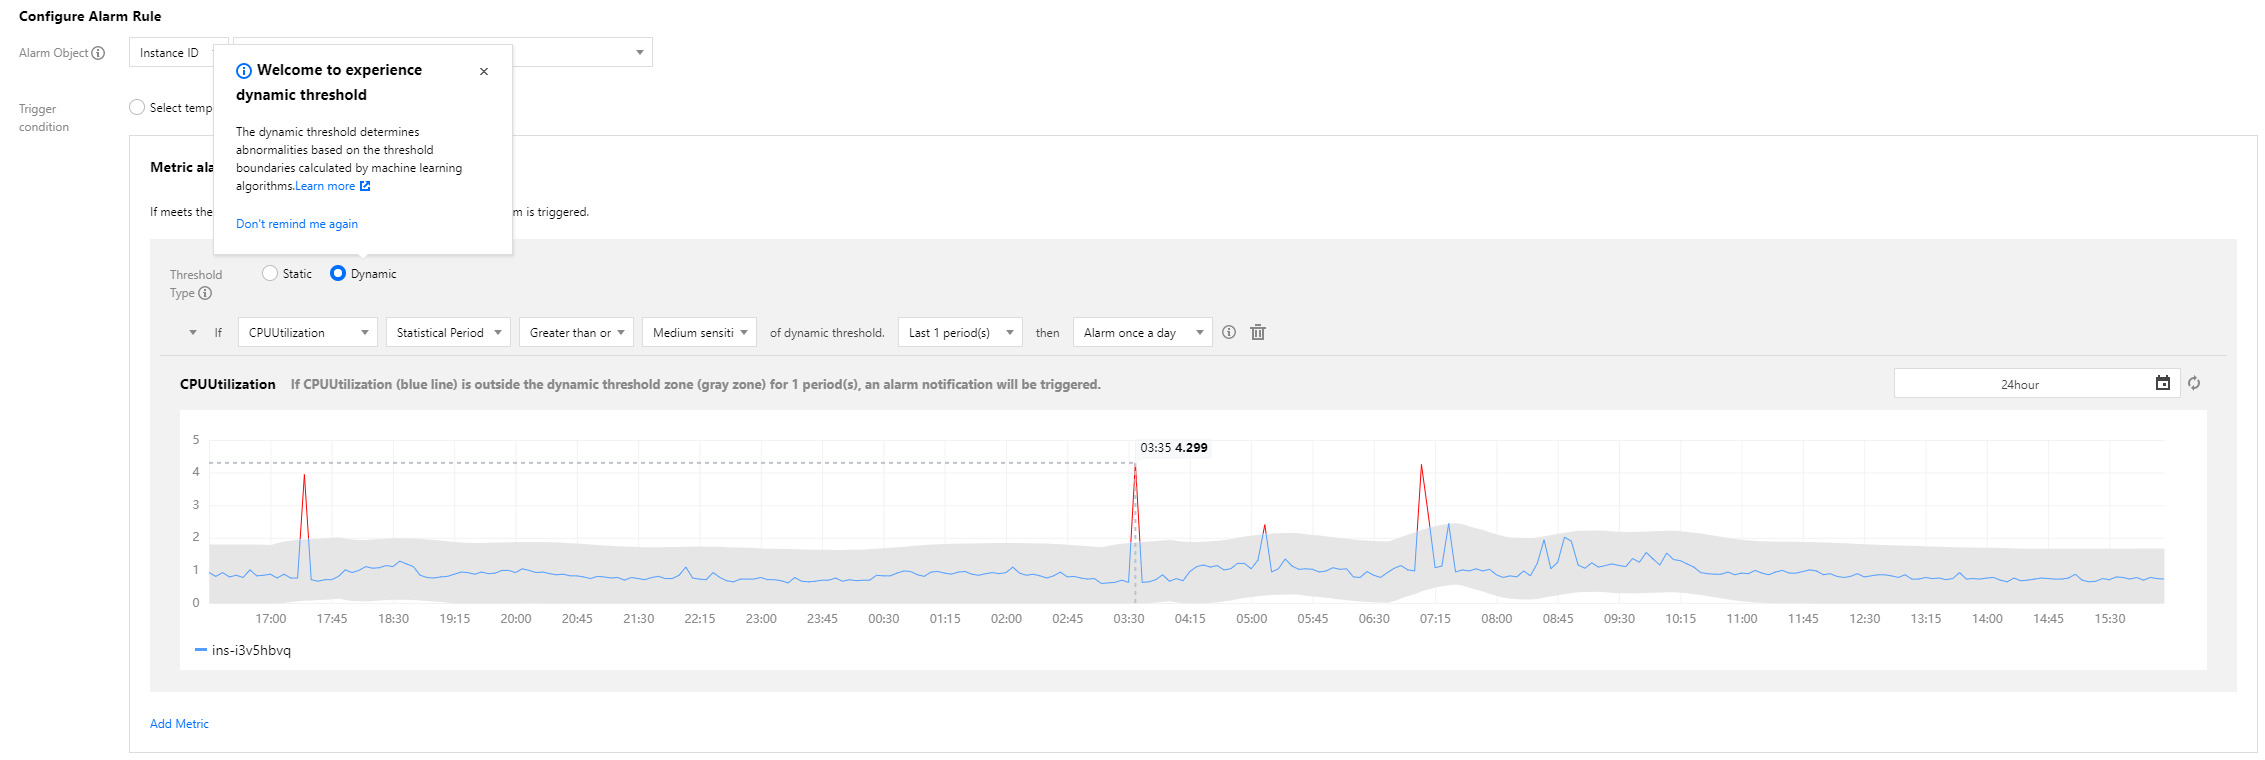
3. In the Alarm Rule Configuration section, select Manual Configuration, and select Dynamic as the threshold type. After you finish all configurations, click Save.
Sensitivity
The sensitivity of dynamic thresholds indicates the relative degree of deviation of metrics from a reasonable range based on your business needs for metric exception detection. Options include:
High: the tolerance for metrics to deviate from a reasonable range is low, and you may receive more alarm messages.
Medium: the tolerance for metrics to deviate from a reasonable range is medium, and you may receive a medium number of alarm messages. This is the default setting.
Low: the tolerance for metrics to deviate from a reasonable range is high, and you may receive less alarm messages.
Condition setting
You can set the same alarm rule for different metrics and can set the alarm trigger condition as a metric going beyond the upper or lower boundary of the dynamic threshold zone. Options include:
Above or below: the metric is detected as exceptional when above the upper boundary or below the lower boundary of the dynamic threshold zone; for example, for metrics that fluctuate within a certain range.
Above: the metric is detected as exceptional when above the upper boundary of the dynamic threshold zone; for example, for the CPU utilization metric.
Below: the metric is detected as exceptional when below the lower boundary of the dynamic threshold zone; for example, for the business successes and success rate metrics.
Chart elements:
Curve: aggregate display of the original metric values reported by users.
Gray shaded zone: the reasonable range calculated by the dynamic threshold. When the metric is in this zone, it is normal; otherwise, it is exceptional.
Blue curve: the time period when the metric is detected as normal by the dynamic threshold.
Red curve: the time period when the metric is detected as exceptional by the dynamic threshold.
Use Cases of Dynamic Thresholds
Common use cases of dynamic thresholds:
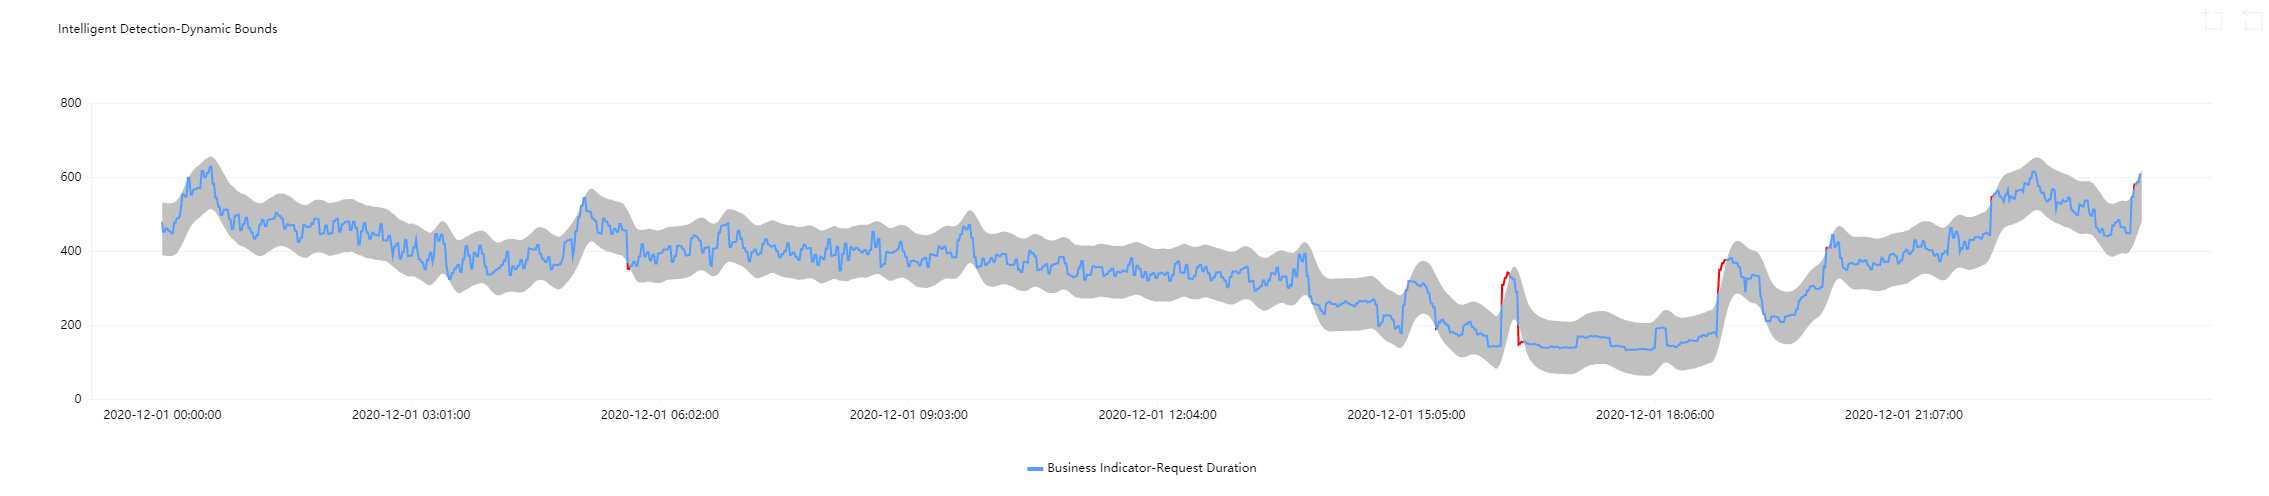
Use case 1: metrics with periodic fluctuations
When metrics fluctuate periodically, obvious exceptions cannot be detected if you set static thresholds with large deviations; yet setting static thresholds with small deviations will cause many time periods to be wrongly detected as exceptional. Using dynamic thresholds ensures detection accuracy and avoids repeated alarm notifications.
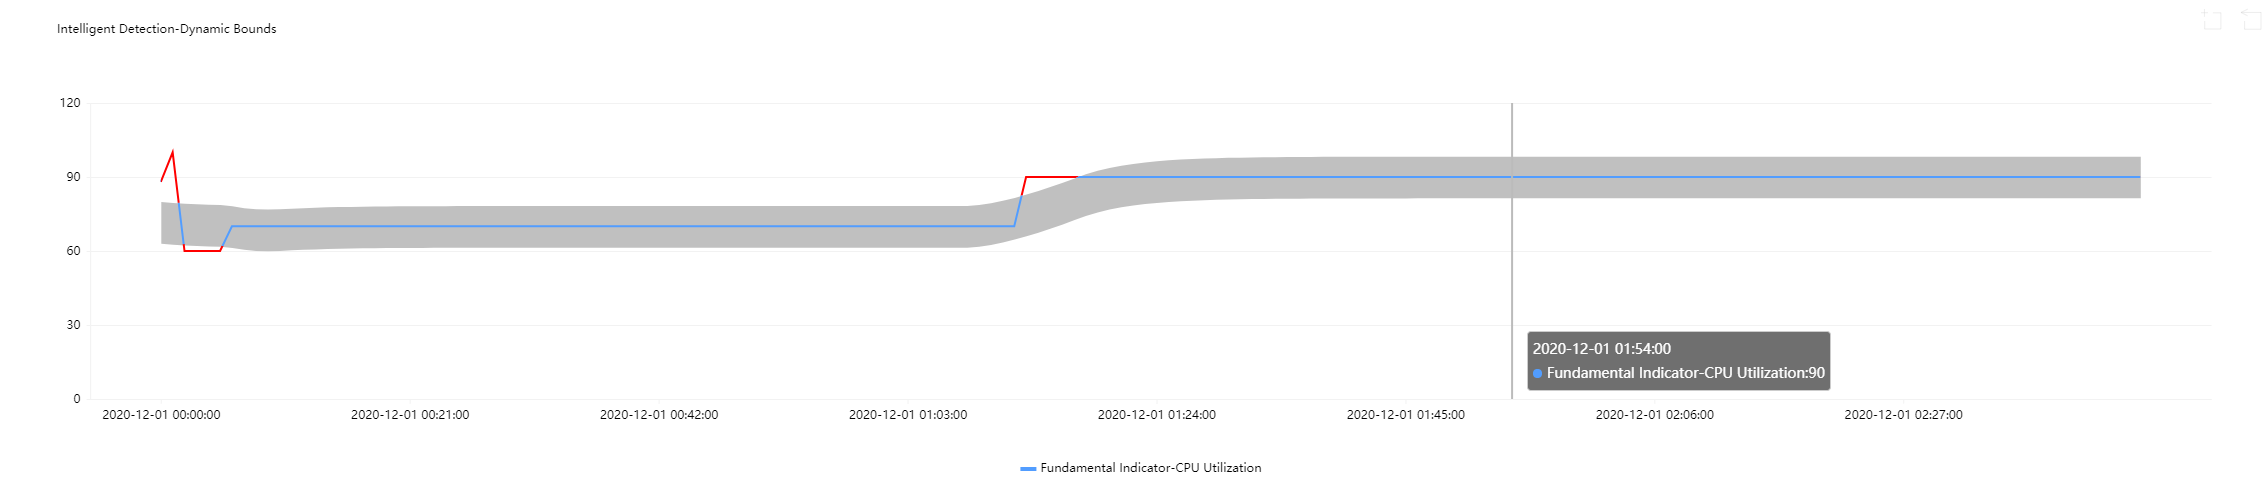
Use case 2: metric curves with ascending/descending sections
If you set static thresholds for metric curves with reasonably ascending/descending sections, such sections will be detected as exceptional. Yet if you use dynamic thresholds, the allowed range will be adjusted adaptively, and exceptions will be reported only when there is a large metric value change.
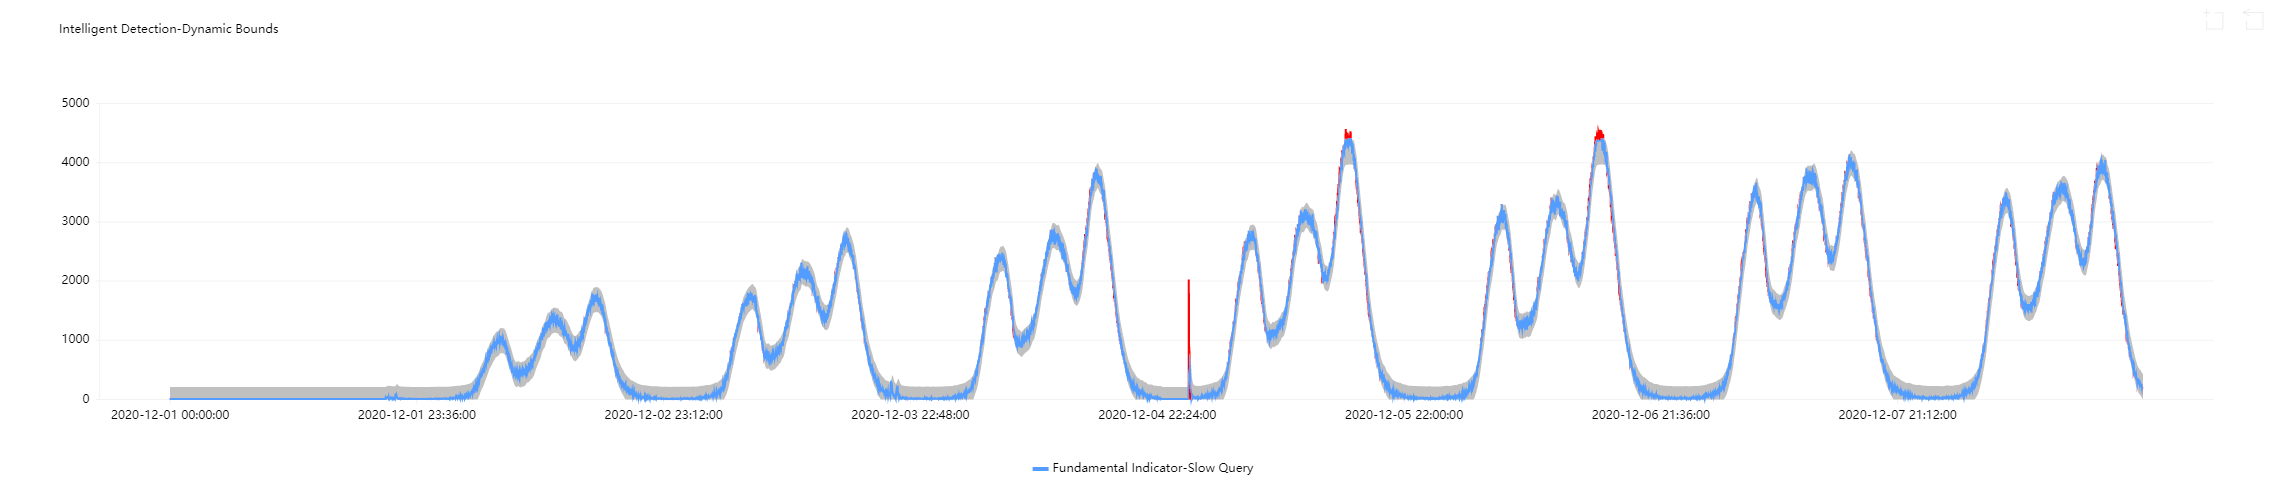
Use case 3: metric curves with sudden increase or decreases
It's hard to set appropriate static thresholds for metric curves with sudden increases or decreases. If such curves do not go beyond a static threshold, the sudden increases or decreases will not be detected as exceptional. Nonetheless, if you use dynamic thresholds, such sudden increases and decreases will be automatically captured, and exceptions will be reported only when there is a large metric value change.
You can set different sensitivity levels to capture changes of different extents for triggering alarms.
You are advised to use dynamic thresholds for the following metrics:
Use Case
Metric
Description
Percentage
Success rate, failure rate, packet loss rate, traffic hit rate, outbound traffic utilization, query rejection rate, and bandwidth utilization
Such metrics range between 0 and 100%. Users will only concern if such metrics reach certain levels. For example, users will only care when the disk utilization exceeds 95%. It is suitable to use static thresholds or both static and dynamic ones for such metrics.
Such metrics usually change over time with no certain range and may also fluctuate widely. It is suitable to use dynamic thresholds for such metrics.
Delay
Delays, delay distance, and delay time
Such metrics fluctuate mildly yet their ranges are uncertain. It is suitable to use dynamic thresholds for such metrics.
Others
Slow queries, TencentDB threads, Redis connections, TCP connections, QPS hard disks, IO wait time, temporary tables, full table scans, and unconsumed messages in Kafka
It is suitable to use dynamic thresholds for such metrics.