tencent cloud

Tencent Cloud Observability Platform

Release Notes and Announcements
Release Notes
Product Introduction
Overview
Strengths
Basic Features
Basic Concepts
Use Cases
Use Limits
Purchase Guide
Tencent Cloud Product Monitoring
Application Performance Management
Mobile App Performance Monitoring
Real User Monitoring
Cloud Automated Testing
Prometheus Monitoring
Grafana
EventBridge
PTS
Quick Start
Monitoring Overview
Instance Group
Tencent Cloud Product Monitoring
Application Performance Management
Real User Monitoring
Cloud Automated Testing
Performance Testing Service
Prometheus Getting Started
Grafana
Dashboard Creation
EventBridge
Alarm Service
Cloud Product Monitoring
Tencent Cloud Service Metrics
Operation Guide
CVM Agents
Cloud Product Monitoring Integration with Grafana
Troubleshooting
Practical Tutorial
Application Performance Management
Product Introduction
Access Guide
Operation Guide
Practical Tutorial
Parameter Information
FAQs
Mobile App Performance Monitoring
Overview
Operation Guide
Access Guide
Practical Tutorial
Tencent Cloud Real User Monitoring
Product Introduction
Operation Guide
Connection Guide
FAQs
Cloud Automated Testing
Product Introduction
Operation Guide
FAQs
Performance Testing Service
Overview
Operation Guide
Practice Tutorial
JavaScript API List
FAQs
Prometheus Monitoring
Product Introduction
Access Guide
Operation Guide
Practical Tutorial
Terraform
FAQs
Grafana
Product Introduction
Operation Guide
Guide on Grafana Common Features
FAQs
Dashboard
Overview
Operation Guide
Alarm Management
Console Operation Guide
Troubleshooting
FAQs
EventBridge
Product Introduction
Operation Guide
Practical Tutorial
FAQs
Report Management
FAQs
General
Alarm Service
Concepts
Monitoring Charts
CVM Agents
Dynamic Alarm Threshold
CM Connection to Grafana
Documentation Guide
Related Agreements
Application Performance Management Service Level Agreement
APM Privacy Policy
APM Data Processing And Security Agreement
RUM Service Level Agreement
Mobile Performance Monitoring Service Level Agreement
Cloud Automated Testing Service Level Agreement
Prometheus Service Level Agreement
TCMG Service Level Agreements
PTS Service Level Agreement
PTS Use Limits
Cloud Monitor Service Level Agreement
API Documentation
History
Introduction
API Category
Making API Requests
Monitoring Data Query APIs
Alarm APIs
Legacy Alert APIs
Notification Template APIs
TMP APIs
Grafana Service APIs
Event Center APIs
TencentCloud Managed Service for Prometheus APIs
Monitoring APIs
Data Types
Error Codes
Glossary

Prometheus Getting Started

PDF
Modo Foco
Tamanho da Fonte
Última atualização: 2024-09-05 11:58:57

Feature Overview

TMP provides the highly available Prometheus service as well as the open-source visualization tool Grafana while inheriting the monitoring capabilities of the open-source Prometheus, which reduce your development and Ops costs.
Note:
If you have already created a TKE cluster, you can create a TMP instance in the TMP console and install the Prometheus monitoring plugin to monitor the cluster. In addition, TMP is integrated with Grafana and predefined dashboards for you to view performance metric data in different dimensions.

Prerequisites

Create a TKE cluster.

Step 1. Create a TMP instance

1. Log in to the TMP console.
2. Click Create to enter the purchase page and purchase an instance as needed. For more information, see Creating Instance.

Step 2. Integrate with TKE

1. In the TMP instance list, click the ID/Name of the newly created instance.
2. Go to the TMP management center and click Integrate with TKE on the left sidebar.
3. Perform the following operations on the cluster monitoring page.
Associate a cluster: Associate a cluster with a TMP instance as instructed in Associating with Cluster.
Configure data collection: Configure a data collection rule to monitor your business data by adding the configuration in the console or via a YAML file.
Streamline basic monitoring metrics: Select only the required metrics to avoid unnecessary fees as instructed in Streamlining Monitoring Metrics.

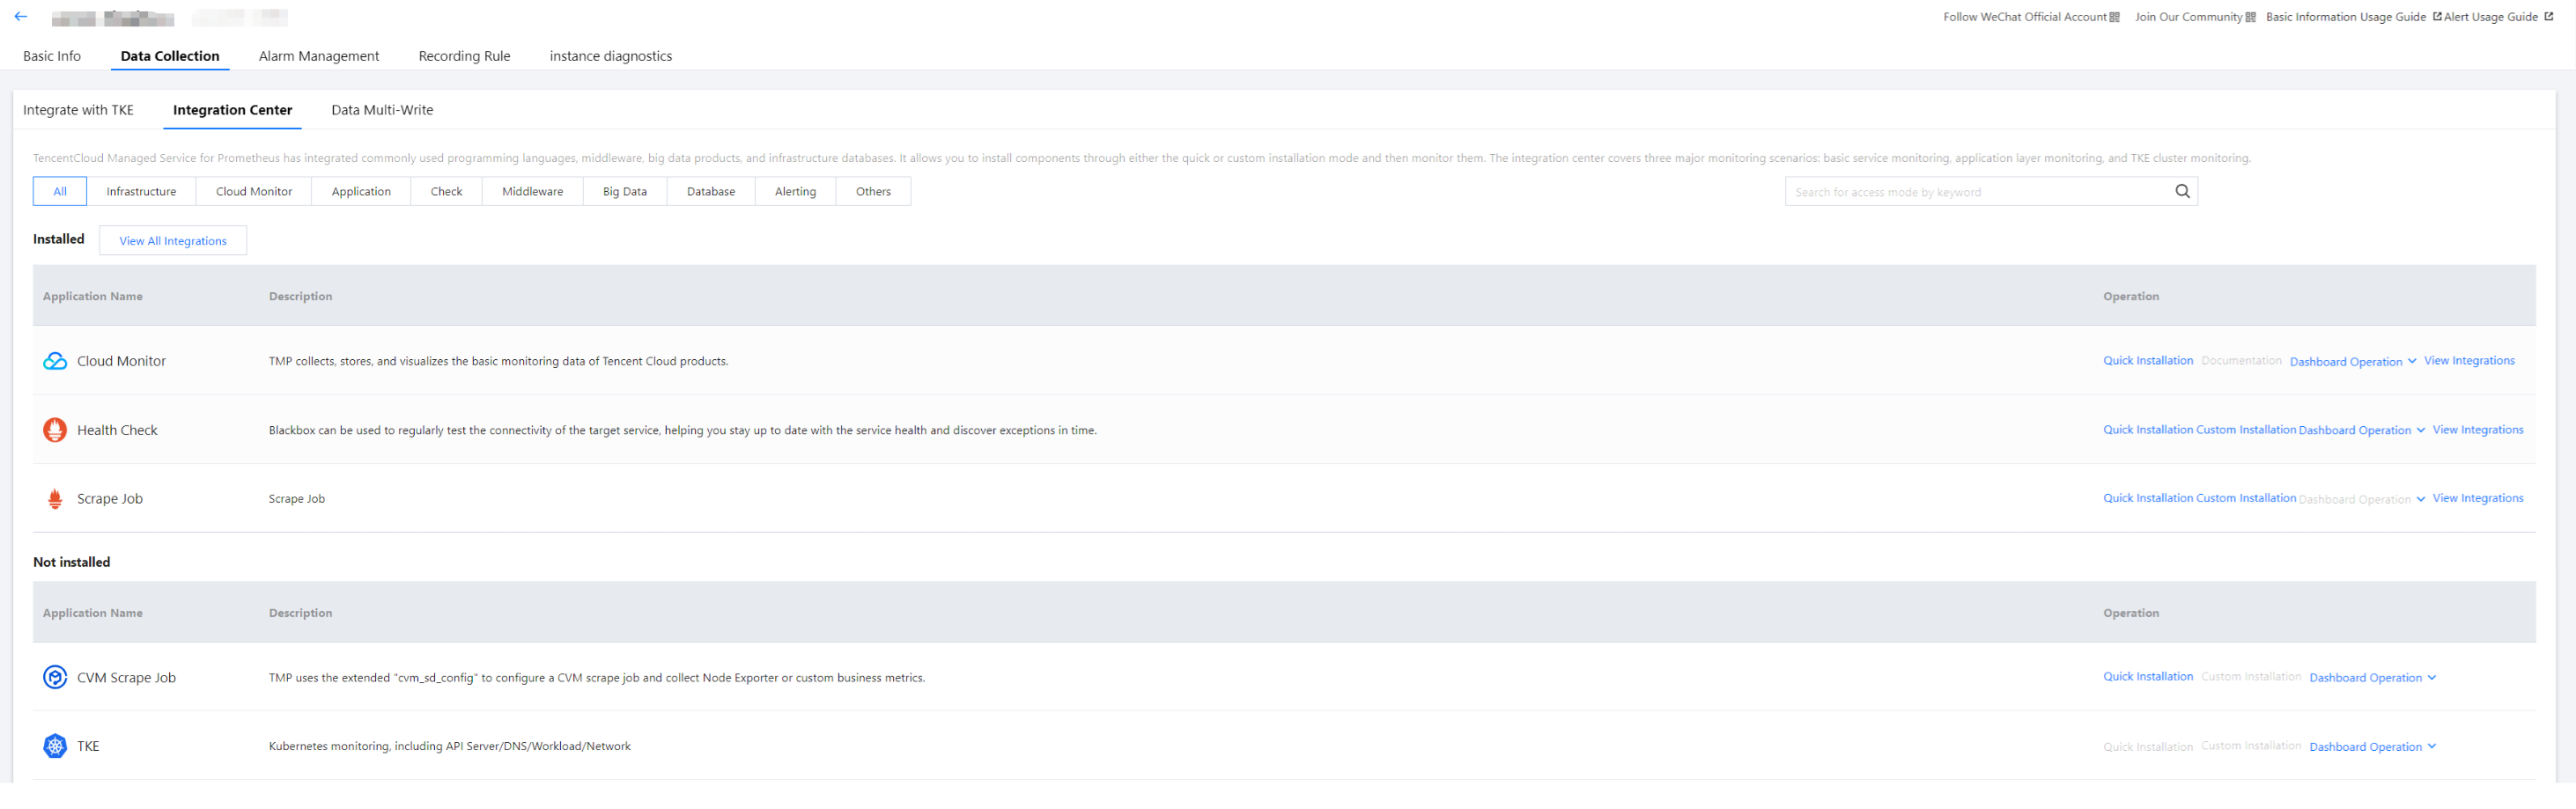
Step 3. Integrating a service

To facilitate access, TMP integrates commonly used development languages, middleware, and big data. You only need to follow the instructions to monitor the corresponding components. It also provides out-of-the-box Grafana monitoring dashboards.


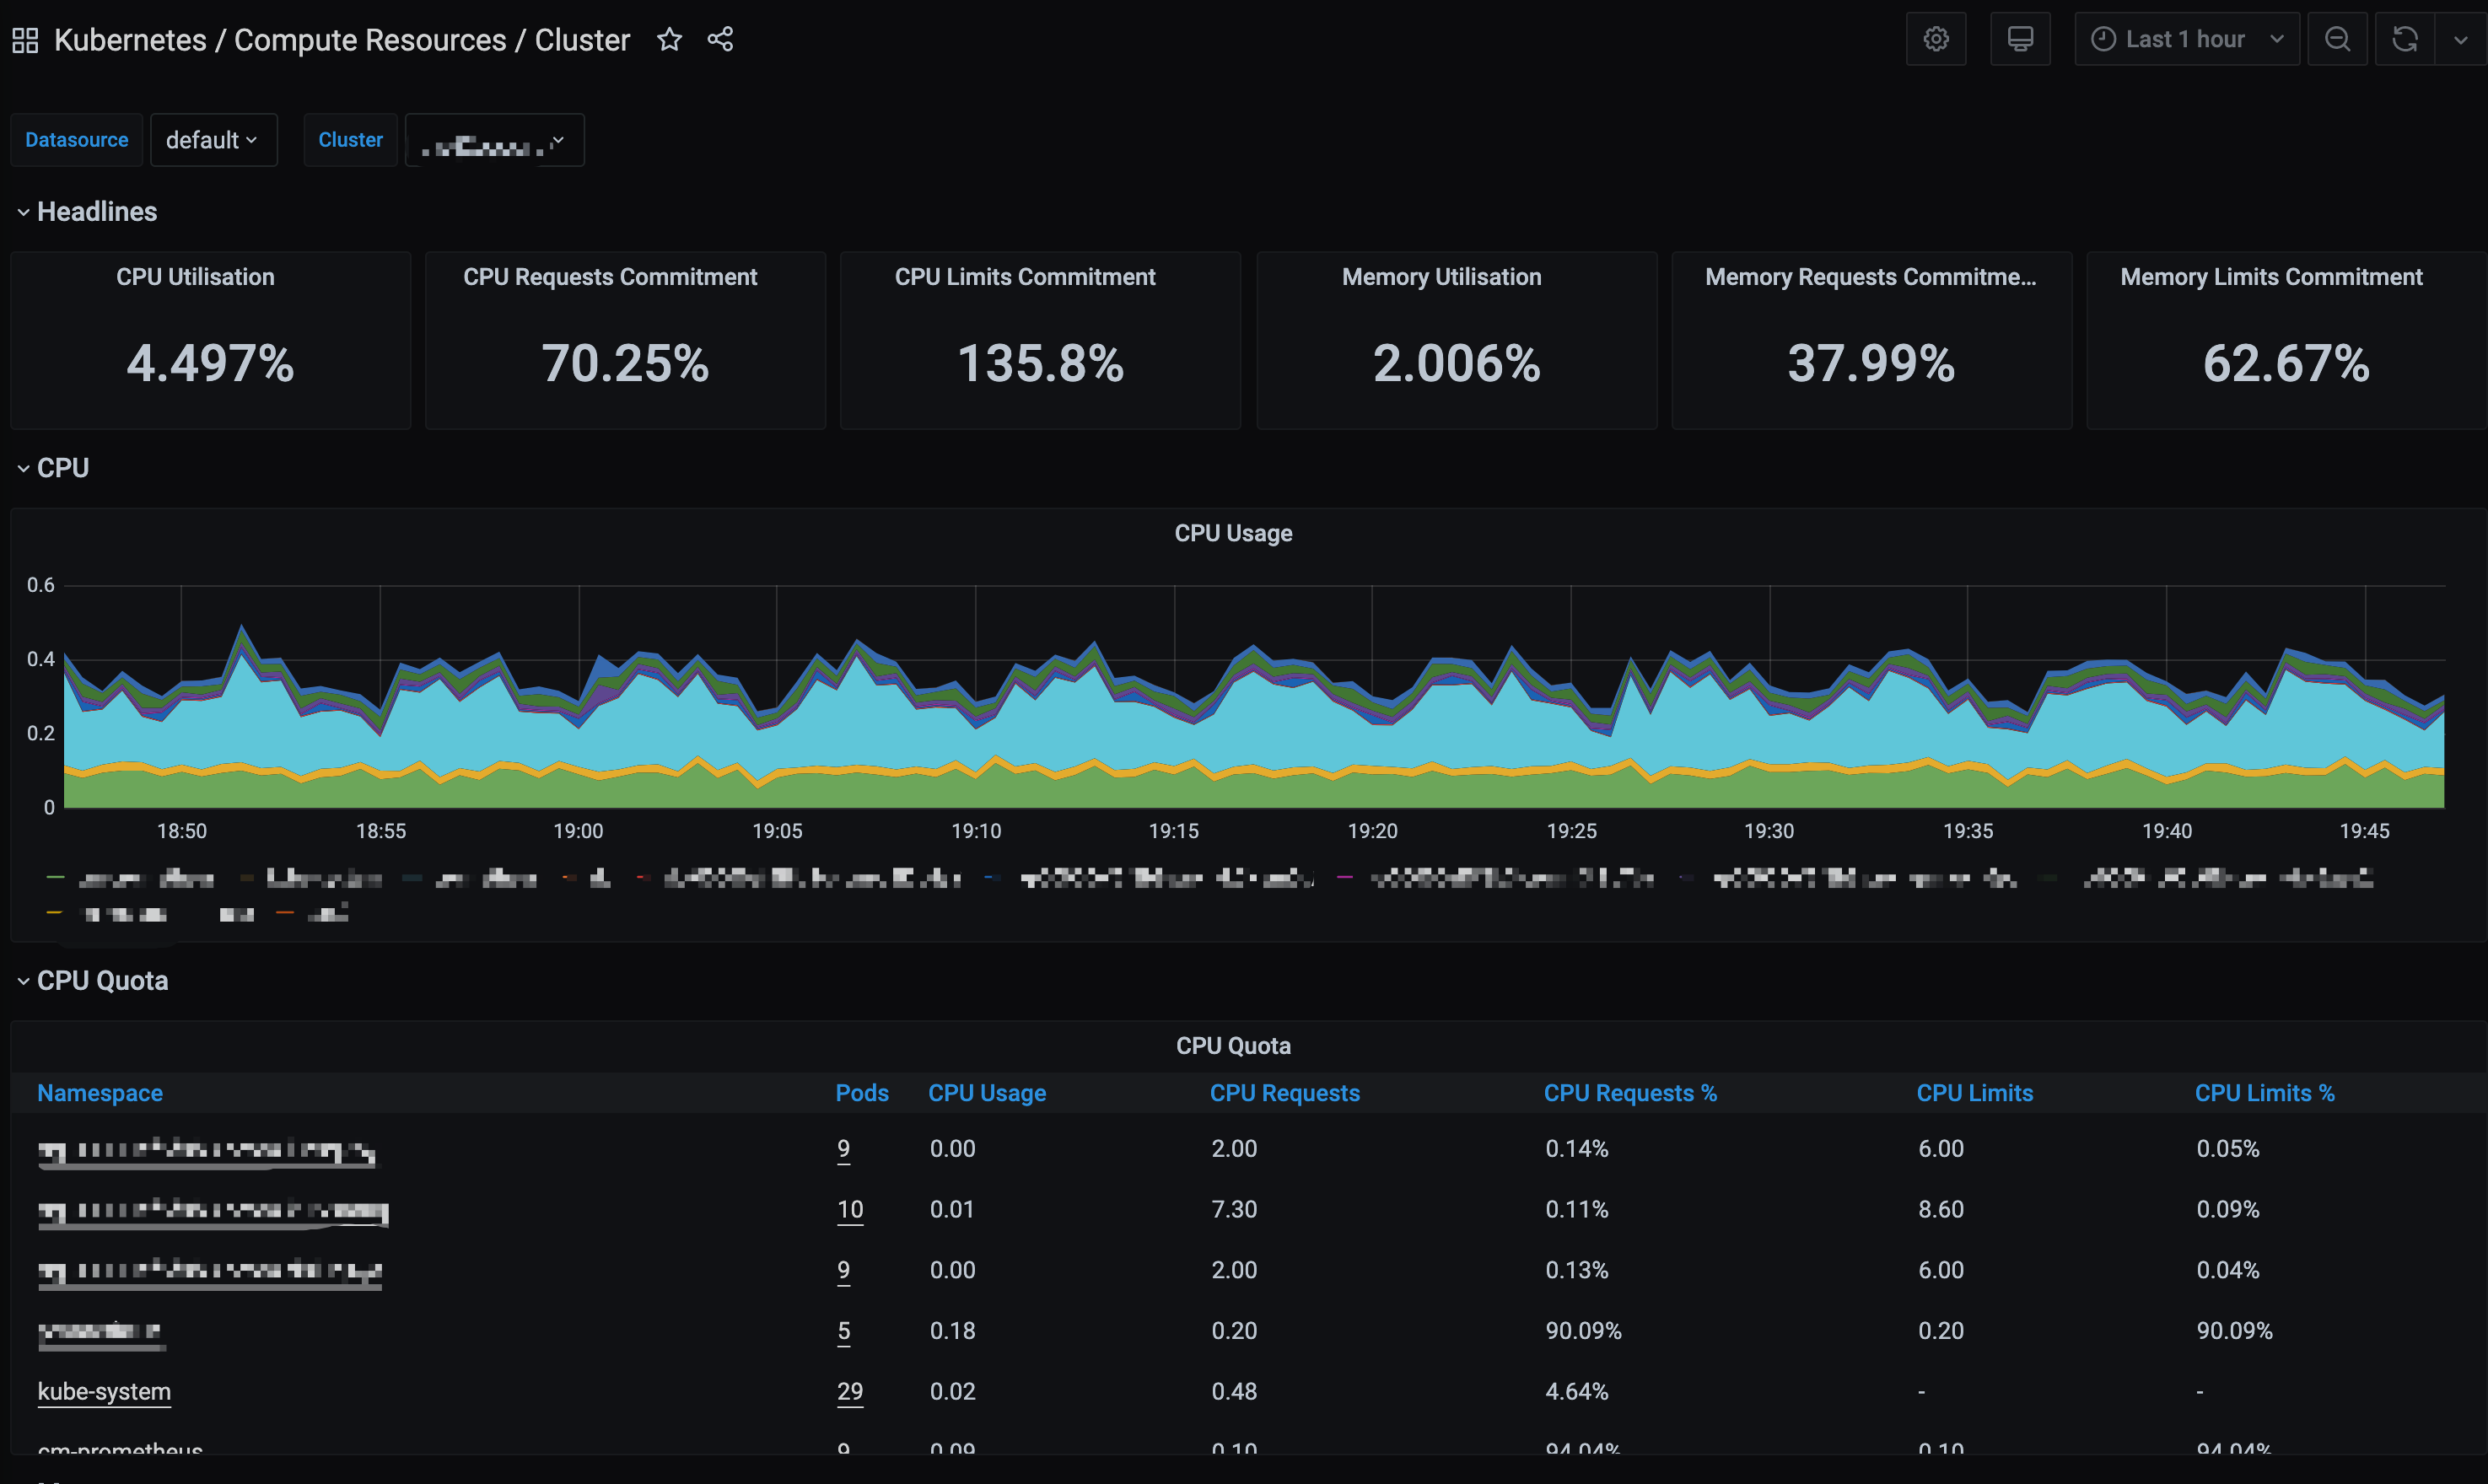
Step 4. View monitoring data in Grafana

TMP offers the out-of-the-box Grafana service. It also integrates a wealth of dashboards for Kubernetes basic monitoring and common service monitoring, which can be quickly used.
1. In the TMP instance list, find the corresponding TMP instance, click

on the right of the instance ID to open your Grafana page, and enter your account and password to access the Grafana visual dashboard operation section.
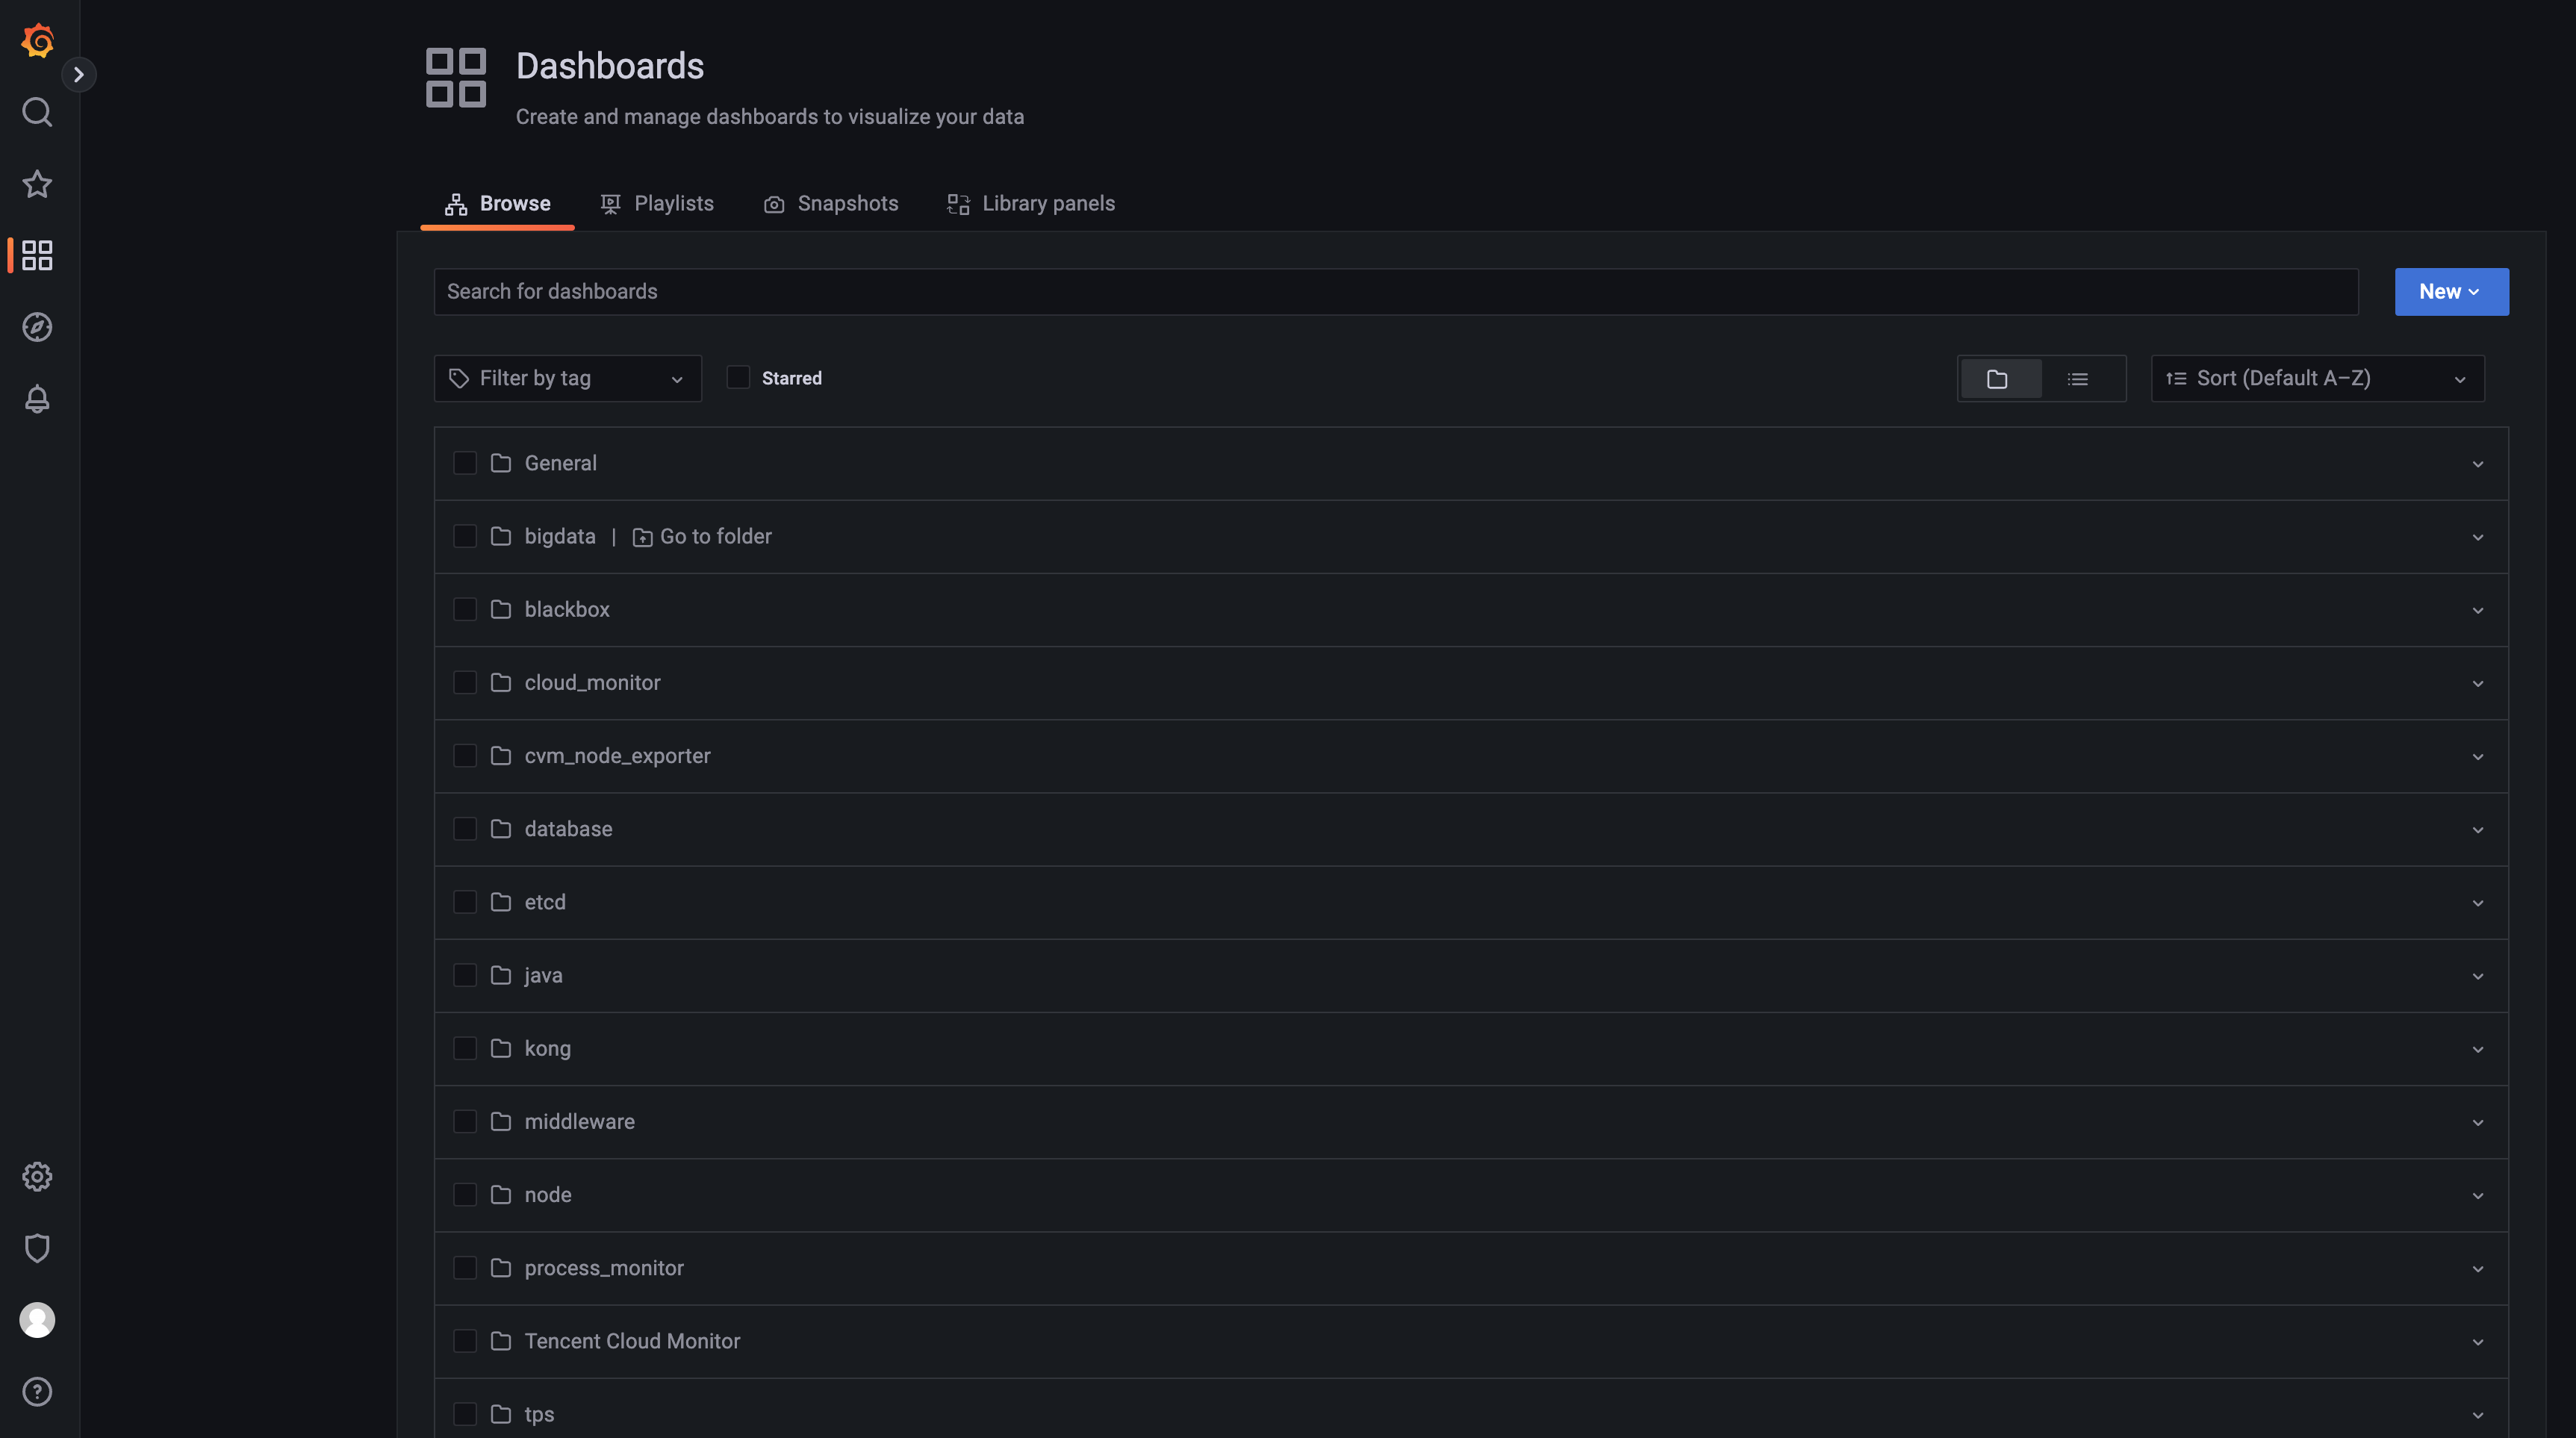
2. Enter Grafana and click

to expand the monitoring panel.


3. Click the name of the corresponding monitoring chart to view the monitoring data.


Note:
For more information on how to use Grafana, see Get started.

Ajuda e Suporte

Esta página foi útil?

comentários