1. Log in to the TCOP console, and select Managed Service for Prometheus.
2. Find the corresponding instance in the instance list. In the Operation column, click More > Grafana > Associate with TCMG, or click Associate with TCMG in the TCMG Access Address column.
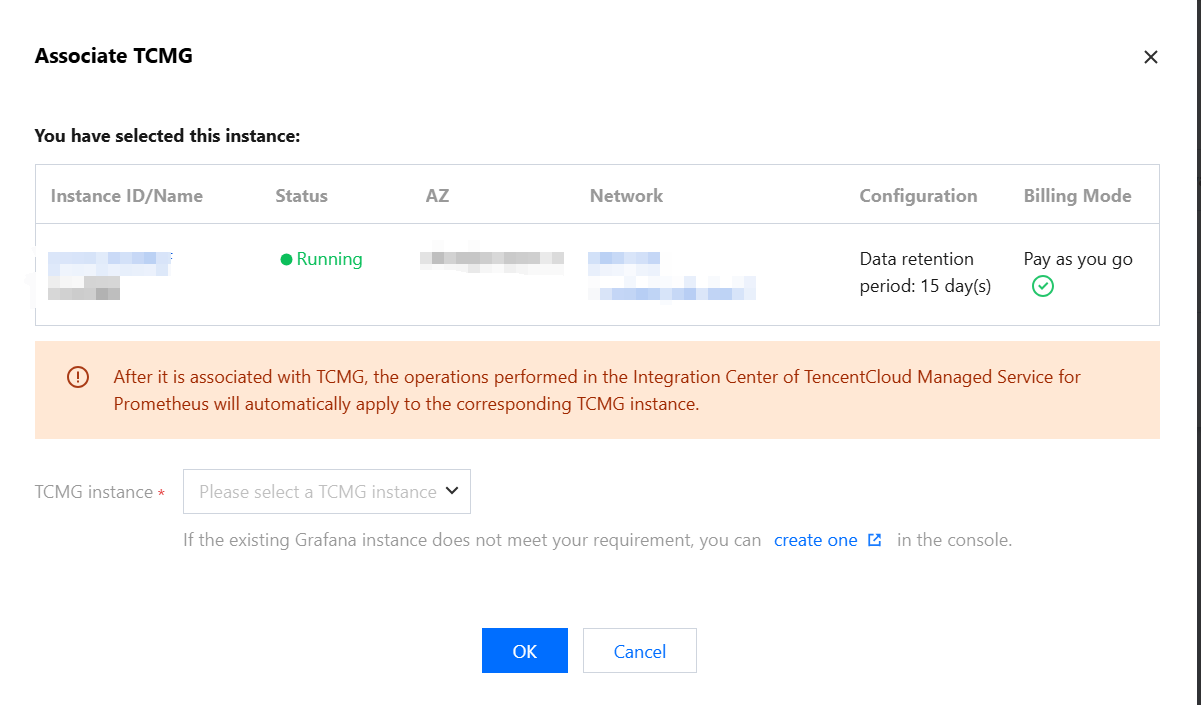
3. Select a Grafana instance in the pop-up window, and click OK.
Logging in to the Grafana Platform
1. Log in to the
1. TCOP console, and select Managed Service for Grafana.
2. In the instance list, find the corresponding instance, click
or click Log In in the Operation column.
3. On the Grafana login page, enter your account password.