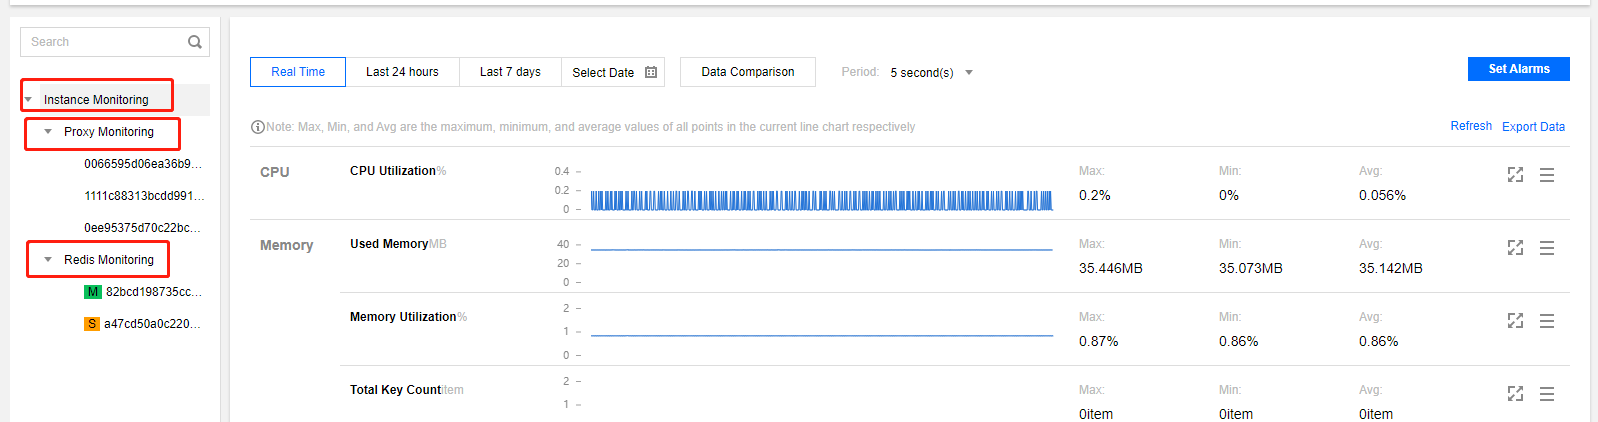
TencentDB for Redis provides comprehensive and transparent monitoring services. The new version, which supports 5-second monitoring granularity, includes Proxy node monitoring, Redis node monitoring, and instance monitoring overview, as detailed below:
Proxy node monitoring: Provides monitoring information of all Proxy nodes in an instance. TencentDB for Redis instances in standard or cluster architecture have Proxy nodes.
Redis node monitoring: Provides monitoring information of master and replica Redis nodes.
Instance monitoring: Instance monitoring aggregates monitoring data for the entire instance, including monitoring data for Proxy nodes and Redis nodes, aggregated using SUM, AVG, MAX, LAST, and other aggregation algorithms.
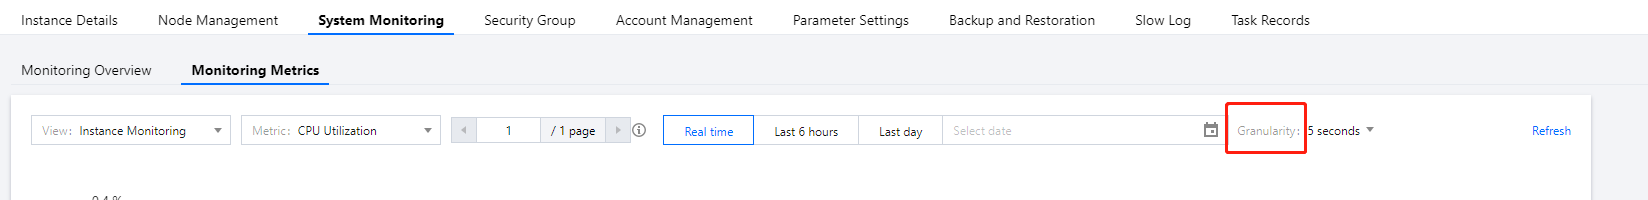
Viewing the Instance Monitoring Granularity
Log in to the TencentDB for Redis console, click an Instance ID to enter the Instance Management page, then select System Monitoring > Monitoring Metrics, and click the Period drop-down list at the top. If you can select 5 seconds from the drop-down list, it indicates that this instance supports the monitoring granularity of 5 seconds. TencentDB for Redis currently supports monitoring metrics at the 5-second, 1-minute, 5-minute, 1-hour, or 1-day granularity. For the retention period of monitoring data at each granularity, see Use Limits.
Check the value of the InstanceSet.MonitorVersion field returned by the DescribeInstances API. If the value is 5s, this instance supports the monitoring granularity of 5 seconds; if the value is 1m, it supports the monitoring granularity of 1 minute.
Viewing the Monitoring Data
You can view TencentDB for Redis monitoring information through the Redis instance list, the Redis system monitoring page, and the Cloud Monitor console.
2. Above the Instance List on the right, select the region.
3. In the Instance List, find the target instance.
4. Click the Instance ID in blue font to enter the Instance Details page. Then, click the System Monitoring tab and select the Monitoring Metrics tab to view the monitoring data.
Viewing the Monitoring Data in CM
Log in to the CM console to view the monitoring data overview.
Monitoring Metric Description
Proxy Node Monitoring
Each TencentDB for Redis instance contains at least 3 Proxy nodes. Generally, the number of Proxy nodes is 1.5 times that of Redis nodes. The Proxy node supports the following monitoring metrics:
Group
Metric
Parameter
Unit
Description
CPU
CPU Utilization
cpu_util
%
CPU utilization of the proxy
Request
Total Requests
proxy_commands
Count/s
The number of commands executed by the Proxy per second
Key Requests
cmd_key_count
Count/s
The number of keys accessed by a command per second
Mget Requests
cmd_mget
Count/s
The number of MGET commands executed per second
Execution Errors
cmd_err
Count/s
The number of command execution errors in the proxy, such as unexisting command, incorrect parameters, and so forth.
Big Value Requests
cmd_big_value
Count/s
The number of executions for requests larger than 32 KB per second
Network monitoring
Connections
connections
Count
The number of TCP connections connected to the instance
Connection Utilization
connections_util
%
The ratio of the number of TCP connections to the maximum number of connections
Max Connections Utilization of Node
connections_max_util
%
The maximum value of the connection utilization ratio of all Proxy nodes, where the connection utilization ratio is calculated as the current number of connections on a node divided by the maximum number of connections on that node.
Inbound Traffic
in_flow
MB/s
Private network inbound traffic
Inbound Traffic Utilization
in_bandwidth_util
%
The ratio of actual utilization to the maximum traffic of private inbound traffic.
Inbound Traffic Limit Count
in_flow_limit
Count
The number of times inbound traffic triggers a traffic limit
Outbound Traffic
out_flow
MB/s
Private network outbound traffic
Outbound Traffic Utilization
out_bandwidth_util
%
The ratio of actual utilization to the maximum traffic of private outbound traffic.
Outbound Traffic Limit Count
out_flow_limit
Count
The number of times outbound traffic triggers a traffic limit
Latency monitoring
Average Execution Latency
latency_avg
ms
The average execution latency between the Proxy and the Redis server
Max Execution Latency
latency_max
ms
The maximum execution latency between the Proxy and the Redis server
Average Read Latency
latency_read
ms
The average execution latency of read commands between the proxy and the Redis server. For more information on read command types, see Command types.
Average Write Latency
latency_write
ms
The average execution latency of write commands between the proxy and the Redis server. For more information on write command types, see Command types.
Average Latency of Other Commands
latency_other
ms
The average execution latency of commands (excluding write and read commands) between the proxy and the Redis server.
Redis Node Monitoring
The Redis node monitoring provides monitoring information of all master nodes and secondary nodes in an instance or a cluster. The following monitoring metrics are supported:
Group
Metric
Parameter
Unit
Description
CPU monitoring
CPU Utilization
cpu_util
%
Average CPU utilization
Network
Connections
connections
Count
The number of connections between the Proxy and a node
Connection Utilization
connections_util
%
The connection utilization of the node
Memory monitoring
Memory usage
mem_used
MB
The amount of memory actually used by the user, including data and caches
Memory Utilization
mem_util
%
The ratio of the actually used memory to the requested total memory
Total Keys
keys
Count
The total number of keys (Primary Keys) stored in the instance
Expired Keys
expired
Count
The number of keys expired within a time window, which is equal to the value of expired_keys output by the info command.
Evicted Keys
evicted
Count
The number of keys evicted within a time window, which is equal to the value of evicted_keys output by the info command.
Keys with Expiry Time Set
expires
Count
Number of Keys with Expiry Time Set in the Instance (Primary Key)
Replication Delay
repl_delay
Byte
The relative command delay length of the secondary node to the primary node.
Request monitoring
Total Requests
commands
Count/s
QPS
Read Requests
cmd_read
Count/s
The number of read command executions per second. For more information on read command types, see Command types.
Write Requests
cmd_write
Count/s
The number of write command executions per second. For more information on write command types, see Command types.
Other Requests
cmd_other
Count/s
The number of command (excluding write and read commands) executions per second
Response monitoring
Slow Logs
cmd_slow
Count
The number of command executions with a latency greater than the slowlog-log-slower-than configured
Read Request Hits
cmd_hits
Count
The number of keys successfully requested by read commands, which is equal to the value of the keyspace_hits metric output by the info command.
Read Request Misses
cmd_miss
Count
The number of keys unsuccessfully requested by read commands, which is equal to the value of the keyspace_misses metric output by the info command.
Read Request Hit Rate
cmd_hits_ratio
%
Key hits/(Key hits + Key misses). This metric can reflect the situation of Cache Miss.
Redis Instance Monitoring
The instance monitoring includes all monitoring data of an instance, including the monitoring data of Proxy nodes and Redis nodes, which is aggregated by the SUM, AVG, MAX, and LAST algorithms.
Group
Metric
Associated View
Parameter
Unit
Description
CPU monitoring
CPU Utilization
Redis node
cpu_util
%
Average CPU utilization
Max CPU Utilization of Node
Redis node
cpu_max_util
%
The maximum CPU utilization of a node (shard or replica) in an instance
Memory monitoring
Memory usage
Redis node
mem_used
MB
The amount of memory actually used by the user, including data and caches
Memory Utilization
Redis node
mem_util
%
The ratio of the actually used memory to the requested total memory
Max Memory Utilization of Node
Redis node
mem_max_util
%
The maximum among all node (shard or replica) memory utilizations in an instance
Total Keys
Redis node
keys
Count
The total number of keys (Primary Keys) in instance storage
Expired Keys
Redis node
expired
Count
The number of keys expired within a time window, which is equal to the value of expired_keys output by the info command.
Evicted Keys
Redis node
evicted
Count
The number of keys evicted within a time window, which is equal to the value of evicted_keys output by the info command.
Keys with Expiry Time Set
Redis node
expires
Count
Number of Keys with Expiry Time Set in the Instance (Primary Keys)
Network monitoring
Connections
Proxy node
connections
Count
The number of TCP connections connected to an instance
Connection Utilization
Proxy node
connections_util
%
The ratio of the number of TCP connections to the maximum number of connections
Inbound Traffic
Proxy node
in_flow
MB/s
Private network inbound traffic
Inbound Traffic Utilization
Proxy node
in_bandwidth_util
%
The ratio of actual utilization to the maximum traffic of private inbound traffic
Inbound Traffic Limit Count
Proxy node
in_flow_limit
Count
The number of times inbound traffic triggers a traffic limit
Outbound Traffic
Proxy node
out_flow
MB/s
Private network outbound traffic
Outbound Traffic Utilization
Proxy node
out_bandwidth_util
%
The ratio of the actual utilization to the maximum traffic of private outbound traffic
Outbound Traffic Limit Count
Proxy node
out_flow_limit
Count
The number of times outbound traffic triggers a traffic limit
Average Execution Latency
Proxy node
latency_avg
ms
The average execution latency between the proxy and the Redis server
Max Execution Latency
Proxy node
latency_max
ms
The maximum execution latency between the proxy and the Redis server
Average Read Latency
Proxy node
latency_read
ms
The average execution latency of read commands between the proxy and the Redis server. For more information on read command types, see Command types.
Average Write Latency
Proxy node
latency_write
ms
The average execution latency of write commands between the proxy and the Redis server. For more information on write command types, see Command types.
Average Latency of Other Commands
Proxy node
latency_other
ms
The average execution latency of commands (excluding write and read commands) between the proxy and the Redis server.
Request monitoring
Total Requests
Redis node
commands
Count/s
QPS
Read Requests
Redis node
cmd_read
Count/s
The number of read command executions per second. For more information on read command types, see Command types.
Write Requests
Redis node
cmd_write
Count/s
The number of write command executions per second. For more information on write command types, see Command types.
Other Requests
Redis node
cmd_other
Count/s
The number of command (excluding write and read commands) executions per second
Big Value Requests
Proxy node
cmd_big_value
Count/s
The number of executions for requests larger than 32 KB per second
Key Requests
Proxy node
cmd_key_count
Count/s
The number of keys accessed by a command per second
Mget Requests
Proxy node
cmd_mget
Count/s
The number of MGET commands executed per second
Slow Logs
Redis node
cmd_slow
Count
The number of command executions with a latency greater than the slowlog-log-slower-than configured
Read Request Hits
Redis node
cmd_hits
Count
The number of keys successfully requested by read commands, which is equal to the value of the keyspace_hits metric output by the info command.
Read Request Misses
Redis node
cmd_miss
Count
The number of keys unsuccessfully requested by read commands, which is equal to the value of the keyspace_misses metric output by the info command.
Execution Errors
Proxy node
cmd_err
Count/s
The number of command execution errors. For example, the command does not exist, parameters are incorrect, etc.
Read Request Hit Rate
Redis node
cmd_hits_ratio
%
Key hits/(key hits + key misses). This metric can reflect the situation of Cache Miss.
In scenarios such as node failover, instance capacity expansion/reduction, or data migration, the node IDs for Proxy and Redis may change. Therefore, it is necessary to promptly obtain the latest node information from the API interface.


 Yes
Yes
 No
No
Was this page helpful?