- Release Notes
- Product Introduction
- Getting Started
- Console Guide
- Product Management
- Rule Engine
- Overview
- Data Processing
- Rule Function
- Data Forwarding to Another Topic
- Data Forwarding to Third-Party Service
- Data Forwarding to CKafka
- Data Forwarding to TDMQ
- Data Forwarding to CTSDB
- Data Forwarding to TencentDB for MySQL
- Data Forwarding to TencentDB for MongoDB
- Data Forwarding to Tencent CloudBase
- Data Forwarding to TDSQL for MySQL
- Sub-account Access to IoT Hub
- Firmware Upgrade
- Resource Management
- Certificate Management
- Developer Manual
- API Documentation
- Device Connection Manual
- FAQs
- IoT Hub Policy
- Glossary
IoT Hub provides monitoring capabilities for the device connection, message sending/receiving, device shadow, rule engine, and OTA features. You can view the monitoring data in the last 30 days on the Status Monitoring page in the IoT Hub console, which helps you identify and troubleshoot business issues.
Status Monitoring Types
Currently, IoT Hub provides the following five types of monitoring statistics.
Device connection statistics
Device connection statistics are used to monitor device connection.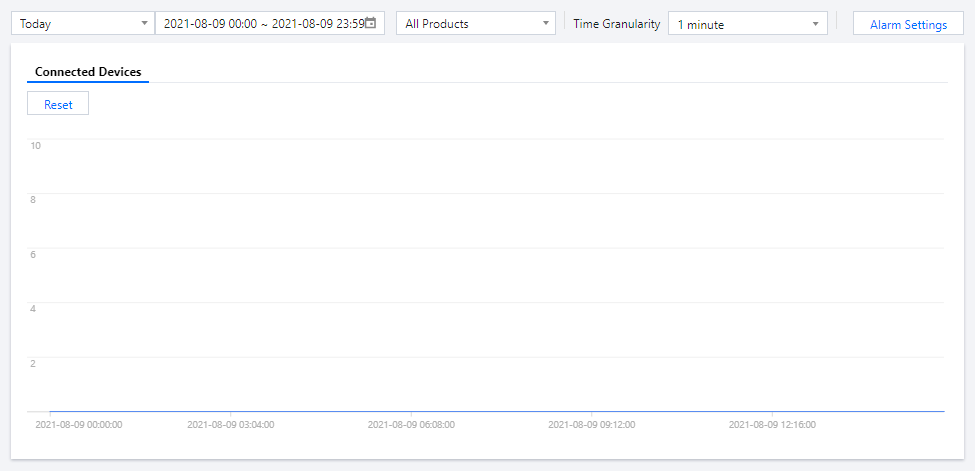
Device message statistics
Device message statistics include the numbers of sent and received messages, failed messages, and billable messages.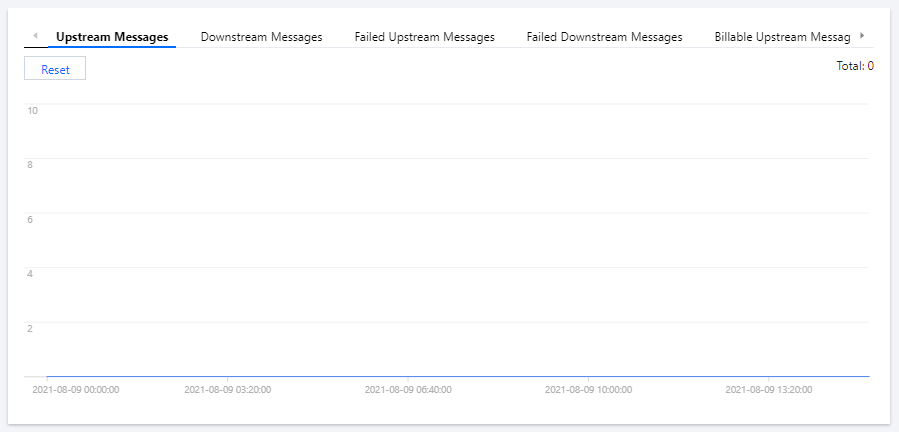
- Upstream Messages: number of messages published by the device or by the application through TencentCloud API.
- Downstream Messages: number of messages transferred to the device by IoT Hub (messages subscribed to by the device).
- Failed Upstream Messages: number of messages published by the device or by the application through TencentCloud API which failed to be published due to invalid format (such as excessive length), frequency limit, traffic limit, or lack of permission.
- Failed Downstream Messages: number of messages transferred to the device by IoT Hub (messages subscribed to by the device) which failed to be received due to invalid format (such as excessive length), frequency limit, or traffic limit.
- Billable Upstream Messages: number of messages published by the device or by the application through TencentCloud API which are converted according to the billing standards (message content length divided by 512 bytes and rounded up).
- Billable Downstream Messages: number of messages transferred to the device by IoT Hub (messages subscribed to by the device) which are converted according to the billing standards (message content length divided by 512 bytes and rounded up).
Device shadow update statistics
Device shadow update statistics include the numbers of active device shadow updates and failed updates.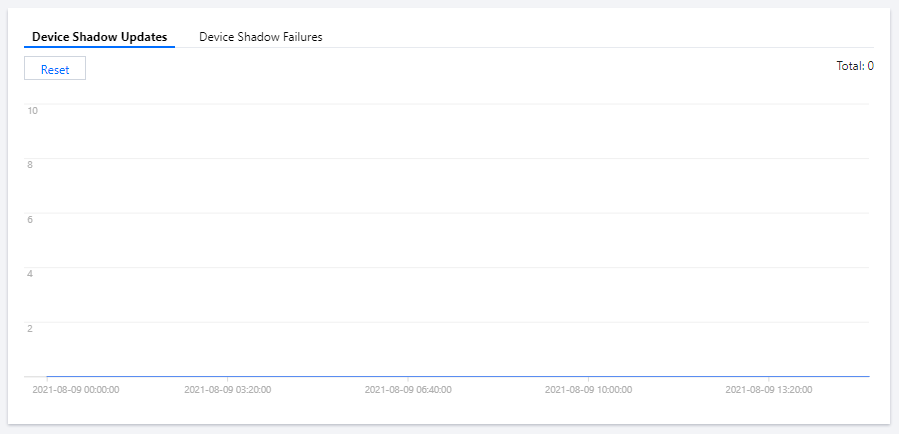
Rule engine statistics
Rule engine statistics include the numbers of times messages hit the rule engine and messages are forwarded to other services.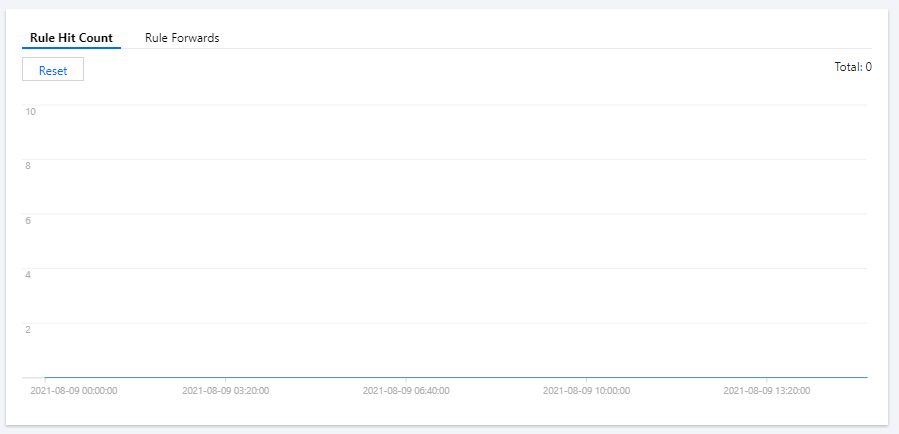
Firmware statistics
Firmware statistics include device version distribution and firmware version capacity statistics.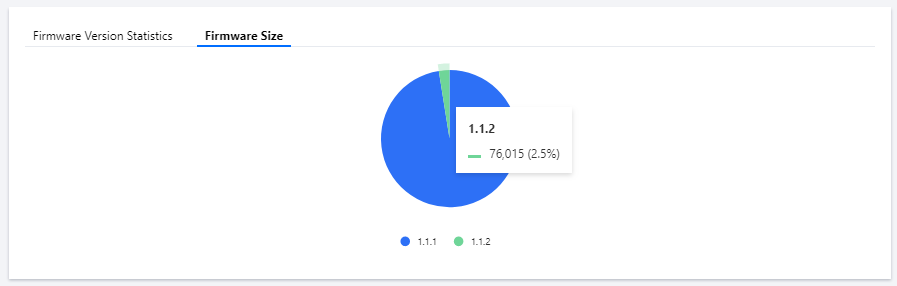
Product-Level Monitoring
Status monitoring supports not only global monitoring but also product-level monitoring. You can search for desired product data by product name.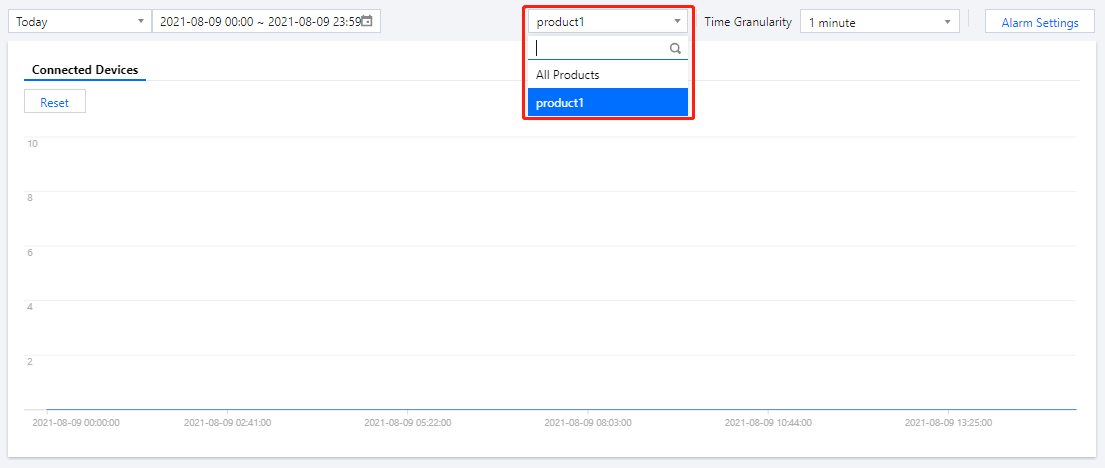
Note:You can view the firmware statistics only after specifying a product.
Search by Time
For status monitoring, you can select a time range to view data, including the last day, last 7 days, last 15 days, last 30 days, and custom time range.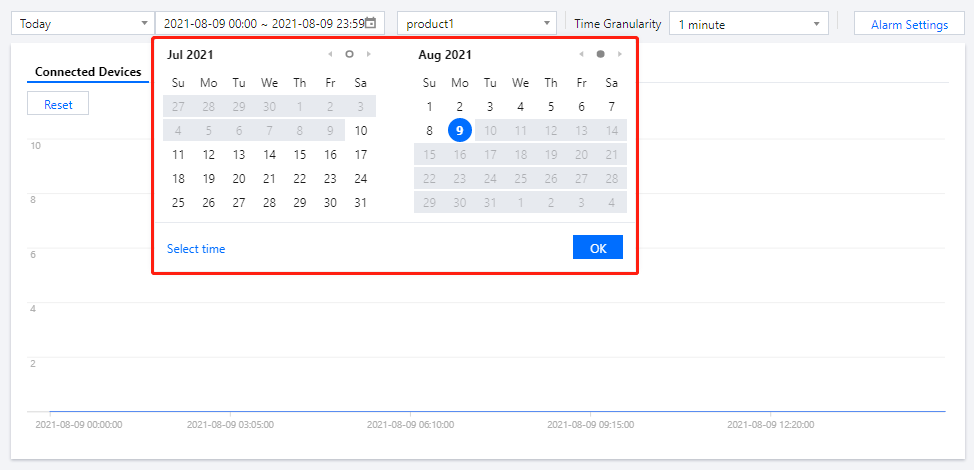
Data Point at Selected Time Granularity
In status monitoring, each displayed point is counted based on the selected time granularity. For the number of connected devices, the value displayed by a single point is the peak value over the selected time granularity. For other types, the value displayed by a single point is the sum calculated for the selected time granularity.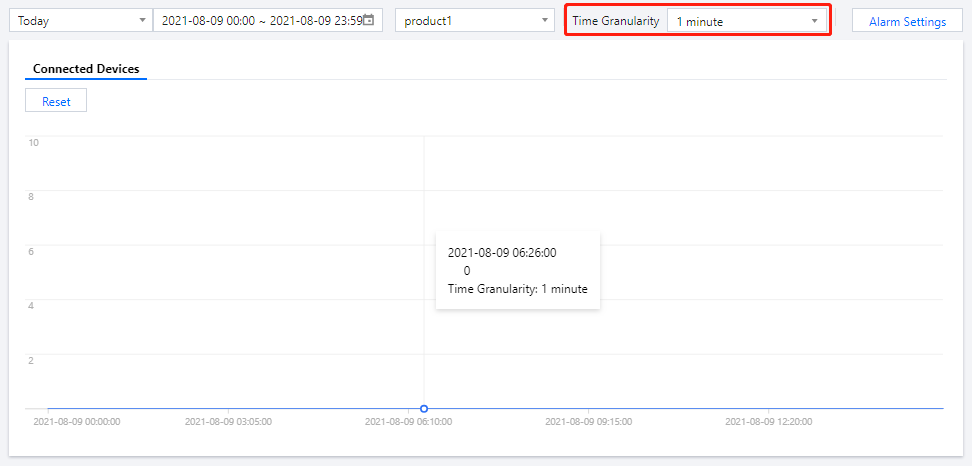
Zoom and Aggregation
The monitoring sequence diagram also supports zoom and aggregation. You can select a start time on it, hold down the mouse button, and drag the cursor to the position of the desired end time to view the monitoring data in the time period.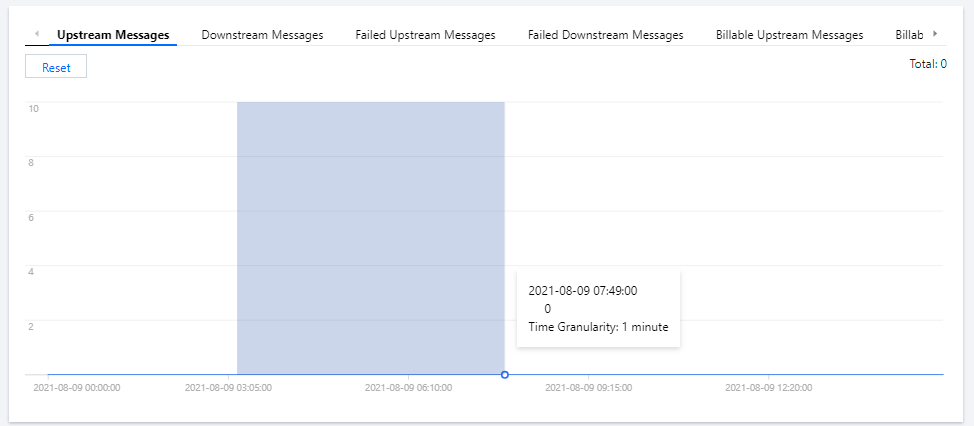
The aggregation feature sums the total number in the corresponding data type on the displayed timeline by default and displays it in the top-right corner of the statistics page.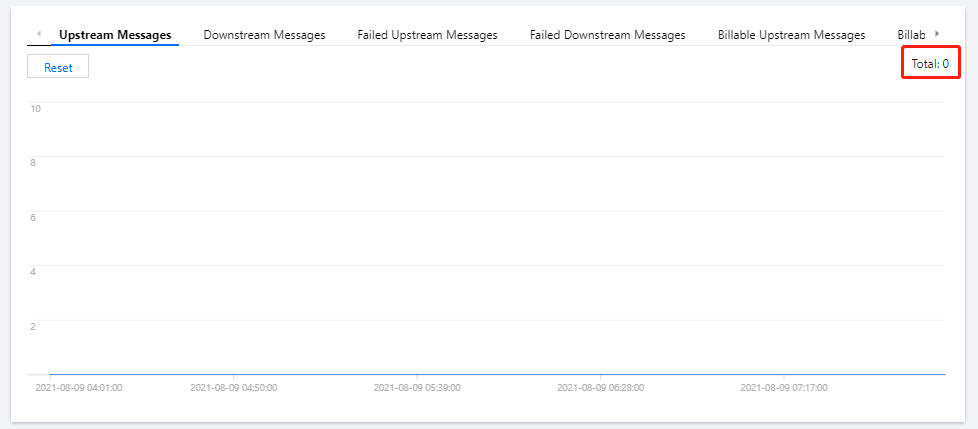
You can click Reset to reset the page zoom.
Monitoring and Alarming
Status monitoring allows you to configure alarms in Cloud Monitor in order to monitor the numbers of connected devices, upstream and downstream messages, and failed upstream and downstream messages. When an alarm is triggered, alarm messages will be sent to the specified recipients by SMS, email, or WeChat, so that they can promptly take actions accordingly.
Creating alarm policy
IoT Hub supports setting alarms for the following metrics:
- Connected Devices
- Upstream Messages
- Downstream Messages
- Failed Upstream Messages
- Failed Downstream Messages
- Device Shadow Updates
- Device Shadow Failures
- Rule Hit Count
- Rule Forwards
Directions
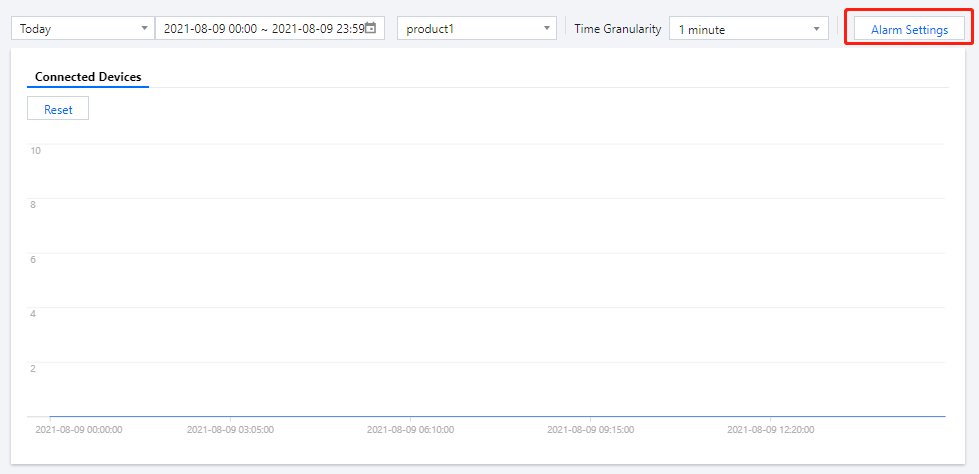
- Log in to the IoT Hub console, enter the Status Monitoring page, and click Alarm Settings in the top-right corner of the page to enter the alarm settings page.
- On the alarm policy page, click Create to enter the policy creation page and set the alarm policy parameters.
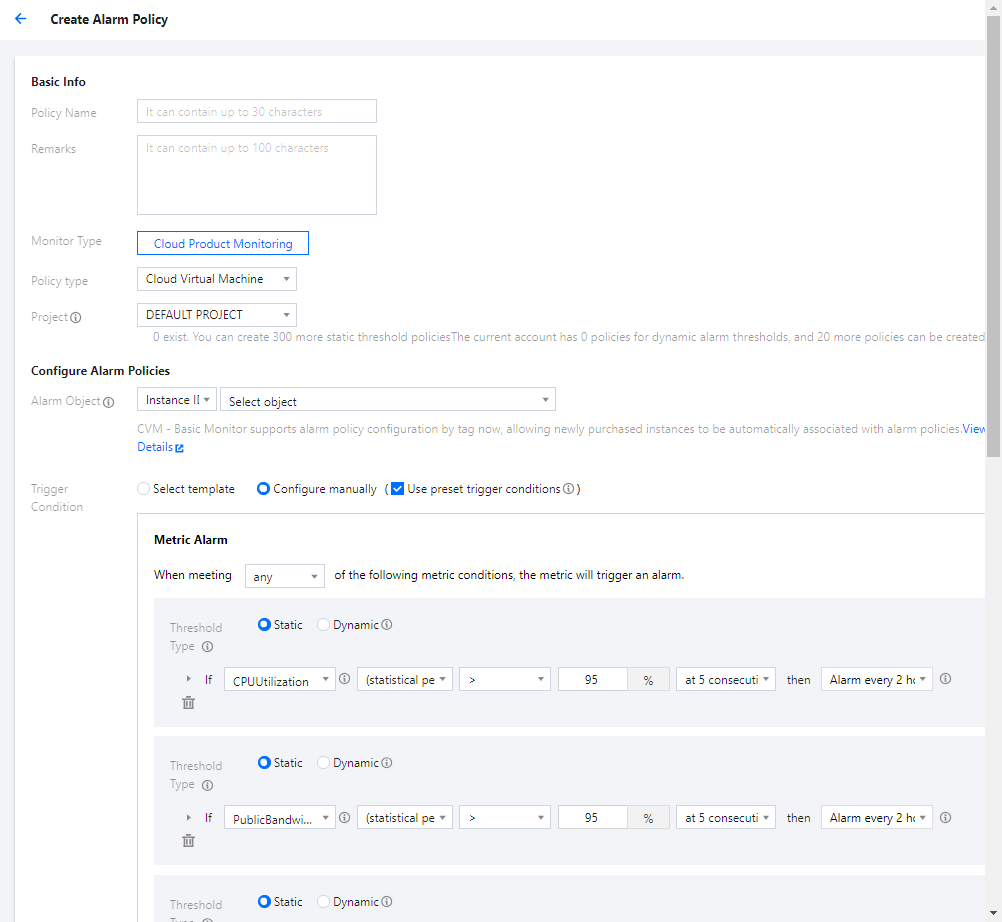
- Policy Name: it can contain letters and underscores.
- Remarks: it describes the alarm policy and can contain letters and underscores.
- Policy Type: it is the corresponding alarm policy type of the product. IoT Hub > Status Monitoring is selected here.
- Project: it is the project of the alarm policy. The default project is selected here.
- Alarm Object: it can be All objects, Certain objects, or Instance group.
- All objects means all product objects in IoT Hub. When any product in IoT Hub hits the alarm condition, an alarm notification will be sent.
- Certain objects means the selected product objects. When a selected product object hits the alarm condition, an alarm notification will be sent.
- Instance group means the product objects included in the instance group. When an object in the instance group hits the alarm condition, an alarm notification will be sent.
- Trigger Condition: you can either select a trigger condition template or configure a trigger condition. For more information, please see Creating Alarm Policy. Trigger conditions that can be set include the following:
- You can set the alarm to be triggered when meeting any condition or all conditions.
- You can set the categories for monitoring according to the status types supported by IoT Hub.
- You can set the statistical period and number of consecutive periods for the policy.
- You can set the comparison relationship in the alarm policy.
- You can set an alarm threshold.
- You can set a notification policy. This way, an alarm notification will be sent repeatedly at a specified frequency when an alarm is triggered. Frequency options: do not repeat, once every 5 minutes, once every 10 minutes, at an exponentially increasing interval, and other frequency options. An exponentially increasing interval means that a notification is sent when an alarm is triggered the first time, second time, fourth time, eighth time, and so on. In other words, the alarm notification will be sent less and less frequently as time goes on to reduce the disturbance caused by repeated notifications.
Note:The default logic for repeated alarm notifications is as follows:
- The alarm notification will be sent to you at the configured frequency for 24 hours after an alarm is triggered.
- Following 24 hours after an alarm is triggered, the alarm notification will be sent once every day by default.
- The alarm notification will be sent for the last time 72 hours after the alarm is triggered and then will no longer be sent.
Sample trigger condition: set the following: the alarm is triggered when meeting all conditions; the monitored category is the number of connected devices; the statistical period is 1 minute for 5 consecutive periods; the comparison relationship is "greater than"; the alarm threshold is 100; and the notification policy is to send notifications once every day. Then, the number of connected devices will be determined once every minute, and an alarm will be triggered when the number of connected devices in the product object is found to be greater than 100 for 6 consecutive times.
- Alarm Channel: you can set the recipients and the time periods, channels, and languages for receiving alarm notifications.
- Advanced Feature: after it is enabled, an auto scaling policy can be triggered when the alarm conditions are met.
- API Callback: alarm messages can be pushed to this address when the alarm conditions are met.
- Click Save.

 Yes
Yes
 No
No
Was this page helpful?