- Release Notes and Announcements
- Product Introduction
- Purchase Guide
- Quick Start
- Cloud Product Monitoring
- Tencent Cloud Service Metrics
- CVM
- CBS
- TencentDB
- TencentDB for SQL Server Monitoring Metrics
- TencentDB for MySQL Monitoring Metrics
- TencentDB for Redis Monitoring Metrics
- TencentDB for MongoDB Monitoring Metrics
- TencentDB for PostgreSQL Monitoring Metrics
- TDSQL-C for MySQL Monitoring Metrics
- TencentDB for TcaplusDB Monitoring Metrics
- TencentDB for MariaDB Monitoring Metrics
- TDSQL for MySQL Monitoring Metrics (Legacy)
- TDSQL for MySQL Monitoring Metrics
- SCF
- CKafka
- TDMQ
- VPC
- NAT Gateway Monitoring Metrics
- VPN Gateway Monitoring Metrics
- VPN Tunnel Monitoring Metrics
- Direct Connect Gateway Monitoring Metrics
- CCN Monitoring Metrics
- Peering Connection Monitoring Metrics
- Bandwidth Packet Monitoring Metrics
- EIP Monitoring Metrics
- Anycast EIP Monitoring Metrics
- Network Detection Monitoring Metrics
- CLB
- COS
- CFS
- CPM
- ECM
- EMR
- CDN
- Edge Security Acceleration Platform EdgeOne
- Direct Connect
- TKE
- GAAP
- CMQ
- API Gateway
- Elasticsearch
- WAF
- CLS
- Tencent Cloud Service Metrics
- Operation Guide
- Prometheus Monitoring
- Mobile App Performance Monitoring
- Best Practice
- API Documentation
- History
- Introduction
- API Category
- Making API Requests
- Monitoring Data Query APIs
- Alarm APIs
- DescribeAlarmHistories
- CreateAlarmPolicy
- DeleteAlarmPolicy
- DescribeAlarmPolicies
- DescribeAlarmPolicy
- ModifyAlarmPolicyStatus
- SetDefaultAlarmPolicy
- BindingPolicyObject
- UnBindingPolicyObject
- UnBindingAllPolicyObject
- ModifyAlarmPolicyCondition
- ModifyAlarmPolicyNotice
- ModifyAlarmPolicyTasks
- DescribeMonitorTypes
- DescribeAllNamespaces
- DescribeAlarmMetrics
- DescribeAlarmEvents
- DescribeBindingPolicyObjectList
- ModifyAlarmPolicyInfo
- DescribeConditionsTemplateList
- Legacy Alert APIs
- Notification Template APIs
- Prometheus Service APIs
- DescribePrometheusInstanceUsage
- DescribeServiceDiscovery
- CreateServiceDiscovery
- UpdateAlertRuleState
- UpdateAlertRule
- DescribeAlertRules
- DeleteAlertRules
- CreateAlertRule
- DescribePrometheusInstances
- UpgradeGrafanaDashboard
- UpdatePrometheusScrapeJob
- UpdatePrometheusAgentStatus
- UpdateExporterIntegration
- UninstallGrafanaDashboard
- UnbindPrometheusManagedGrafana
- TerminatePrometheusInstances
- ModifyPrometheusInstanceAttributes
- GetPrometheusAgentManagementCommand
- DestroyPrometheusInstance
- DescribePrometheusScrapeJobs
- DescribePrometheusAgents
- DescribeExporterIntegrations
- DeletePrometheusScrapeJobs
- DeleteExporterIntegration
- CreatePrometheusScrapeJob
- CreatePrometheusAgent
- CreateExporterIntegration
- BindPrometheusManagedGrafana
- UpdateRecordingRule
- DescribeRecordingRules
- DeleteRecordingRules
- CreateRecordingRule
- CreatePrometheusMultiTenantInstancePostPayMode
- DescribePrometheusZones
- Grafana Service APIs
- UpgradeGrafanaInstance
- UpdateSSOAccount
- UpdateGrafanaWhiteList
- UpdateGrafanaNotificationChannel
- UpdateGrafanaIntegration
- UpdateGrafanaEnvironments
- UpdateGrafanaConfig
- UpdateDNSConfig
- UninstallGrafanaPlugins
- ResumeGrafanaInstance
- ModifyGrafanaInstance
- InstallPlugins
- EnableSSOCamCheck
- EnableGrafanaSSO
- EnableGrafanaInternet
- DescribeSSOAccount
- DescribeInstalledPlugins
- DescribeGrafanaWhiteList
- DescribeGrafanaNotificationChannels
- DescribeGrafanaIntegrations
- DescribeGrafanaInstances
- DescribeGrafanaEnvironments
- DescribeGrafanaConfig
- DescribeDNSConfig
- DeleteSSOAccount
- DeleteGrafanaNotificationChannel
- DeleteGrafanaIntegration
- DeleteGrafanaInstance
- CreateSSOAccount
- CreateGrafanaNotificationChannel
- CreateGrafanaIntegration
- CreateGrafanaInstance
- CleanGrafanaInstance
- DescribeGrafanaChannels
- Event Center APIs
- TencentCloud Managed Service for Prometheus APIs
- CheckIsPrometheusNewUser
- CreatePrometheusTemp
- CreatePrometheusAlertPolicy
- CreatePrometheusClusterAgent
- CreatePrometheusGlobalNotification
- DeletePrometheusTemp
- DeletePrometheusTempSync
- DeletePrometheusAlertPolicy
- DeletePrometheusClusterAgent
- DescribePrometheusAgentInstances
- DescribePrometheusAlertPolicy
- DescribePrometheusInstanceDetail
- DescribePrometheusClusterAgents
- DescribePrometheusInstanceInitStatus
- DescribePrometheusGlobalConfig
- DescribePrometheusInstancesOverview
- DescribePrometheusGlobalNotification
- DescribePrometheusRecordRules
- DescribePrometheusTemp
- DescribePrometheusTempSync
- DescribePrometheusTargetsTMP
- ModifyPrometheusTemp
- ModifyPrometheusAgentExternalLabels
- ModifyPrometheusAlertPolicy
- ModifyPrometheusGlobalNotification
- RunPrometheusInstance
- DescribeClusterAgentCreatingProgress
- SyncPrometheusTemp
- Monitoring APIs
- Data Types
- Error Codes
- Troubleshooting
- FAQs
- Alarm Management
- Documentation Guide
- Policy
- Glossary
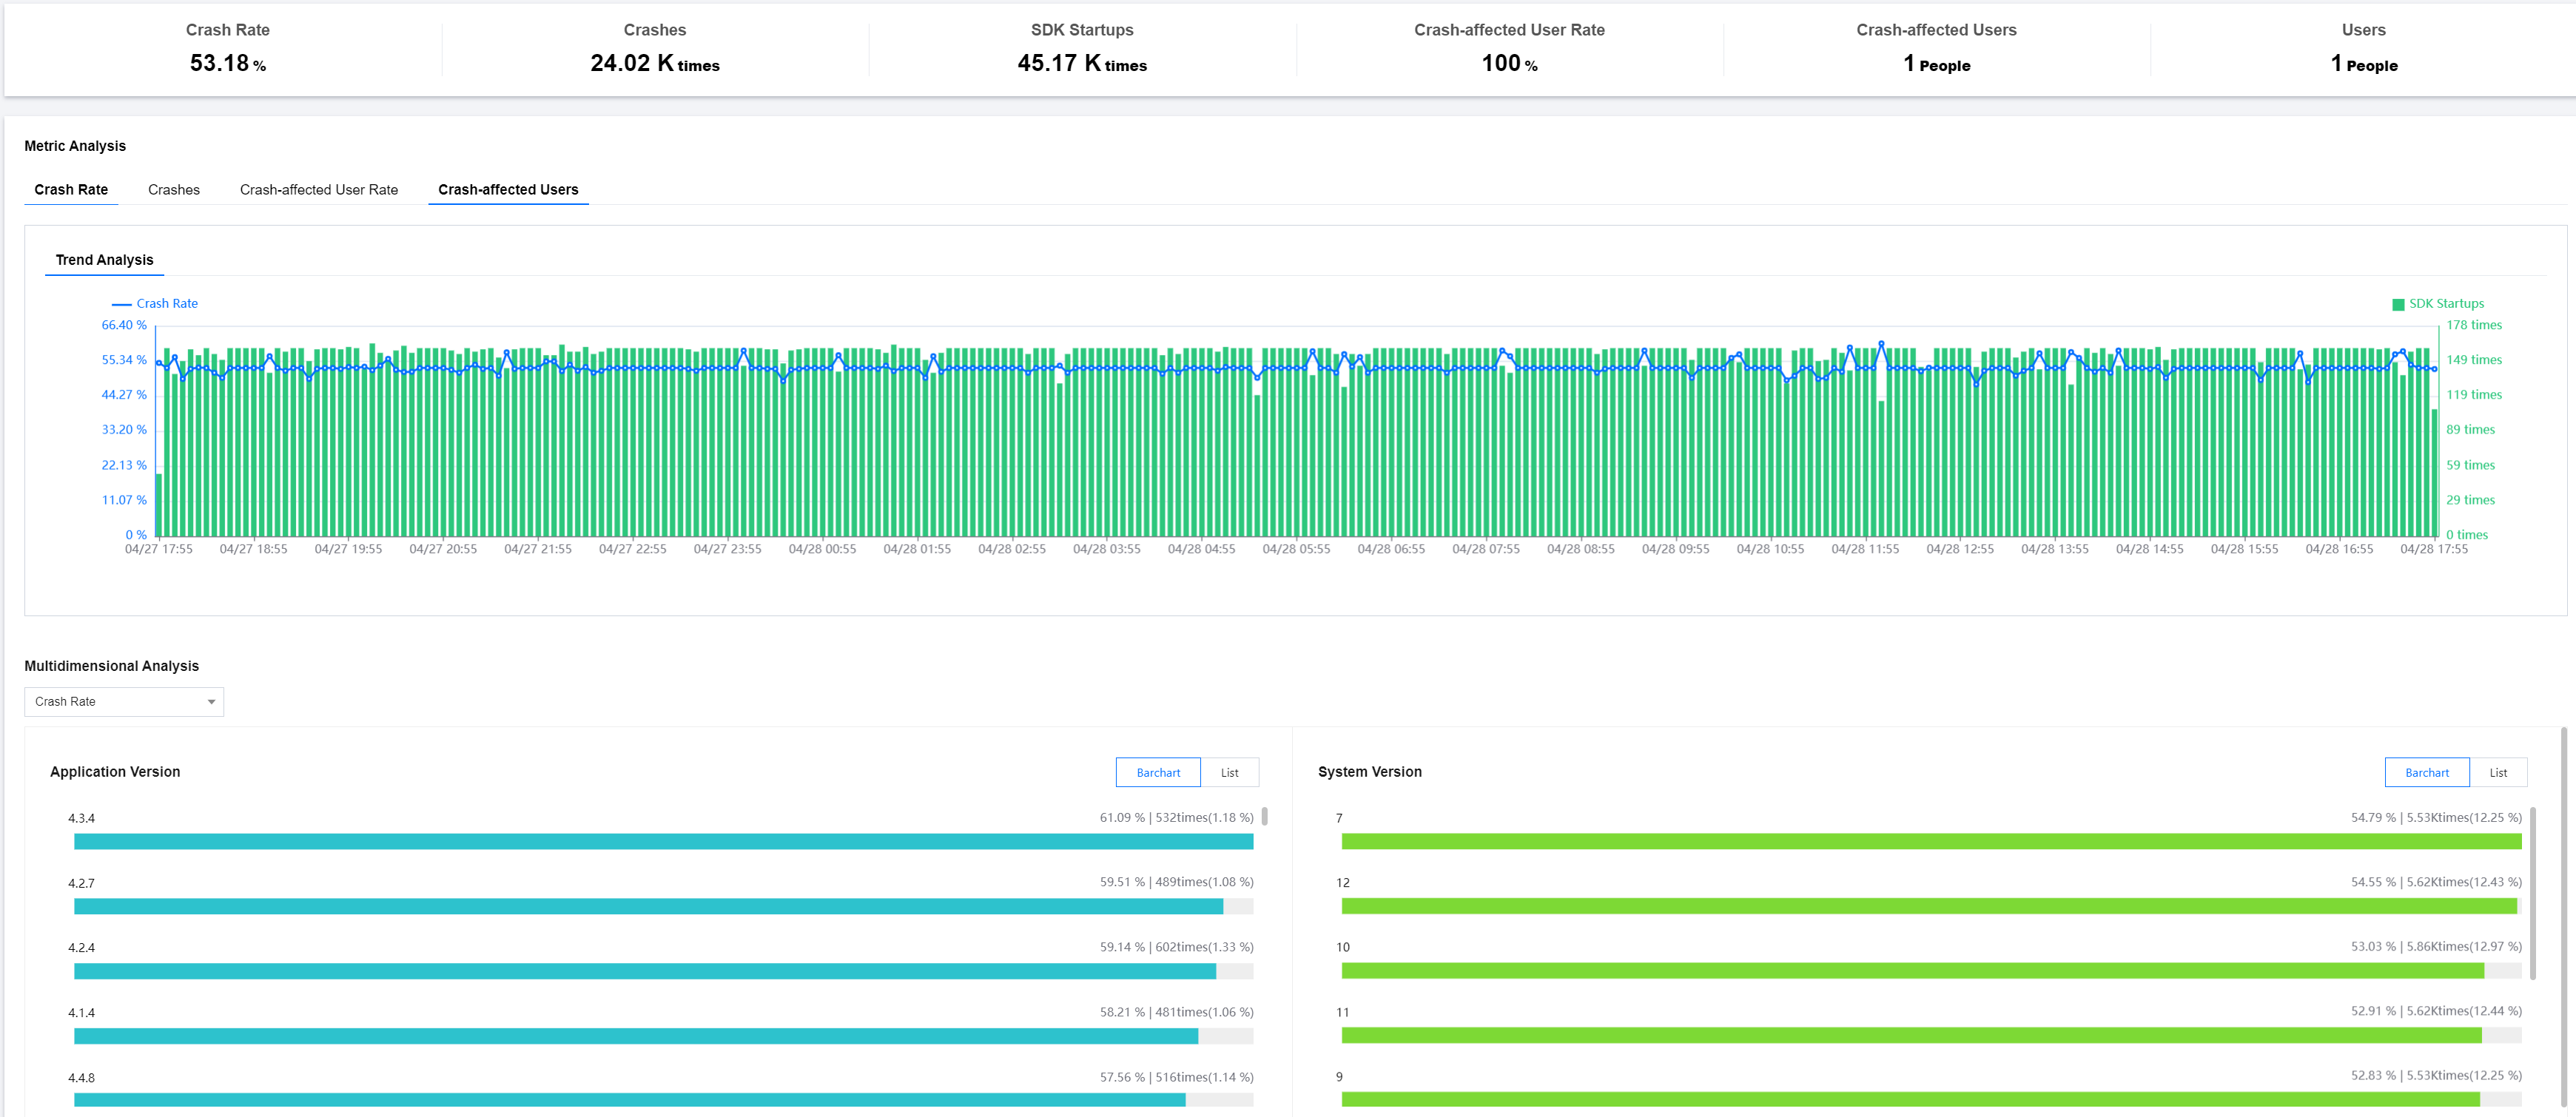
Terminal Performance Monitoring aggregates key characteristics from individual crash incidents, facilitating root cause analysis of App crashes.
Feature Entry
1. Log in to Tencent Cloud Observability Platform.
2. In the left navigation bar, select Mobile App Performance Monitoring > Crash. Select the business system, app, and time range to analyze crashes.
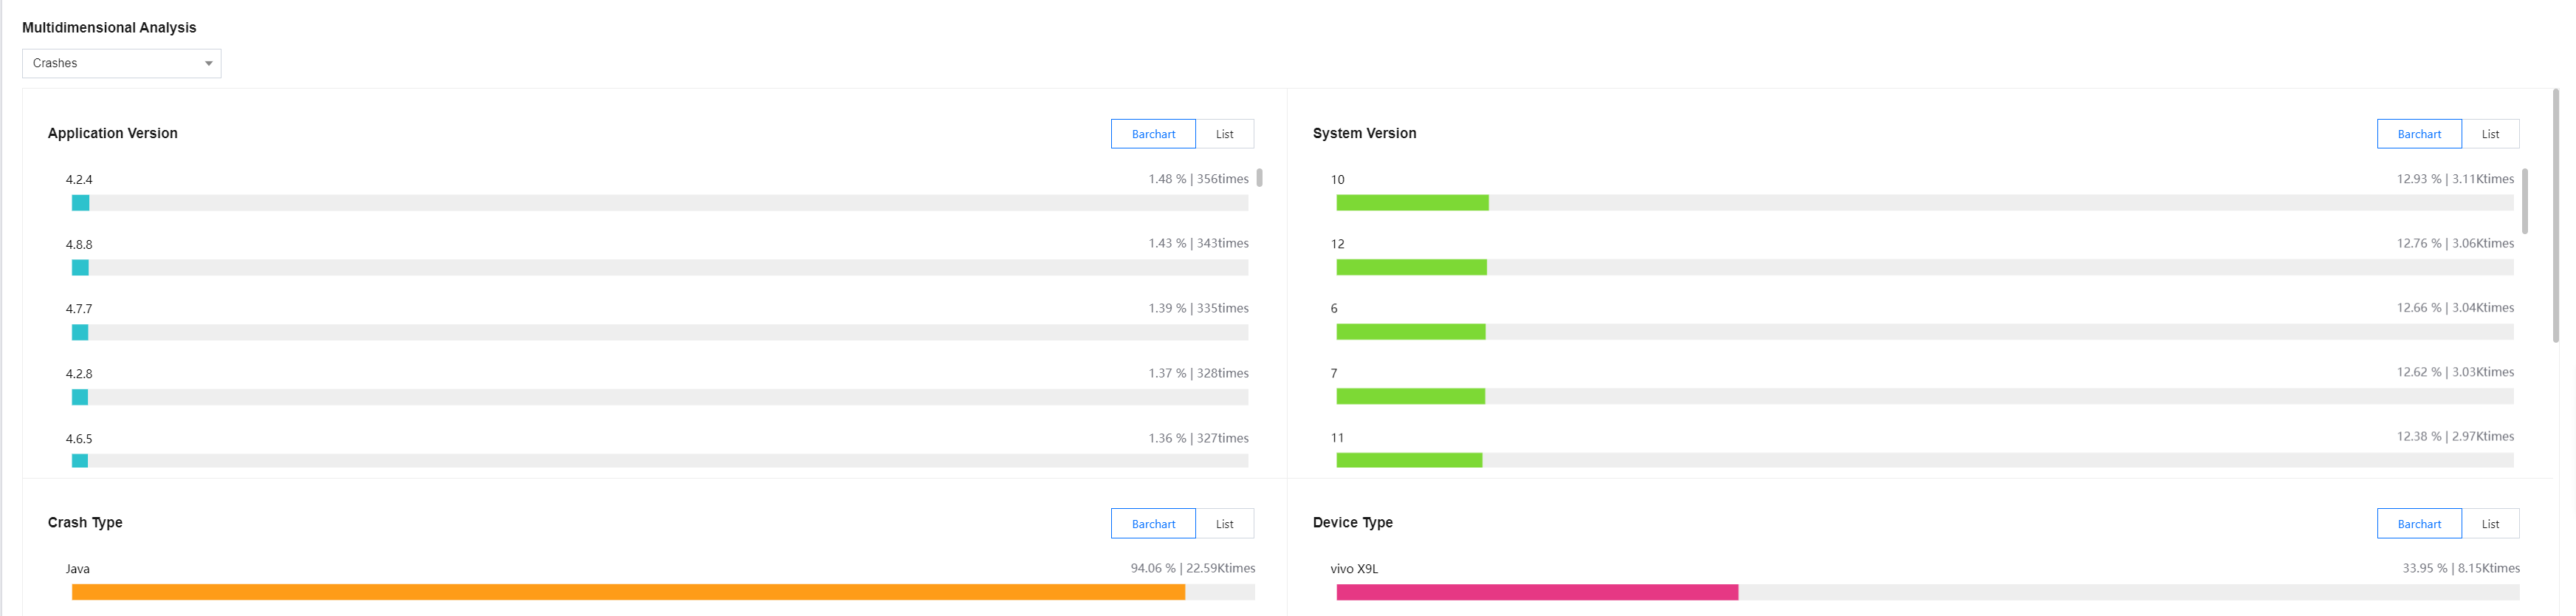
Multidimensional Analysis
The Multidimensional Analysis page shows the analysis of key metrics from multiple dimensions such as app version, system version, crash type, device type, and app status. It facilitates targeted root cause analysis of specific crash events.
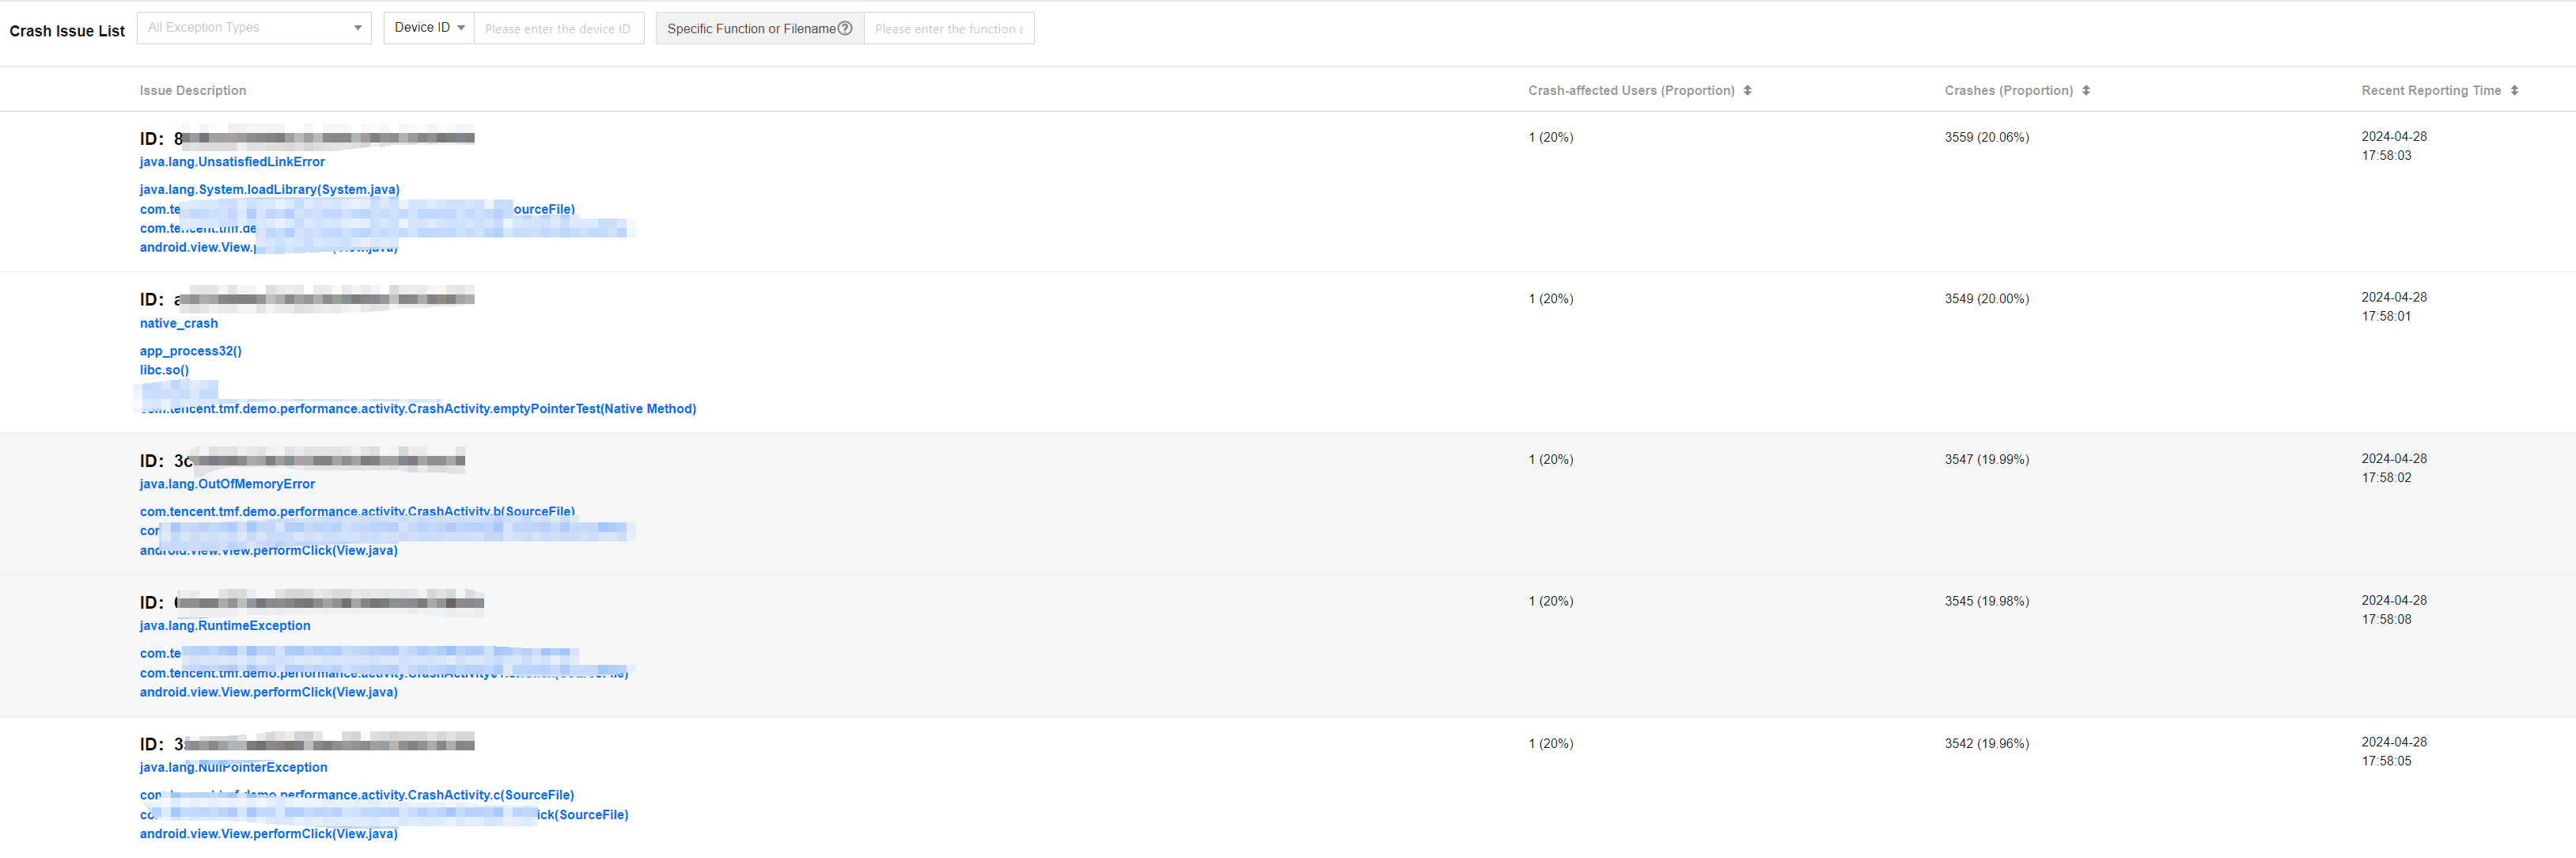
Crash Issue List
The crash issue list shows crashes of all devices. You can quickly filter crashes by error type, device ID, function, or filename. You can also click Issue Description to view the details of crashes and pinpoint the root causes of crashes.
Metrics Description
Related Metrics are as follows:
Metric Name | Metrics Description |
Crash Rate | Number of crashes/Number of app launches within a specified time range |
Crash-affected User Rate | Number of users affected by crashes/Number of users launching the app within a specified time range |
Crashes | Number of crashes within a specified time range |
Crash-affected Users | Number of users affected by crashes within a specified time range |
Crash Type | Classified into Java crashes and Native crashes based on the location of the crash occurrence |
SDK Startups | Number of app launches |

 Yes
Yes
 No
No
Was this page helpful?