To facilitate daily database Ops, DBbrain provides the TencentDB for MongoDB MongoStatus tool. This tool monitors the MongoDB status at the instance or node level by checking the traffic and storage engine in real time.
Directions
Instance-level MongoDB status
1. Log in to the DBbrain console and select Performance Optimization on the left sidebar. On the displayed page, select a database type and an instance at the top, and select the Performance Trends tab.
2. Select Instance > MongoStatus.
3. Click Pause in the top-right corner to pause and view the data.
Node-level MongoDB status
1. Log in to the DBbrain console and select Performance Optimization on the left sidebar. On the displayed page, select a database type and an instance at the top, and select the Performance Trends tab.
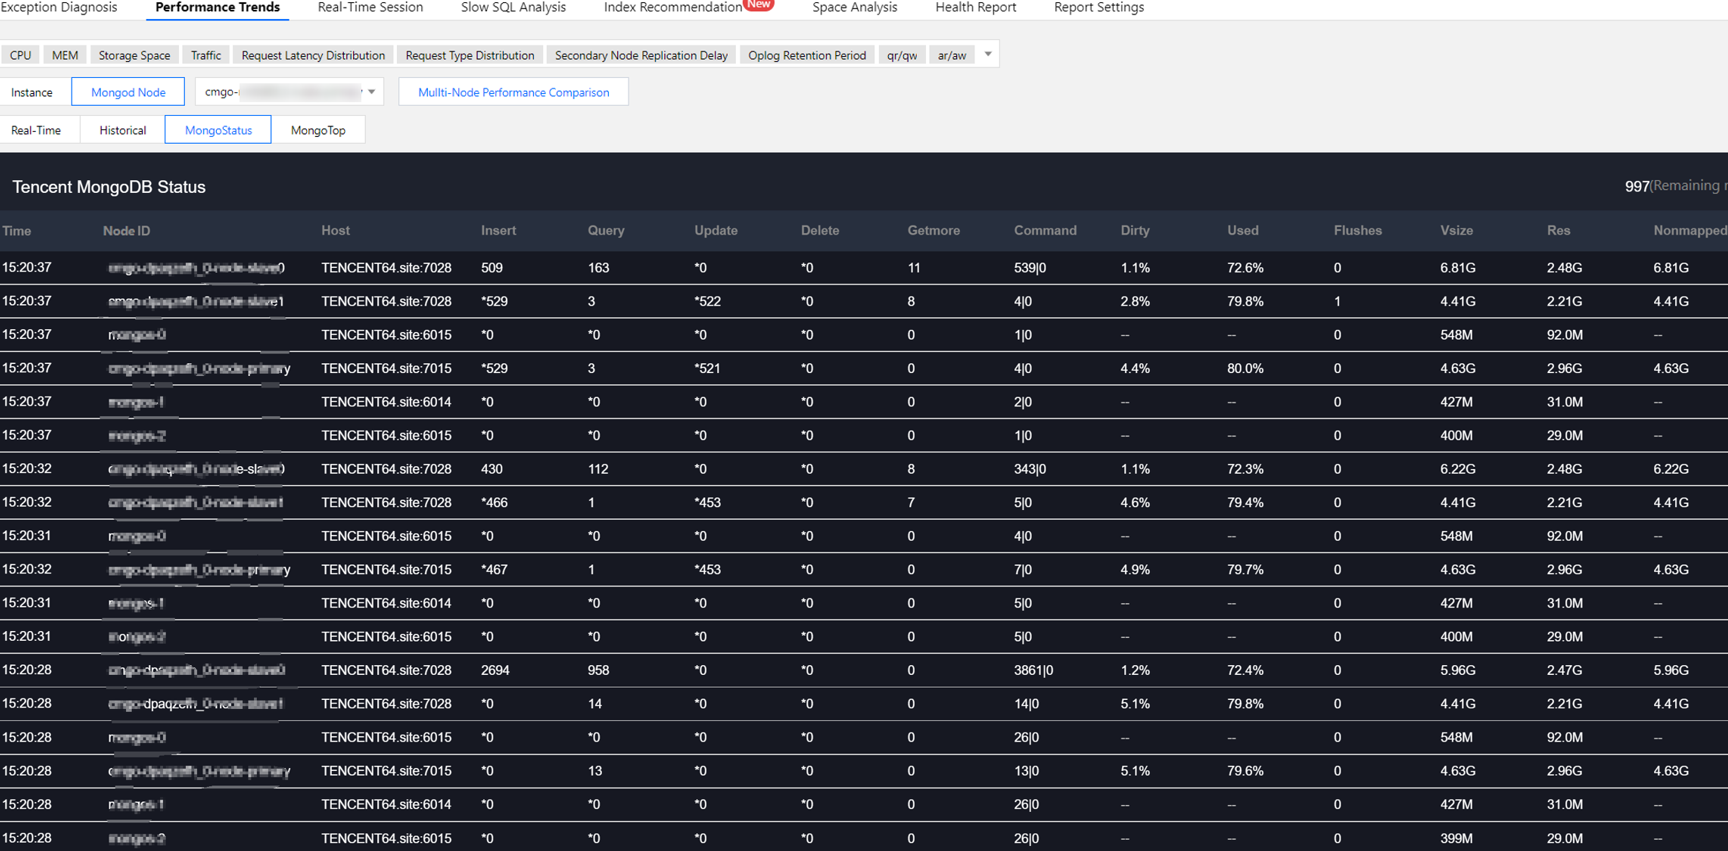
2. Select Mongod Node > MongoStatus.
3. Select a node in the drop-down list.
4. Click Pause in the top-right corner to pause and view the data.
MongoStatus monitoring metrics
MongoStatus fields are as described below:
Monitoring Field
Description
Impact on Performance and Optimization
host
Node address
-
insert
Number of insertions per second
If the value of this field stays high, you can perform optimization based on the analysis of dirty and used.
query
Number of query requests per second
Check the index and make sure that the index exists.
update
Number of updates per second
1. Check the index and make sure that the index exists.
2. 2. If the value of this field stays high, you can perform optimization based on the analysis of dirty and used.
delete
Number of deletions per second
1. Check the index and make sure that the index exists.
2. If the value of this field stays high, you can perform optimization based on the analysis of dirty and used.
getmore
Number of getMore requests per second
-
command
Number of commands per second
-
dirty
Proportion of dirty data cached in the storage engine
If the value of this field stays high (above 20% by default), we recommend you increase the value of threads_max in the storage engine.
used
Proportion of the used cache of the storage engine
If the value of this field stays high (above 95% by default), we recommend you increase the value of threads_max in the storage engine.
flushes
Number of flushes per second
-
vsize
Amount of virtual memory used by processes
-
res
Amount of resident memory used by processes
-
qrw
Information of the waiting read/write queue on the client
If the value of this field stays above 0 and the value of arw stays close to 128, requests are queuing.
arw
Information of the active read/write queue on the client

 Yes
Yes
 No
No
Was this page helpful?