During database operation, it is inevitable to encounter various slow SQL statements. In addition to viewing slow SQL statements in the system table SLOW_LOG, TDSQL-C also allows you to view slow SQL details of the instance running in the console. This document describes how to view and configure slow SQL statements of the analysis engine. Slow SQL Statement Details
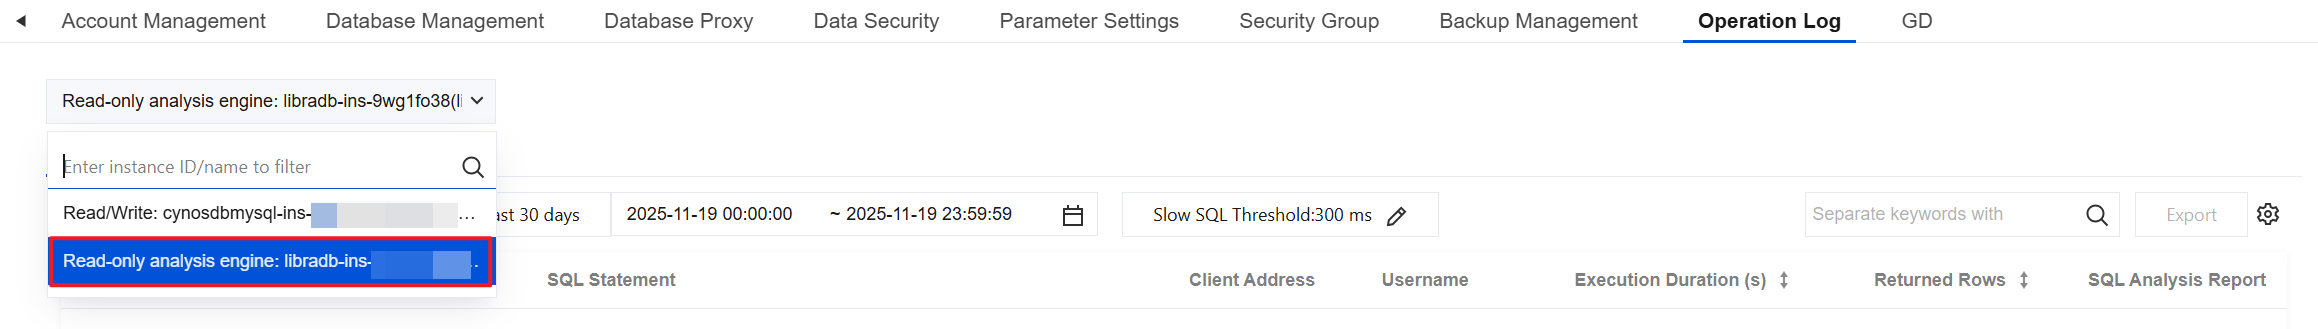
To view the slow logs of the analysis engine, go to the Cluster List and find the cluster for which you want to view slow SQL statements. On the Cluster Details page, click Operation Log, and select the read-only analysis engine from the instance drop-down list in the upper-left corner. You can view the slow log details of the read-only analysis engine in the list.
In the slow log detail list, all slow SQL information generated on the day is displayed by default. The slow logs can be stored for a maximum of 30 days.
If an SQL statement is excessively long, it will be truncated. You can specify the libra_query_log_max_len parameter to control the text length of the recorded slow SQL statement.
|
Execution Time | The time at which the current SQL statement starts to be executed. |
Node ID | The analysis engine node on which the current SQL statement is executed. |
SQL Statement | SQL text. By default, a maximum of 4 MB of SQL text can be displayed. If the SQL text exceeds the upper limit, the excess part will be truncated. However, an excessive number of large SQL statements may cause the frontend to fail to load properly. |
Client Address | The client address used to access the analysis engine. |
Username | The user who executes this SQL statement. |
Execution Duration (s) | Duration of SQL execution, in seconds. Sorting by duration is supported. |
Returned Rows | The number of data rows finally returned for the current SQL statement. |
SQL Parsing Duration (s) | This field is advanced information and is not displayed by default. You can click the settings icon in the upper-right corner to display this field. It indicates the parser time for the current SQL statement, in seconds. |
SQL Compilation Duration (s) | This field is advanced information and is not displayed by default. You can click the settings icon in the upper-right corner to display this field. It indicates the compilation time for the current SQL statement, in seconds. |
SQL Rewriting Duration (s) | This field is advanced information and is not displayed by default. You can click the settings icon in the upper-right corner to display this field. It indicates the optimizer rewriting time for the current SQL statement, in seconds. |
SQL Tuning Duration (s) | This field is advanced information and is not displayed by default. You can click the settings icon in the upper-right corner to display this field. It indicates the optimizer tuning time for the current SQL statement, in seconds. |
Soft Parsing | This field is advanced information and is not displayed by default. You can click the settings icon in the upper-right corner to display this field. It indicates whether the current SQL statement is soft-parsed to directly hit the plan cache. |
Fixed Execution Plan Used | This field is advanced information and is not displayed by default. You can click the settings icon in the upper-right corner to display this field. It indicates whether the current SQL statement uses a fixed execution plan and confirms whether a plan is bound to the SQL statement. |
Adjusting the Slow SQL Statement Record Threshold
By default, only SQL statements executed for longer than 300 ms are recorded as slow SQL statements. On the Slow Log Details page, click Slow SQL Threshold to modify the time recorded for slow SQL statements. The value is an integer in the range of 300 to 9223372036854775807, in milliseconds. Users can adjust the slow SQL statement record threshold based on actual business requirements.
SQL Statement Analysis Reports
The Generate Analysis Report feature is included in the operation column. You can click Generate Analysis Report to generate the running information for the SQL statement during execution. You can view the execution plan and operator execution situation used during SQL statement execution. Users can perform a detailed analysis of SQL statement execution based on the analysis report, helping perform SQL statement tuning.
Note:
For versions earlier than 2.2410.12.0 and 3.2503.6.0, SQL statement analysis reports cannot be generated. If you cannot generate SQL statement analysis reports in the console, contact Tencent Cloud to apply for an instance version upgrade.
After you click Generate Analysis Report, it takes about 5 minutes to generate an analysis report for the SQL statement. After the analysis report is generated, click Download Analysis Report to download the detailed SQL statement analysis report.
The download URL for the analysis report is a temporary download URL, which is retained for 1 minute by default. You need to download the analysis report within 1 minute. If the time is exceeded, you need to regenerate the analysis report. For a detailed analysis report interpretation, see Viewing an SQL Analysis Report.