An analysis report can accurately provide detailed information on SQL statement execution in an analysis engine, helping analyze specific issues about the execution time. This document describes the meaning of each field in an SQL statement analysis report.
Viewing an SQL Statement Analysis Report
1. Log in to the TDSQL-C for MySQL console and click the target cluster in the cluster list on the left to go to the Cluster Management page. 2. If you want to view the SQL statement analysis report generated by a read-only analysis engine under a transactional cluster, you can select the Operation Log page, select the target read-only analysis engine from the drop-down list on the left, find the corresponding slow SQL statement in the list, and then click Generate Analysis Report in the corresponding SQL Analysis Report column. If you want to view the SQL statement analysis report generated by an analysis cluster, you can go to the Slow SQL Details page, find the corresponding slow SQL statement in the list, and then click Generate Analysis Report in the corresponding SQL Analysis Report column.
3. It takes about 5 minutes to generate an analysis report. When the analysis report is generated, click Download Analysis Report to download the analysis report to your local computer.
Note:
Use Chrome or Firefox of a higher version to open the analysis report.
4. After downloading the analysis report, decompress it. Then, open the index.html file to view the details of the SQL statement analysis report in the browser.
Analysis Report Details
The SQL statement analysis report consists of the following three parts:
Execution Plan: shows key metrics such as the number of estimated rows and the actual number of rows returned in the SQL statement execution plan. Performance Overview
The Performance Overview section consists of the following three parts:
Basic Information and Time Overview: includes the instance ID, ID of the executed node, internal trace ID, and various metrics of the execution process.
SQL Statement Text: shows the complete SQL statement executed this time (The maximum storage length is 4 MB. The excess part is automatically truncated).
Table Structure Information: collapsed by default. Click it to show all table structures involved in this query.
Basic Information and Time Overview
Basic Information includes the instance ID, node ID, and internal trace ID of the user.
After receiving an SQL statement from the user, the analysis engine performs lexical and syntax parsing on the SQL statement, compiles it into a plan tree, and finally optimizes the plan tree based on statistical information to generate the final execution plan. Time Overview shows the following time information:
Total Time: total time of the SQL execution process.
Parsing Time: SQL lexical/syntax parsing time.
Compilation Time: time used to compile an SQL statement into a plan tree.
Optimization Time: time used to optimize the execution plan based on statistical information.
Execution Plan
The execution plan shows the detailed execution plan tree structure of the current SQL statement. The execution plan consists of the following five key parts:
Operator ID: the basic identifier of the plan tree. Each SQL statement will be parsed into a plan tree that consists of multiple operators. The operator ID is in the "operator type_unique ID" format (example: FILTER_14), providing a unique identifier for each operator node in the tree.
Estimated Row Count: serves as an important reference for the optimizer when formulating an execution plan. Based on table statistics and the index status, the optimizer predicts the number of data rows each operator may generate. Note that this estimated value may sometimes differ from the actual result due to the complexity of data distribution.
Actual Row Count: records the actual number of data rows processed by an operator after a query is executed. This value reflects the true data processing volume in a query. The comparison between the Estimated Row Count and Actual Row Count columns can help understand the decision-making accuracy of the optimizer.
Actual Data Amount: indicates the size of physical data generated by an operator. It is usually measured in bytes. It is collectively determined by the actual number of rows and the average size of each row of data, comprehensively showing the resource consumption and actual data amount during data processing.
Operator Details: Each operator has its unique details. The content in this part varies depending on the operator type.
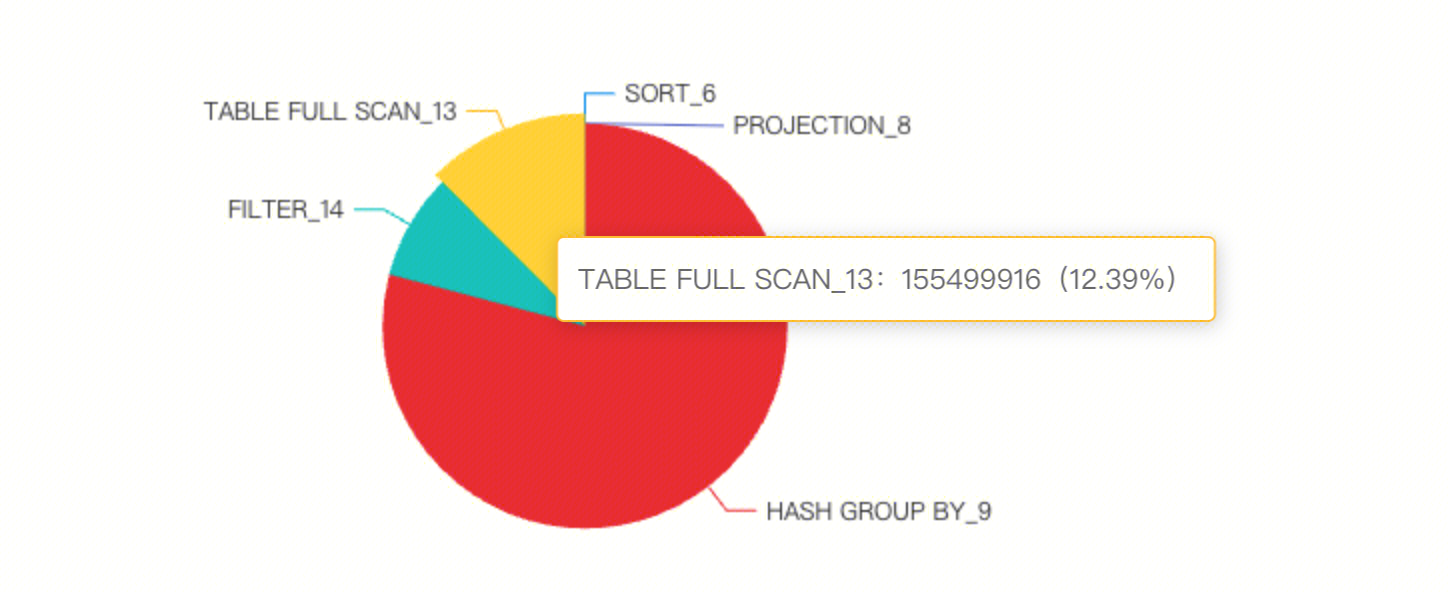
Operator Execution Time Distribution
During the analysis of SQL statement execution performance, the operator execution time distribution chart provides a key perspective. It allows you to clearly view the CPU time slice proportion consumed by each operator. By observing the size of each colored block, you can intuitively locate the most time-consuming operator in the entire execution plan.
When you hover over a colored block area of a specific operator, the system will display a detailed information card. This card contains three core dimensions:
Operator ID: precisely identifies the current operator (example: Join_5).
CPU Time Slice: displays the actual CPU time occupied by the operator (unit: nanoseconds).
Time Slice Percentage: displays the weight of the operator in the total execution time as a percentage.