聚合分析
Download
聚焦模式
字号
在数据分析场景中,可对数据进行不同计算口径的统计。如加和、计总、求平均数等,以下分为维度和指标进行聚合介绍:
维度聚合
目前支持时间字段类型的聚合,以下以《商品销量分析》为例,演示使用场景和用法,假设有4条原始数据:
id | 商品 | 时间 | 金额 |
1 | 纸巾 | 2022-01-02 12:10:23 | 10 |
2 | 毛巾 | 2022-01-01 09:50:13 | 3 |
3 | 纸巾 | 2022-01-01 08:32:41 | 10 |
4 | 水 | 2022-01-01 08:32:09 | 1 |
如需获取 2022-01-01 这一天的销量,则需要将“时间”维度聚合到“天”,在系统中,先拖入“时间”字段到维度框,如下: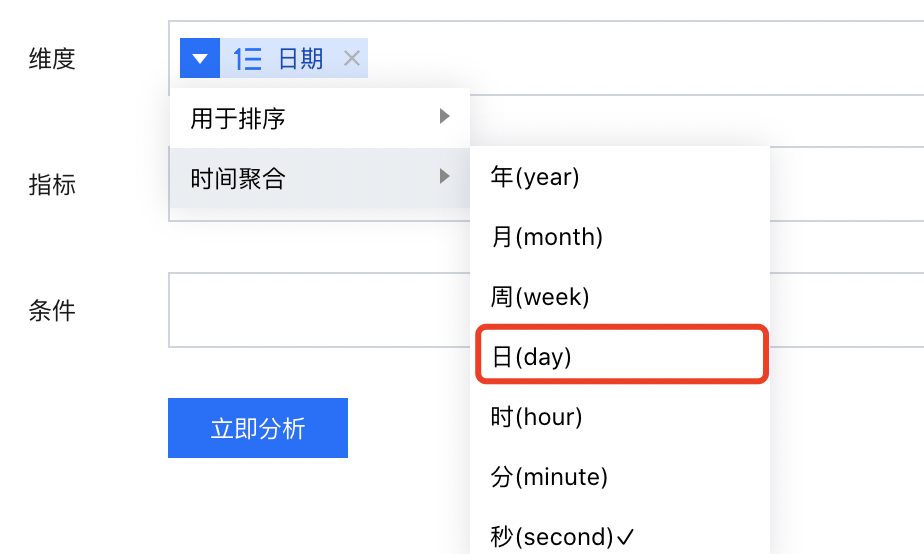
聚合到“日(day)”后,2022-01-01 的金额加和为 3+10+1 = 14;
如聚合到“时(hour)”后,2022-01-01 08时的金额加和为 10+1 = 11。
同理,如需按周统计,只需要时间聚合设置为 “周(week)”即可。
在时间聚合设置中,需要注意以下几点:
1. 时间聚合的颗粒度由时间字段格式决定,可在 数据表中查看、编辑时间格式;
2. 时间字段格式决定最高精度,默认按照最高精度聚合,可聚合的颗粒度必须在最高精度上面,如时间字段格式最高精确到秒,则可聚合“年、月、周、日、时、分、秒”,如时间字段格式最高精度到日,则只能聚合“年、月、周、日”。
指标聚合
任何字段如设置为指标,则都将作为数值进行统计。
如该字段为数值字段,则可进行如下聚合统计:
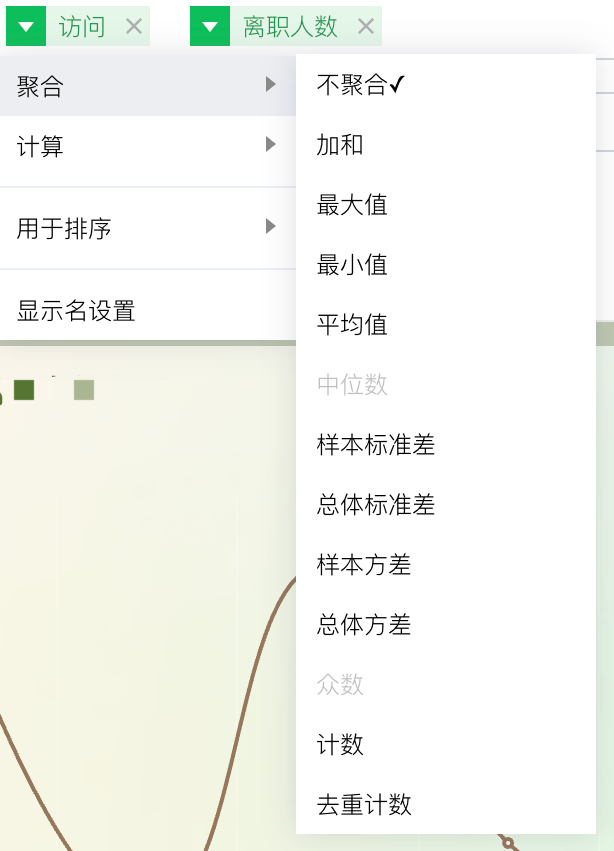
下面,逐个说明不同聚合方式下的统计口径:
示例数据表片段:
id | 商品 | 时间 | 金额 |
1 | 纸巾 | 2022-01-02 12:10:23 | 10 |
2 | 毛巾 | 2022-01-01 09:50:13 | 3 |
3 | 毛巾 | 2022-01-01 08:32:41 | 10 |
4 | 水 | 2022-01-01 08:32:09 | 1 |
5 | 水 | 2022-01-01 08:32:08 | 1 |
聚合统计说明如下:(维度字段为“时间”,指标字段“金额”,以2022-01-01时间点的“金额”计算为例)
聚合方式 | 聚合说明 | 举例 |
不聚合 | 取第一条记录的值 | 结果为 1 (即 id:5的金额,需要结合排序看) |
加和 | 取所有数值相加值 | 结果为 3+10+1+1 = 15 |
最大值 | 取所有记录中的最大值 | 结果为 10 (即 id:3的金额) |
最小值 | 取所有记录中的最小值 | 结果为 1 (即 id:4的金额) |
平均值 | 取所有记录值总和除以记录数 | 结果为(3+10+1+1)/4 = 3.75 |
计数 | 取记录出现次数 | 结果为 4 |
去重计数 | 取不重复的记录出现次数 | 结果为 3 (其中 id:4,id:5为重复值) |
中位数 | 取当前排序的中间数值 | 结果为10(即id:3的金额,假设按照id作为维度,且按照id排序) |
样本标准差 | 取当前日期的样本标准差 | 结果为4(详见相关数学方法说明) |
总体标准差 | 取当前日期的总体标准差 | 结果为4(详见相关数学方法说明) |
样本方差 | 取当前日期的样本方差 | 结果为18(详见相关数学方法说明) |
总体方差 | 取当前日期的总体方差 | 结果为14(详见相关数学方法说明) |
众数 | 取当前日期的出现次数最多的值 | 结果为10(详见相关数学方法说明,10和1各出现2次,需要结合排序看) |
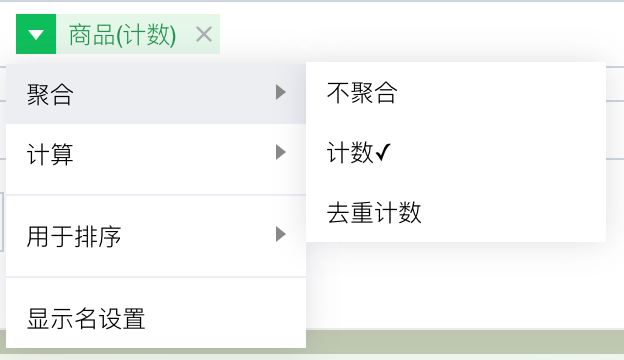
如维度字段为“时间”,指标字段为“商品”(非数值字段),以2022-01-01时间点的“商品”计算为例:
聚合方式 | 聚合说明 | 举例 |
计数 | 取记录出现次数 | 结果为 4 |
去重计数 | 取不重复的记录出现次数 | 结果为 2 (其中 id:2和 id:3,id:4和 id:5为重复值) |
补充说明:
指标聚合功能依赖于数据库支持程度,部分数据库不支持如众数、方差等,具体是否支持,可在聚合下拉中查看,如当前算法灰掉不可用,即为不支持。
文档反馈