2. On the left sidebar, click Application Management > Business System.
3. On the business system management page, click Create Business System. In the pop-up window, enter the business name and indicate your consent to the agreement.
3. On the data overview page, click Application Connection and configure the application information as detailed below:
Configuration Item
Description
Application Name
Enter a custom application name, which identifies the application in the RUM console.
Application Description
Enter an application description such as usage and overview, which helps other users better understand this application.
Application Type
RUM supports connection to web, mini program (WeChat and QQ), Hippy, Weex, and React Native applications.
Application Repository Address (optional)
Enter the address of your application repository, which is optional.
Business System
This feature is used to manage your connected applications by category. For example, you can categorize your applications by conditions such as development team, business logic, and application type. If you have no available teams, click Create on the right, enter the relevant information, and click OK to create one.
Enable Auto URL Aggregation
After it is enabled, URLs with the same domain will be aggregated for analysis; for example, app.qq.com/user/123/index.html and app.qq.com/user/456/index.html will be aggregated into app.qq.com/user/*/index.html.
Sample Rate
It indicates the percentage of user performance data (tested page, API, and static resource speeds) to be reported. 100% indicates that no data will be sampled, and 0% indicates that no performance data will be imported.
4. After completing the configuration, click Next and select a method to install the SDK as detailed below:
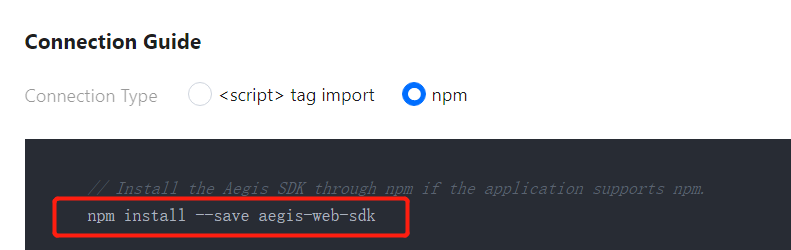
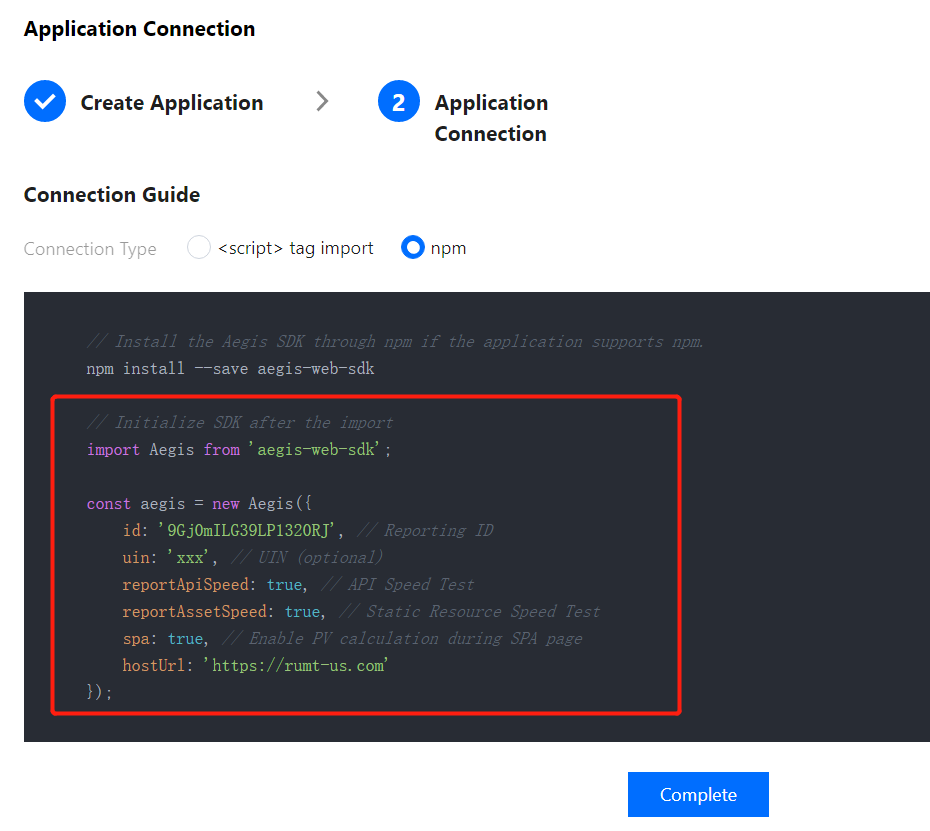
Install the SDK through npm (supported for all application types). The followings steps use a web application as an example to describe how to connect to the SDK through npm.
i. On the connection guide page, copy the first command line to import the npm package.
ii. On the connection guide page, copy the provided code to initialize the SDK.
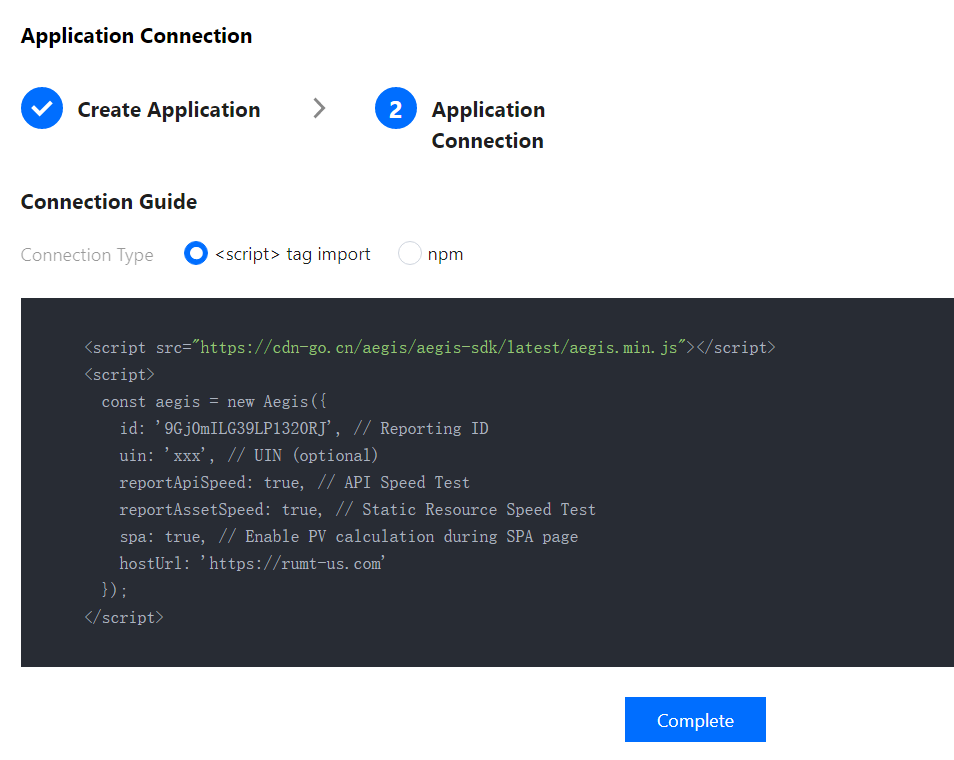
Connect to the SDK by importing the <script> tag (supported only for web applications).
i. On the connection guide page, copy the provided <script> tag code.
ii. Import the code below <script> tag import into the <head></head> tags.
Note:
After completing the above steps for connection, you can use the data overview, page performance, exception analysis, page view (PV and UV), API monitoring, and static resource features. If you want to use the log query, offline log, custom speed test, and custom event features, you need to report the data as instructed in the connection guide.
Step 3. View the monitoring data
After your application is connected successfully and reports a certain amount of data, you can go to the RUM console to view monitoring data such as exception analysis, page performance, and page view.