Querying Scale-up History
다운로드
포커스 모드
폰트 크기
Use Cases
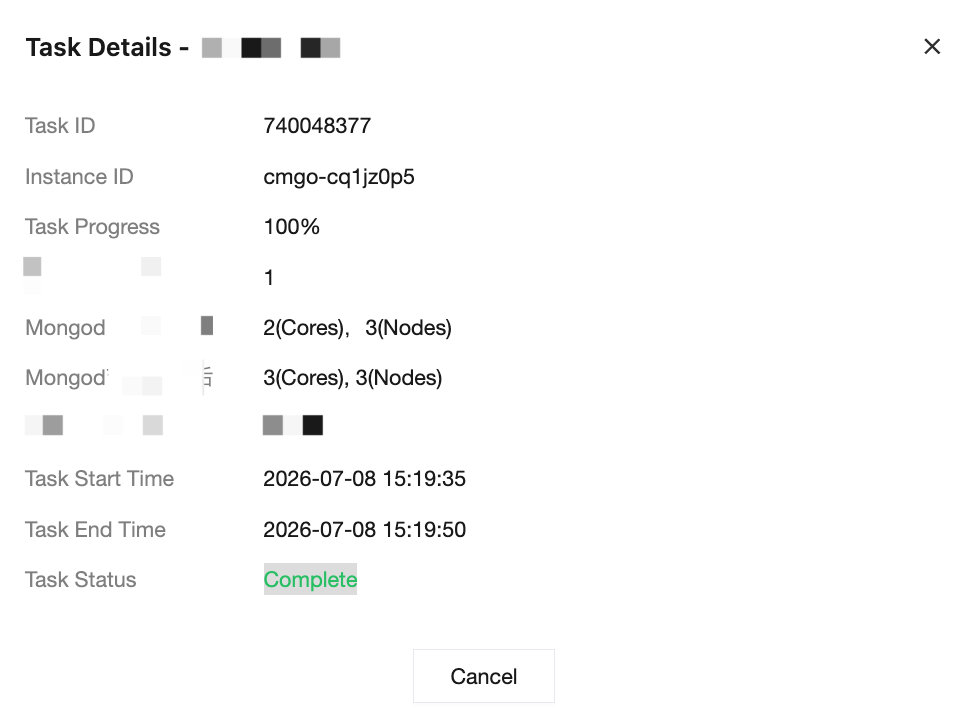
Each CPU elastic scale-up and scale-down operation is recorded as a task. You can view the elastic scale-up records of an instance in the scale-up history to check information such as the scale-up time, number of cores added, and execution status. This information can be used to verify billing and evaluate the effectiveness of scale-up during business peak periods.
Prerequisites
The CPU elastic scale-up feature has been enabled for the instance, and scale-up or scale-down tasks have been generated.
Operation Steps
1. Log in to the TencentDB for MongoDB console.
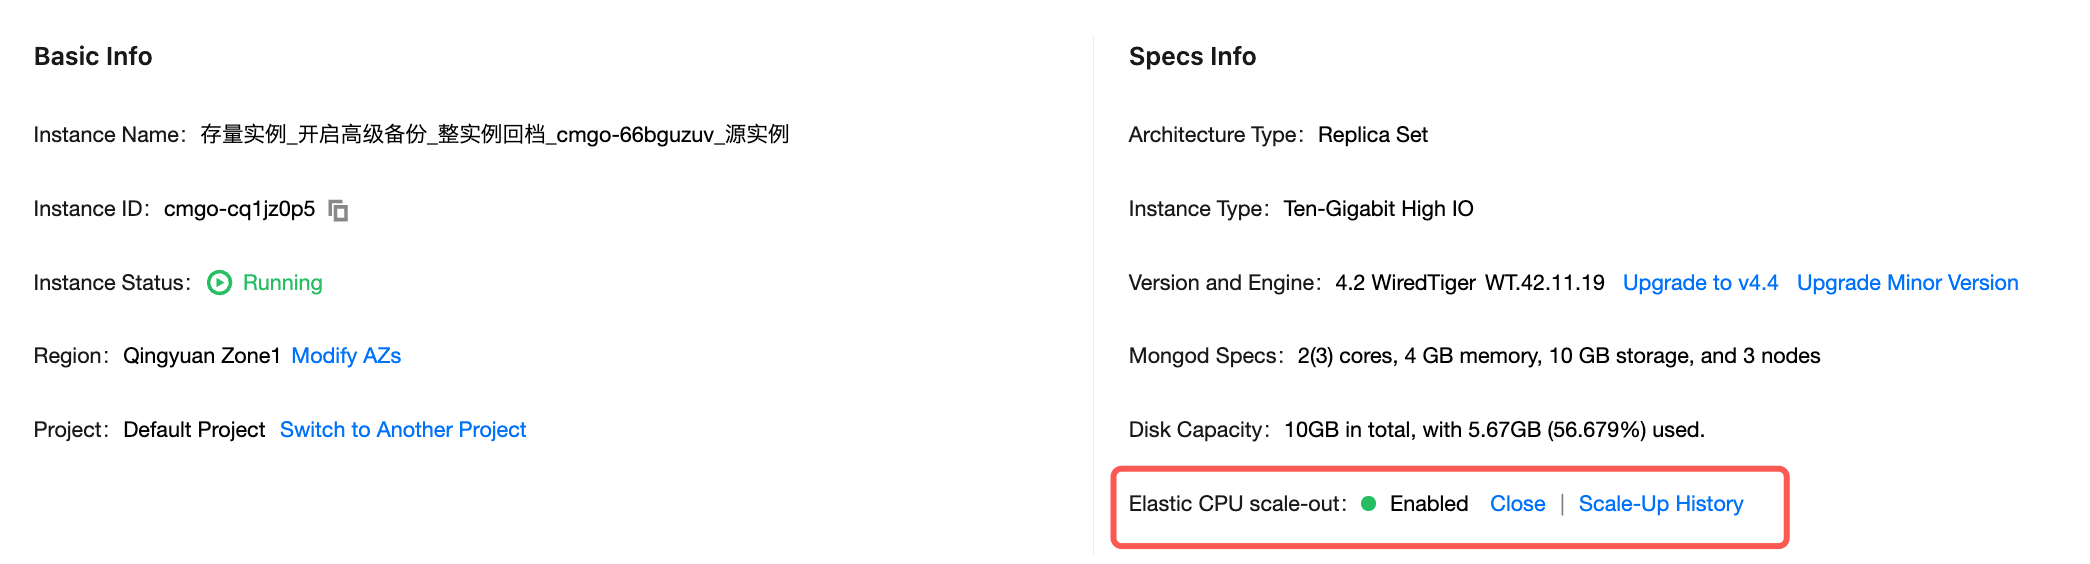
2. Go to the instance details page. In the Specs Info area, locate Elastic CPU Scale-out and click Scale-Up History to enter the task list.
3. Go to the task management page. In the task list, view the task records. Click Task Details to view the detailed information of a single task.

4. Click Task Details to view the detailed information of a single task. The task type in the current scale-up history is Elastic CPU Scale-up, which refers to the scale-up and scale-down tasks triggered by custom scale-up.
Execution Status Description
Execution status | Description |
Scale-out is successful | All nodes (or all shards) of the instance are scaled up successfully. |
Partially successful scale-up | Some shards of the sharded cluster instance are scaled up successfully, while others fail. An alarm is triggered by the background for the failed shards. |
Scale-in succeeded | The CPU cores of the instance have been scaled back to the original specification. |
피드백