As the most common type of data display, tables allow for structured data organization that facilitates comparison and analysis. They are suitable for most scenarios.
Operation Steps
1. Log in to the CLS console, choose Dashboard > Dashboard List, and then select the dashboard you want to view.
2. Click Add Chart to create a new chart, and select Table as the chart type.
3. Configure the chart as needed.
General Configuration
Configuration Item
Description
Basic Info
Chart Name: Set the display name of the chart, which can be empty.
Table Style
Auto Line Wrap: When enabled, text that exceeds the column width will automatically wrap to the next line. When disabled, any overflowing text will be truncated.
Column Width Mode: The default column width for the table.
Auto: Automatically adjusts the column width based on the text length of the content in each column.
Equal Width: Each column has the same width.
Pagination Size: Configures the number of rows per page for the table. The valid range is 20 - 1000.
Minimum Column Width: Configures the minimum width for table columns. The valid range is 50 - 500.
Content Alignment: Defines the alignment of content within table cells. By default, metric-type fields are right-aligned, while dimension-type fields are left-aligned.
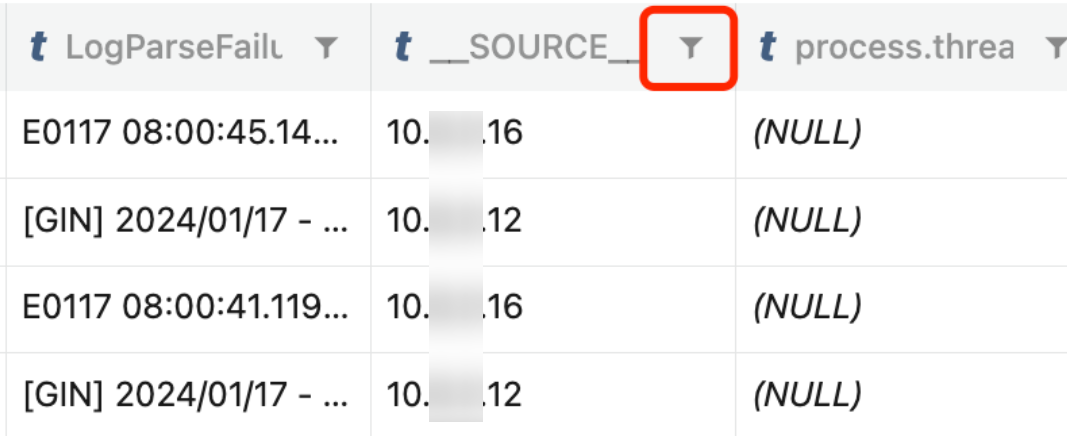
Column Filtering: Supports filtering the content of columns.
Standard Configuration
Set the unit for all metric-type fields within the chart. For details, see Unit Configuration.
Interaction Events
This feature allows you to define custom interaction events. Clicking on chart content can trigger interactions to open pages such as the search and analysis page, dashboard page, or third-party URLs. For details, see Interaction Event.
Threshold
Configuration Item
Description
Threshold Configuration
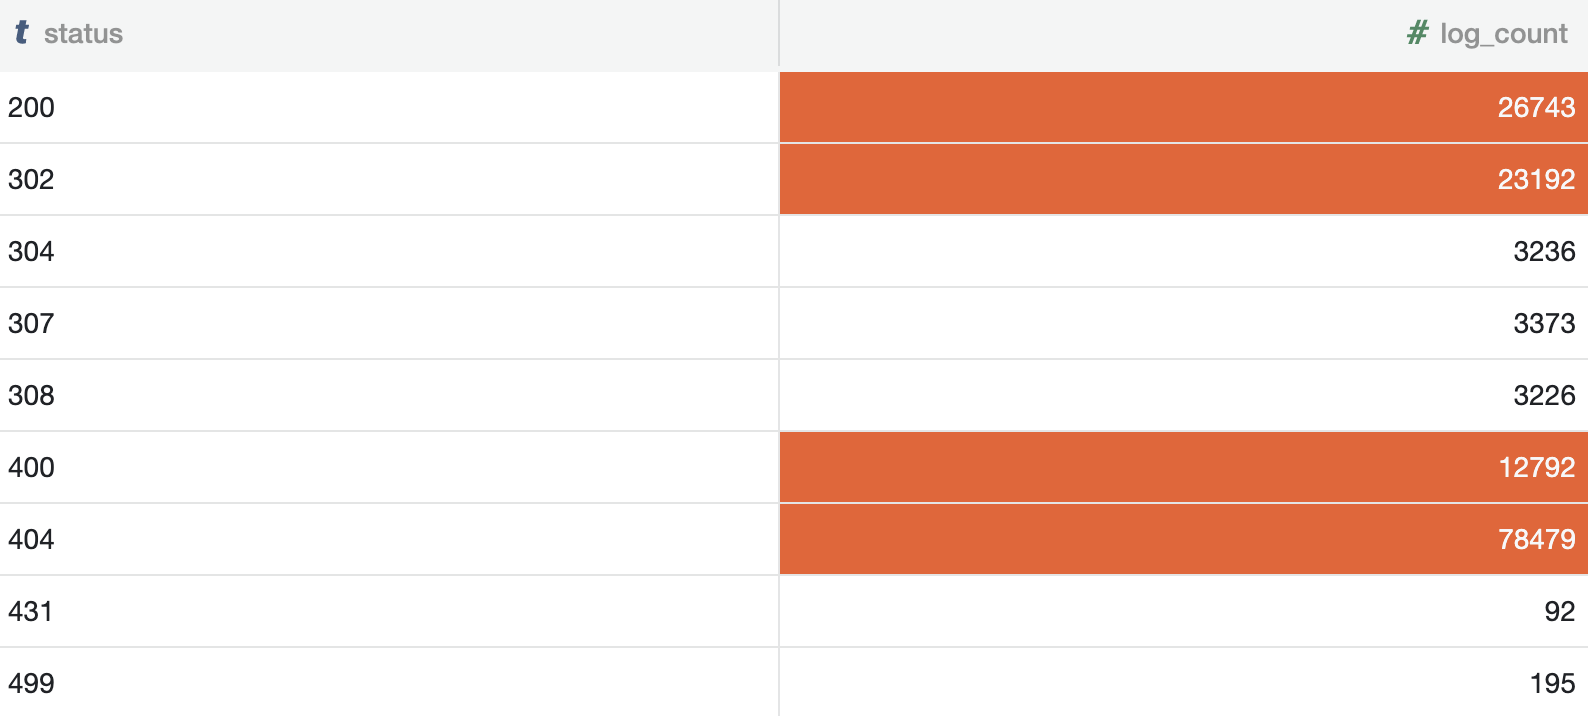
Set a threshold point to highlight rows or columns that meet the threshold.
Example: Configure thresholds in Chart Configuration > Threshold Configuration, and select the threshold style as text highlighting or background highlighting.
In the table after configuration, the rows or columns that meet the threshold are highlighted.
Field Configuration
Configuration Item
Description
Field configuration
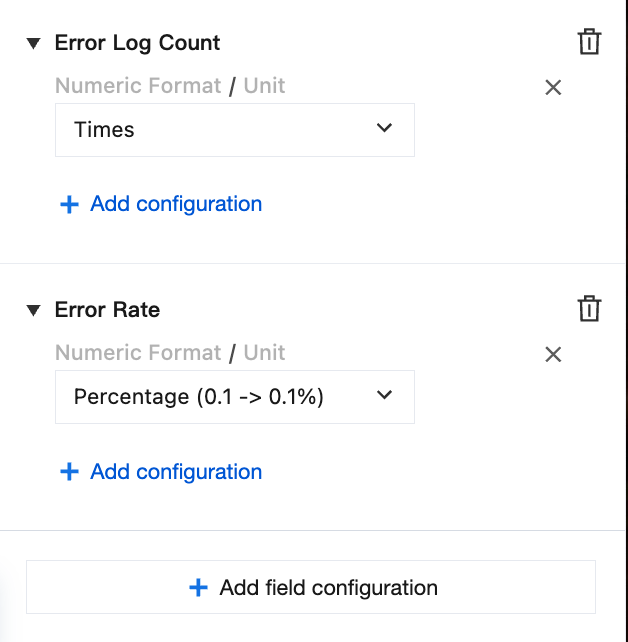
Field configuration supports configuration items that apply only to selected fields, which will overwrite the default chart configuration.
Example: If a table contains multiple metrics (such as Error Log Count and Error Rate) that need to be displayed in the same row with their respective units—Count for Error Log Count and % for Error Rate—you can apply the field configuration. To do this, select Add field configuration, select the Error Log Count field, and set its unit to Count. Then, select the Error Rate field and set its unit to %. This enables you to apply different formatting to each field according to your requirements.
Table Operations
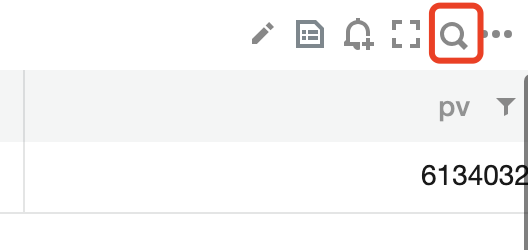
Searching Table Contents
In the search box at the top of the table, enter the search keywords and click Search.
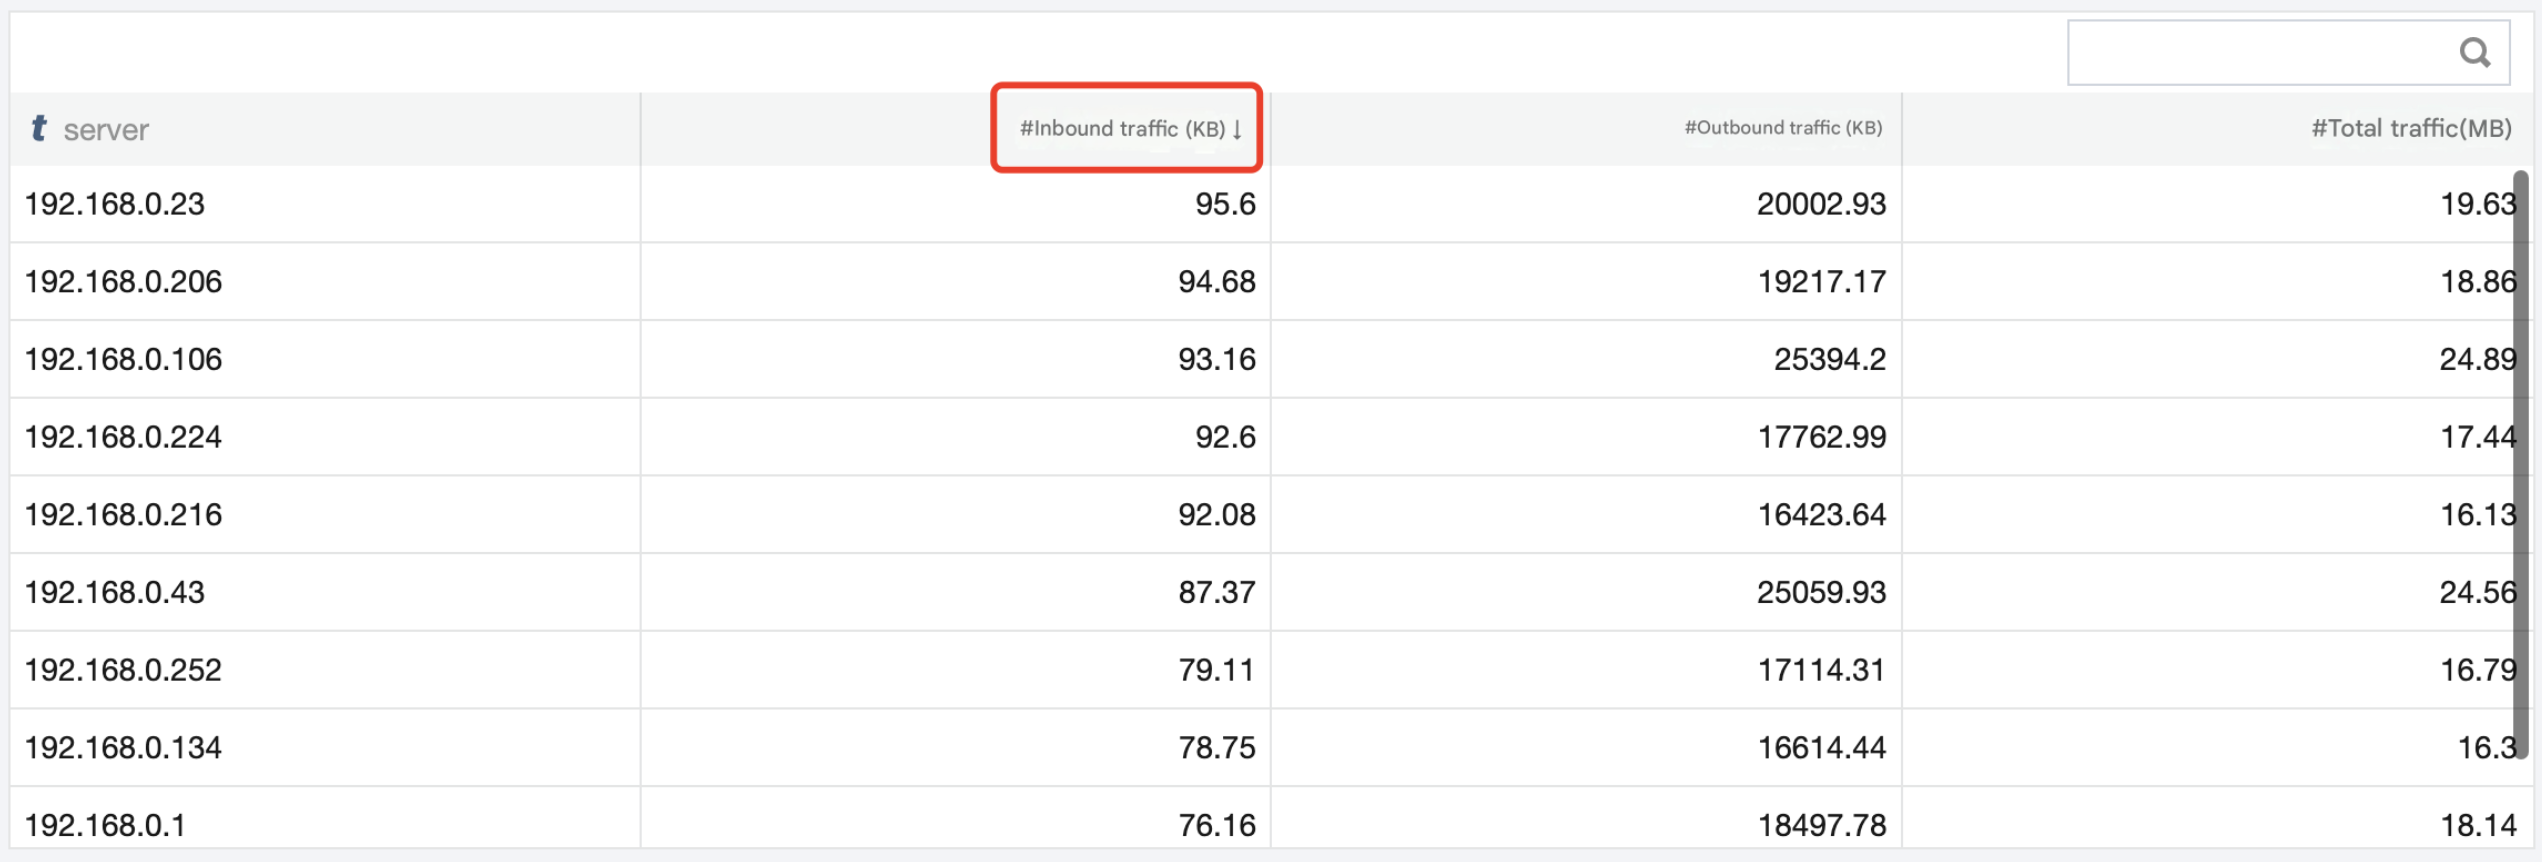
Sorting by a Specific Column
Click the header field name of the column you want to sort, and it will be arranged in ascending order. Click again to toggle to descending order.
Filtering by a Column
Click the filter button in the header of the column you want to sort, and select field values to filter.