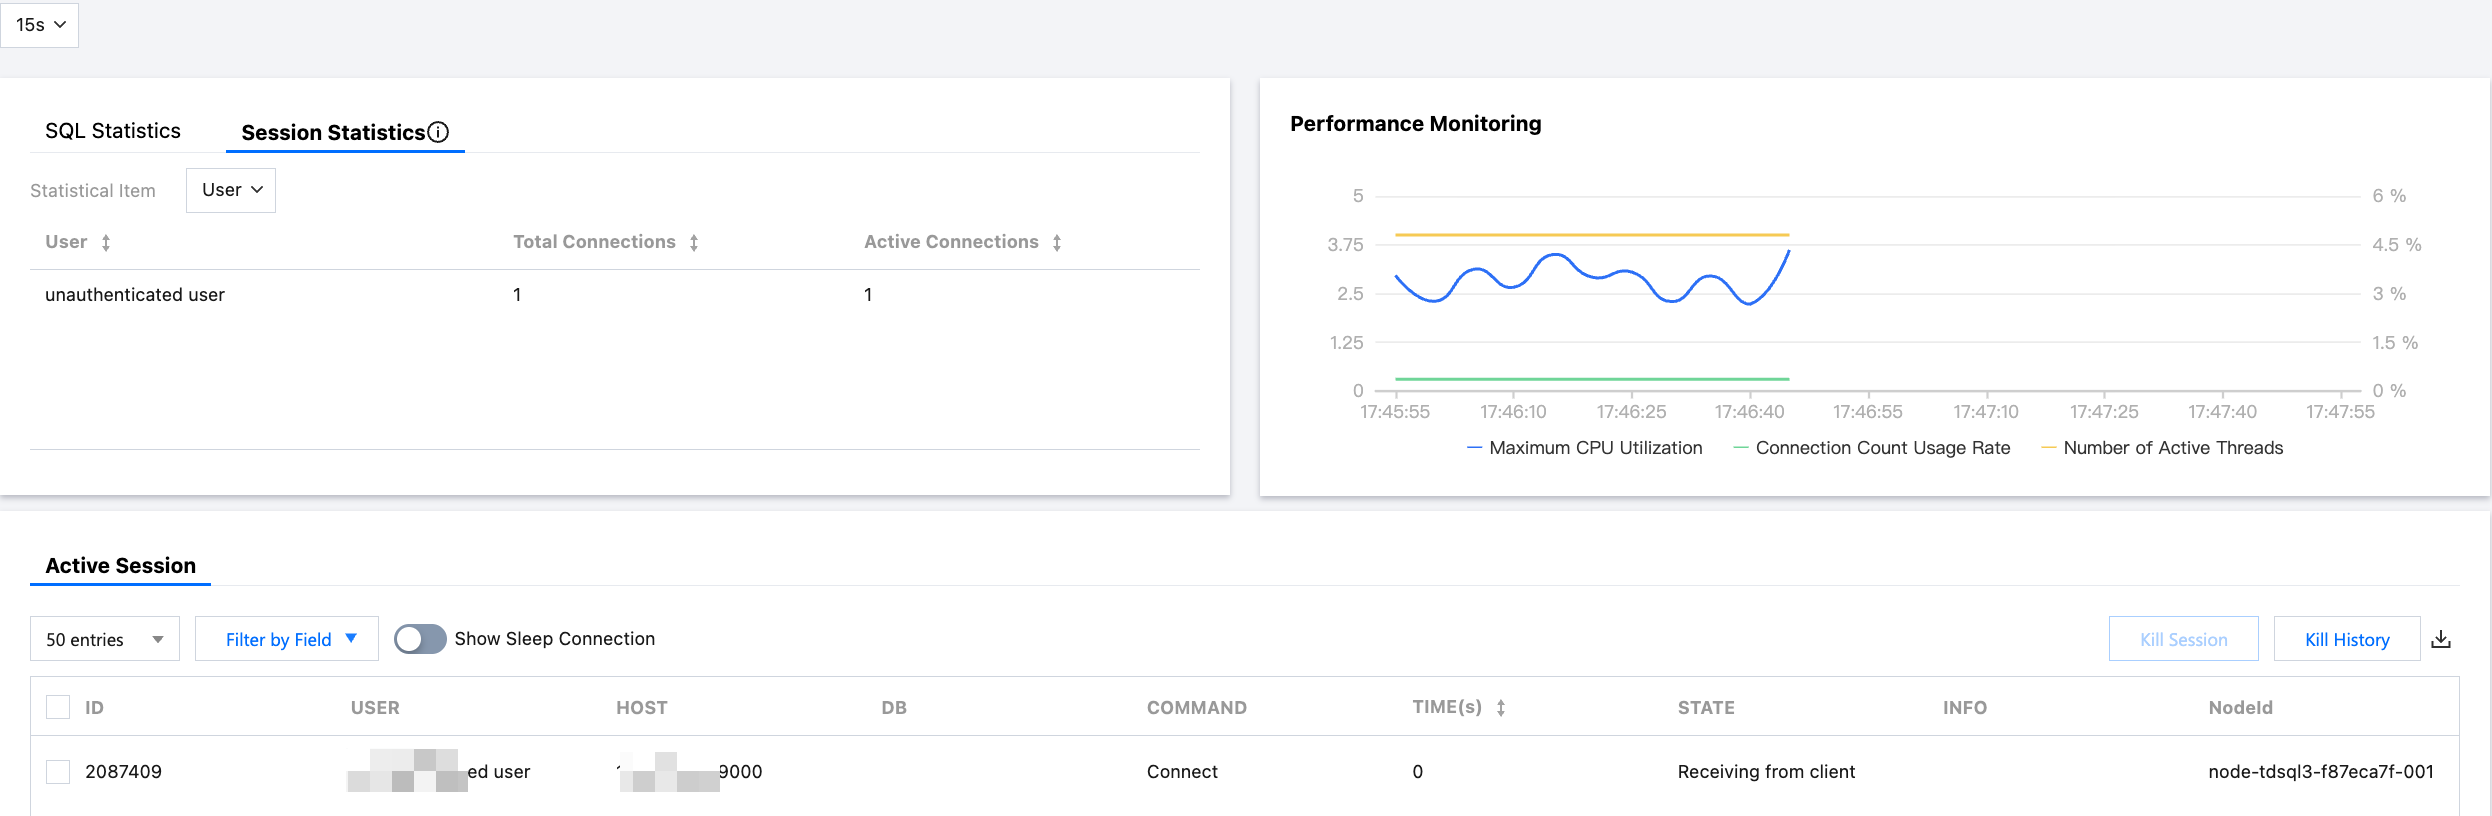
Real-time session provides real-time monitoring capabilities for active sessions and executing SQL for TDSQL Boundless (TDStore engine) instances. It helps users quickly identify long-running sessions, accumulated active transactions, and abnormal requests from specified clients.
Scenarios
When the business side reports slow database responses, immediately check the execution status of current active sessions.
When a CPU/session alarm occurs, use exception diagnosis to quickly locate long transactions and slow queries.
When troubleshooting application connection exceptions, identify the specific client based on the source Host and User.
When you need to urgently relieve database pressure, terminate abnormal sessions selectively.
Background Information
The Real-Time Session page primarily displays the following three types of data:
SQL Statistics: It displays the number of executions and average time consumed by SQL template, helping identify SQL statements that are executed frequently within a short period.
Performance Monitoring: It displays the latest trends of metrics such as number of active threads, peak CPU utilization, and connection utilization in line charts, facilitating cross-verification with the session list.
Active Session: It lists all current active sessions on the instance in a table format, including information such as session ID, user, source Host, target database, command, elapsed time, status, and SQL snippet.
The instance's active sessions are filtered by default at the underlying layer to exclude inactive sessions such as Sleep and Daemon, and are sorted in descending order by elapsed time. This facilitates prioritizing attention on high-consumption sessions.
Implementation Mechanism
The active sessions on the Real-Time Session page are sourced from the instance-level session view. A refresh interval dropdown is provided at the top of the page:
Auto-refresh is enabled by default with a default interval of 15 seconds. The refresh interval supports three selectable options: 5 seconds, 15 seconds, and 30 seconds.
Auto-refresh can be disabled.
Each refresh synchronously updates the three areas—SQL Statistics, Performance Monitoring, and Active Sessions—to maintain data consistency.
Sessions that have completed execution are automatically removed from the list.
Use Limits
Number of entries returned per request: The active session list returns a maximum of 100 entries per request. You can switch between the three limits of 20, 50, or 100 entries. For entries beyond the limit, refine the filter criteria and query again.
Kill Permission: Terminating a session requires the current account to have session management permissions for the instance.
Notes
Terminating a session immediately stops the SQL and transactions being executed by the target session. Any uncommitted transactions will be rolled back. Perform this operation only after confirming that the target session is indeed abnormal.
Multiple database connections from the same application appear in the list as independent sessions. Terminating one session does not affect the other connections of that application.
Prerequisites
The TDSQL Boundless instance has been connected in DBbrain.
The current account has DBbrain view permissions for this instance.
To terminate a session, you must have session management permissions.
2. In the left sidebar, select Performance Optimization.
3. At the top of the page, select TDSQL Boundless as the database type, and then select the target instance ID.
4. Click the Real-time Session tab.
5. Select the page refresh frequency. You can select 5 seconds, 15 seconds, and 30 seconds. The default value is 15 seconds. You can also stop refreshing.
6. View SQL statistics, session statistics, active sessions, and performance monitoring information.
Note:
SQL statistics and session statistics are consistent with the active session data below.
7. View SQL statistics, session statistics, active sessions, and performance monitoring information.
Note:
SQL statistics and session statistics are consistent with the active session data below.
View SQL statistics
Select the SQL Statistics tab and select the statistical items (including Execution Count, Total Time Consumed, Max Execution Time, and Avg Execution Time) to collect real-time data of executed SQL statements in different dimensions.
View session statistics
Select the Session Statistics tab and select the statistical items (including User, Access Source, and Database) to collect real-time session data in different dimensions.
View active sessions
7.1.1 Select the Active Sessions tab.
7.1.2 Select the number of sessions to display: It includes limiting to 20, 50, or 100, with a default value of 20.
7.1.3 Click Field by Field, set the following conditions, and view real-time sessions.
7.1.4 View the filtered real-time sessions based on the filtering conditions.
The session list fields are described in the following table.
Field
Description
ID
The unique identifier for the session connection.
USER
The database username that initiated the session connection.
HOST
The IP address of the client that initiated the connection.
STATE
The current execution state of the session (such as creating table, Sending data, Locked, and so on).
DB
The name of the database currently used by the session.
COMMAND
SQL command type, including ALL, Not Sleep, and others.
ALL
Not Sleep
Others: including Binlog Dump, Change user, Close stmt, Connect, Connect Out, Create DB, Daemon, Debug, Delayed insert, Drop DB, Error, Execute, Fetch, Field List, Init DB, Kill, Long Data, Ping, Prepare, Processlist, Query, Quit, Refresh, Register Slave, Reset stmt, Set option, Shutdown, Sleep, Statistics, Table Dump, and Time.
INFO
The content of the SQL statement currently being executed by the session.
TIME
The duration for which the session has been active, unit: seconds.
7.1.5 (Optional) You can click
in the upper right corner of the list to download the real-time session list in the CSV format.
View performance monitoring data
Enter the Real-time session page and view real-time performance monitoring data and trends within 2 minutes in the Performance Monitoring area.
Performance monitoring data includes peak CPU utilization, connection utilization, and number of active threads.
Hover the cursor over a specific time point to display detailed data of the performance metrics.
2. In the left sidebar, select Performance Optimization.
3. At the top of the page, select TDSQL Boundless as the database type, and then select the target instance ID.
4. Click the Real-time Session tab.
5. On the Real-Time Session page, select the Active Session tab.
6. In the real-time session list, check the session to be killed, click Kill Session at the top right of the list, and click OK in the pop-up dialog box.
Attention:
Terminating a session immediately rolls back any uncommitted transactions, which may cause requests from the business side to fail. Only perform this operation after confirming the session is indeed abnormal.
After killing the session, you can click Kill History at the top of the list to view the killed session.
Following Steps
If you find that a specific SQL template is being called at a high frequency, you can go to the Slow SQL Analysis page to view its detailed execution plan and time consumption distribution.
If the pressure is not alleviated after the session is terminated, you can go to the Exception Diagnosis and Performance Trends pages to continue analyzing the root cause.
Q1: Why Does the Same Application Have Multiple Sessions?
Applications typically establish a connection pool with the database, where each connection corresponds to an independent session. The Real-time Sessions page lists all active sessions on the current instance, enabling users to perform detailed troubleshooting based on dimensions such as USER, HOST, and SQL.
Q2: Why Can I Still See the Session in the List After Executing the Kill Operation?
It takes a short time for a session to be fully cleaned up after being killed. During this period, the session's COMMAND is displayed as Killed. You can select Show Killed Sessions to confirm. After a few seconds, the session will be removed from the list.
Q3: How to Distinguish Application Connections from Database System Sessions?
Application connections typically have clear USER and HOST information. Internal sessions of the database itself usually use system accounts or Daemon commands and are filtered by default in the list.
Q4: What Is the Difference Between SQL Statistics on the Real-Time Session Page and Slow SQL Analysis?
The SQL statistics on the Real-time Sessions page aggregate SQL templates executed by active sessions within the current observation window. The Slow SQL Analysis page, on the other hand, performs statistical analysis over a longer time range and with finer granularity based on slow logs.