Slow SQL analysis provides offline performance analysis capabilities based on slow logs for TDSQL Boundless (TDStore engine) instances. By aggregating slow SQL queries with the same template, you can identify the most impactful inefficient queries and view their key information, such as execution time distribution, scanned rows, and source database, to assist with SQL tuning.
Scenarios
The business side reports slower API/application responses, requiring investigation into whether inefficient queries exist.
When a CPU or I/O exception diagnosis alarm is triggered, confirm whether it is caused by slow SQL.
Review the execution cost of new business SQL before deployment.
Regularly inspect and identify SQL templates with high long-term execution costs, then optimize their indexes or statements.
Background Information
Slow SQL analysis collects and aggregates slow logs from instances, grouping SQL statements with the same semantics (only parameters differ) into a single template for statistical analysis:
Statistical Dimensions: Execution Count, Average Execution Time, Max Execution Time, Max Lock Wait Time, Max Scanned Rows, Source Database, and so on.
Time Range: You can select Today, Last 5 minutes, Last 10 minutes, Last 1 hour, Last 3 hours, Last 24 hours, Last 3 days, or a custom time range (the earliest selectable time point is up to 30 days ago, and the maximum selectable time range is 3 days).
Implementation Mechanism
Slow SQL analysis is implemented through the offline collection and aggregation of slow logs:
1. The database records slow queries based on the slow log threshold set by the kernel.
2. DBbrain collects slow logs and aggregates them into the instance view.
3. Results are grouped and displayed by SQL template, with an entry provided to view details of individual slow SQLs.
Use Limits
Slow Log Threshold: Whether a slow SQL is collected depends on the slow log threshold set by the database kernel. SQL statements that do not meet the threshold are not analyzed.
Time Range: The earliest selectable time point is up to 30 days ago, and the maximum selectable time range is 3 days.
Data Latency: There is a minute-level delay in slow log collection and aggregation. Therefore, slow SQLs that have just occurred may not appear on the analysis page for a short period.
Single Query/Export: For a single query on the detail list, the maximum number of returned results is 100 per page. For a single export, the maximum number of records is 10,000. To export records beyond this limit, you need to narrow the time range and perform the export again.
Notes
In slow SQL analysis, parameters in SQL templates are desensitized (replaced with placeholders). To view the specific SQL text, you can check representative samples in the template details.
Prerequisites
The TDSQL Boundless instance has been connected in DBbrain.
The current account has DBbrain view permissions for this instance.
2. In the left sidebar, select Performance Optimization, and then select the Slow SQL Analysis tab.
3. At the top of the page, select TDSQL Boundless as the database type, and then select the instance ID to be analyzed.
4. Select the Statistics tab.
5. Select a time range. Supported options include Today, Last 5 minutes, Last 10 minutes, Last 1 hour, Last 3 hours, Last 24 hours, Last 3 days, or a custom time range (the earliest selectable time point is up to 30 days ago, and the maximum selectable time range is 3 days).
After the time range is adjusted, all statistics and list areas at the bottom of the page are reloaded according to the new time range.
6. View SQL statistics, segment time-consuming SQL distribution, and the SQL list.
SQL Statistics Trend Chart
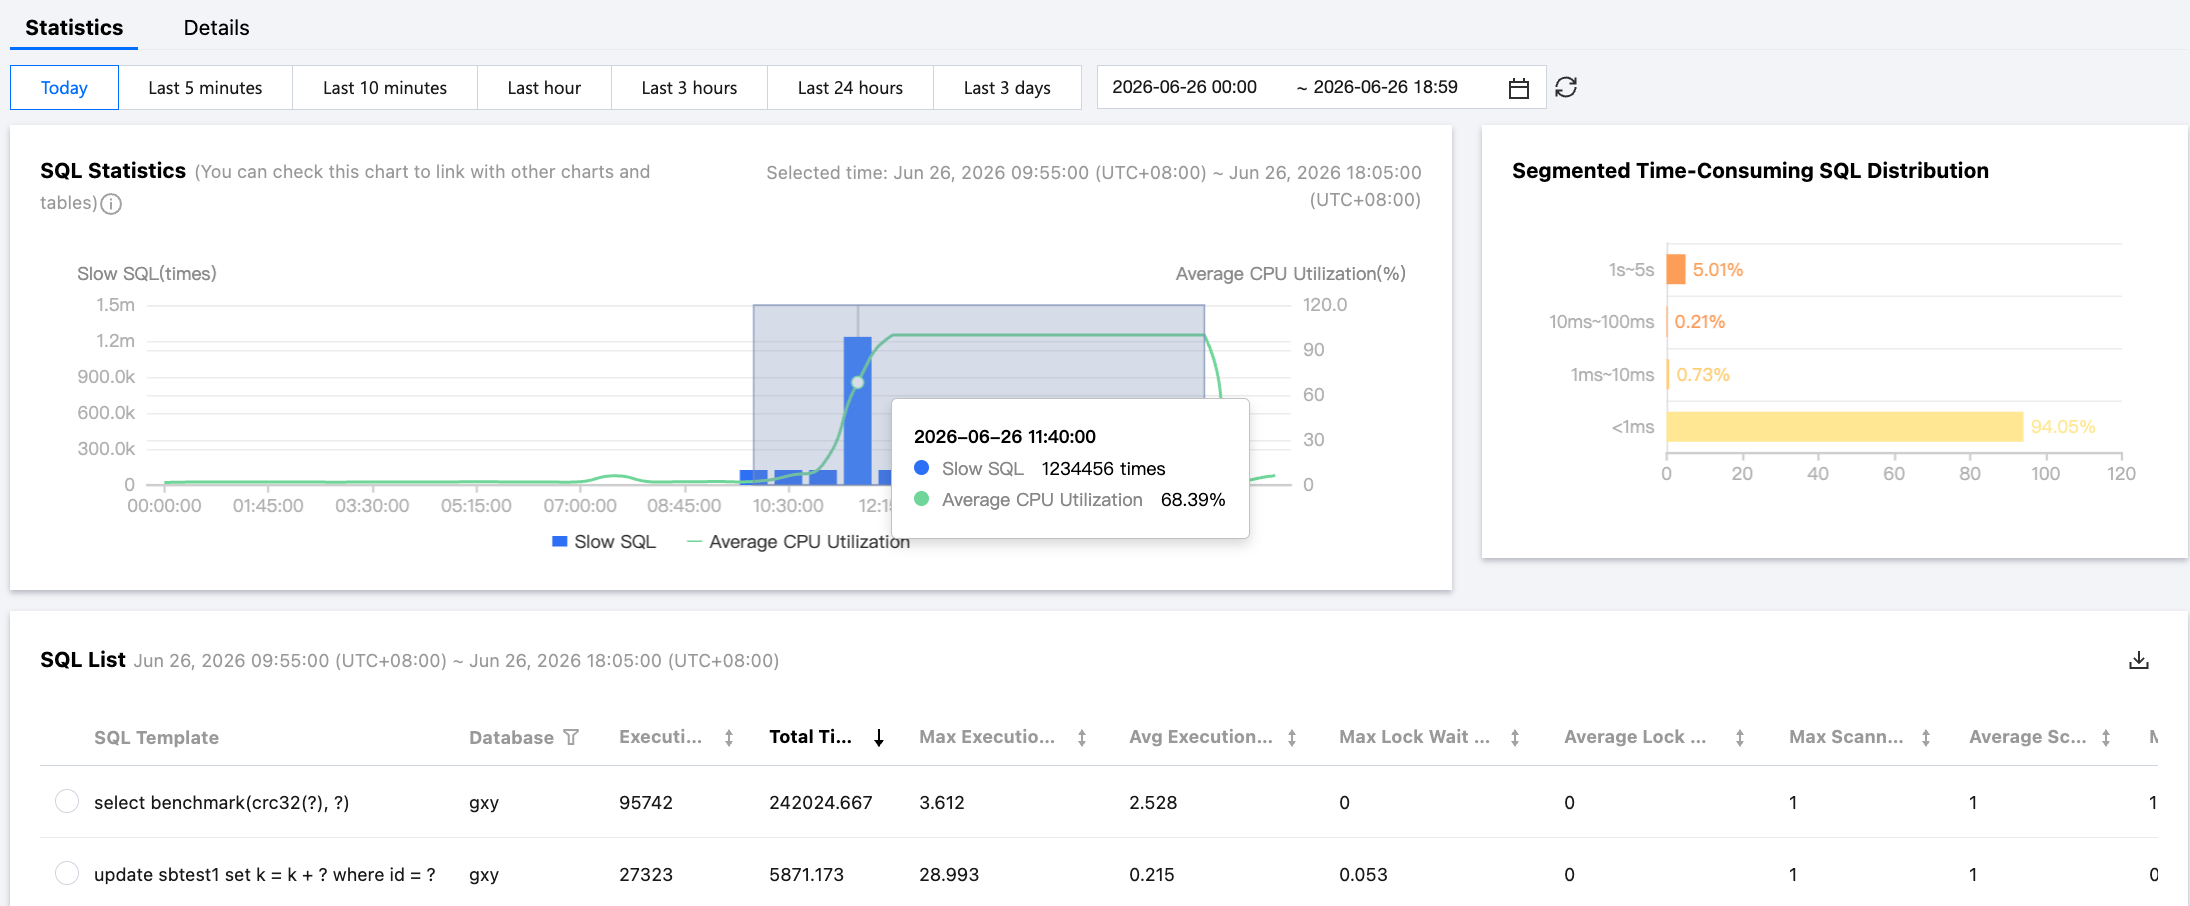
SQL Statistics focuses on two metrics: Slow SQL and Average CPU Utilization. It can quickly identify CPU usage patterns during periods when the number of slow SQLs remains high within the selected time range. This helps prevent high CPU utilization caused by an excessive number of slow queries, which can lead to computer lagging or unresponsiveness.
In the trend chart, click on a time period that contains slow SQL (that is, a bar). The time points and counts of the generated slow SQL are then displayed in the view.
Click on a time period that contains slow SQL, or drag the mouse to select multiple time periods. The Segment Time-consuming SQL Distribution and SQL List sections will then display data for the selected time periods in a linked manner.
Segment Time-consuming SQL Distribution
It displays the overall time consumption distribution of slow SQL for the selected time period.
SQL List
Slow logs for the selected time period are aggregated and displayed according to SQL templates.
6.1.1 View the slow SQL list. By default, it is sorted in descending order by total time consumption.
Click on an aggregated slow SQL. You can then view log statistics and details in the panel that pops up on the right side.
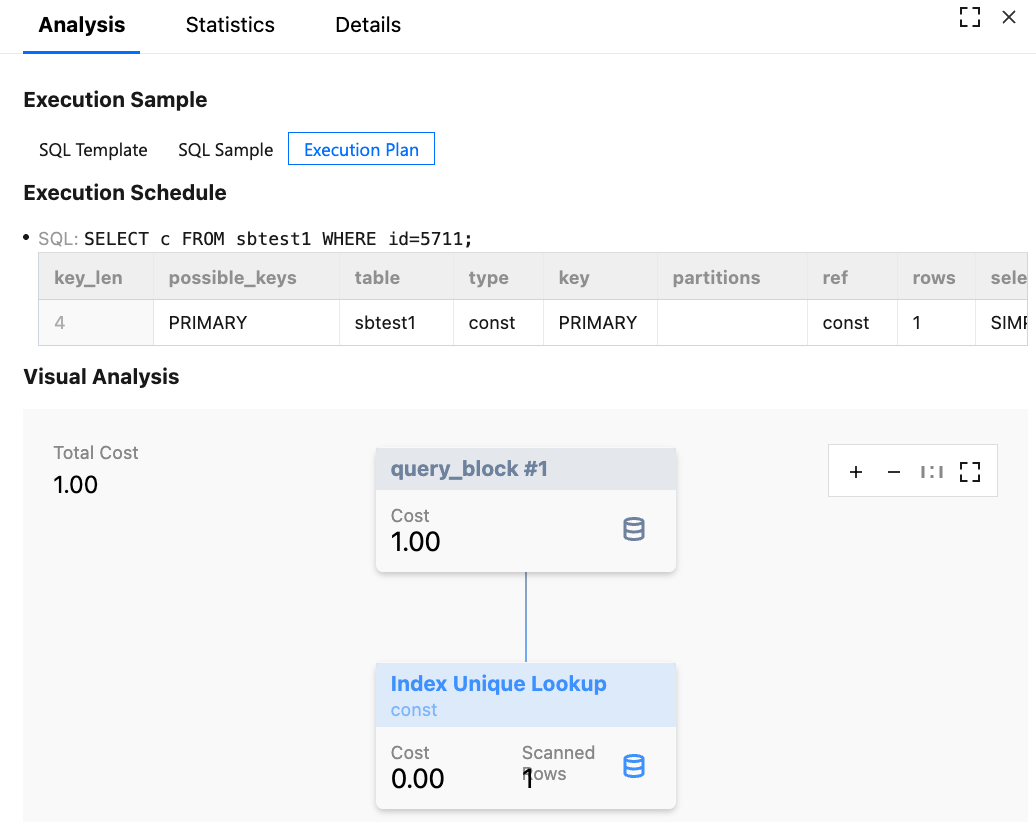
Analysis Tab: You can view comprehensive analysis information, including the complete SQL template, SQL samples, optimization suggestion, execution plans, and visual analysis. Based on the expert advice provided by DBbrain, you can optimize your SQL to improve its quality and reduce latency. Within the Analysis > Execution Plan tab, visual analysis results are provided. The visualization chart can be zoomed in, zoomed out, and displayed in full screen. You can also click on numbers and icons on the chart to view further details.
SQL Template and Representative Sample: Displays the complete template text and a representative sample for reference during tuning.
Execution Time Distribution: It displays the time consumption distribution for each execution of the template in the form of a histogram or distribution chart.
Execution Plan: It displays the execution plan for this SQL, helping to identify issues such as full table scans and missing indexes.
Execution Details: It lists details for each execution of the template, such as time, duration, scanned rows, and returned rows.
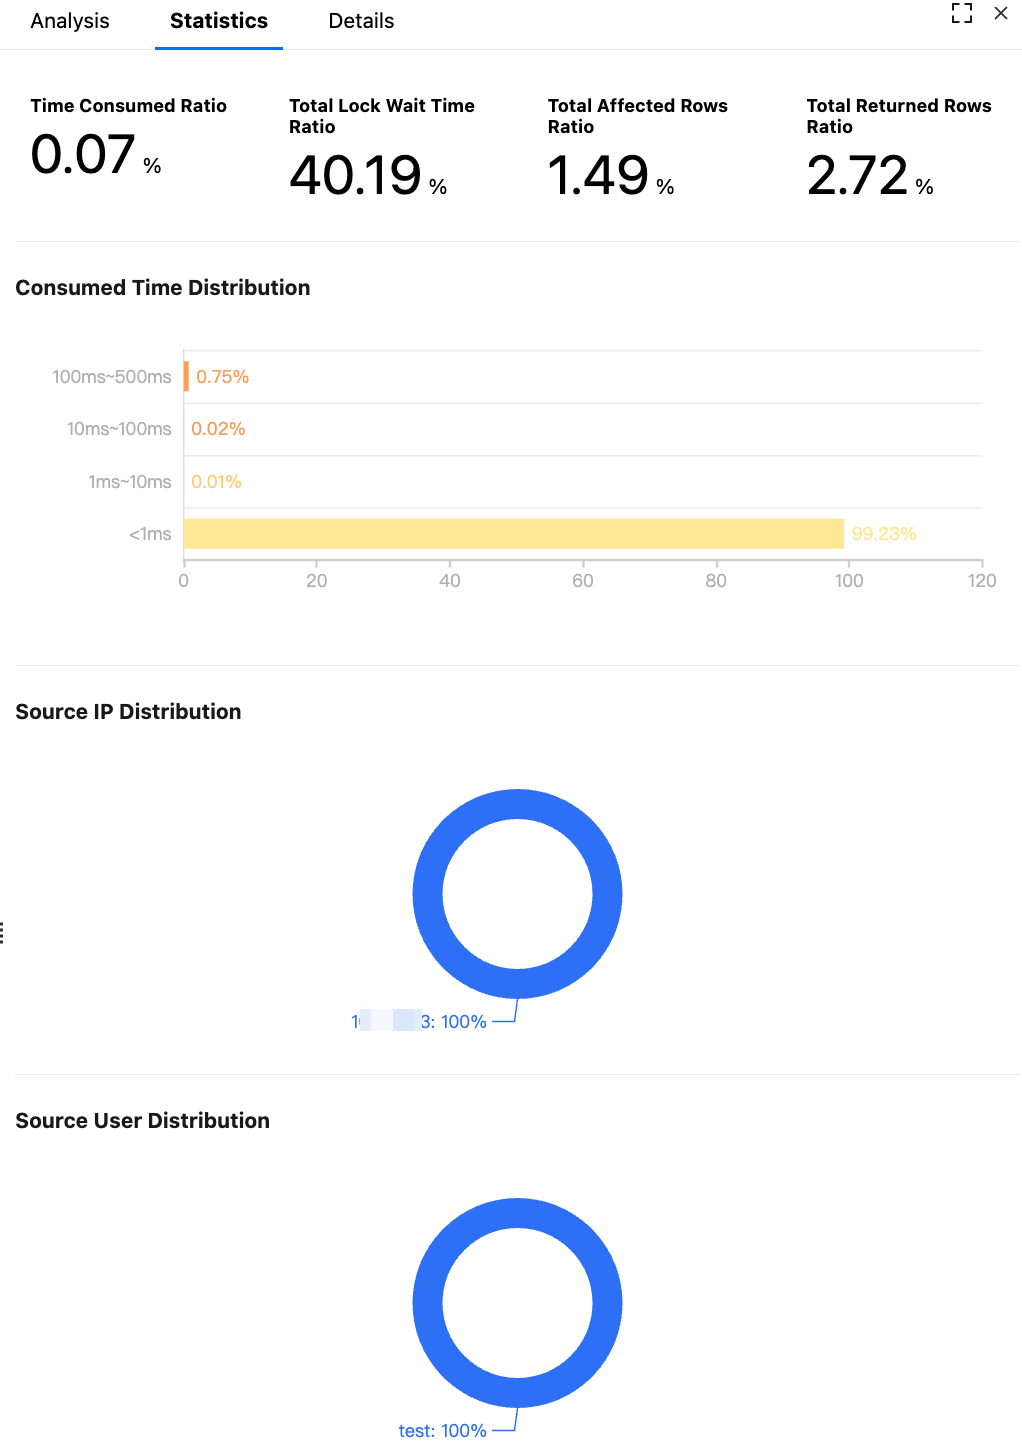
Statistics Tab: It displays the total time consumption percentage, scanned rows percentage, scanned rows, and time consumption distribution for this type of statement within your selected time period.
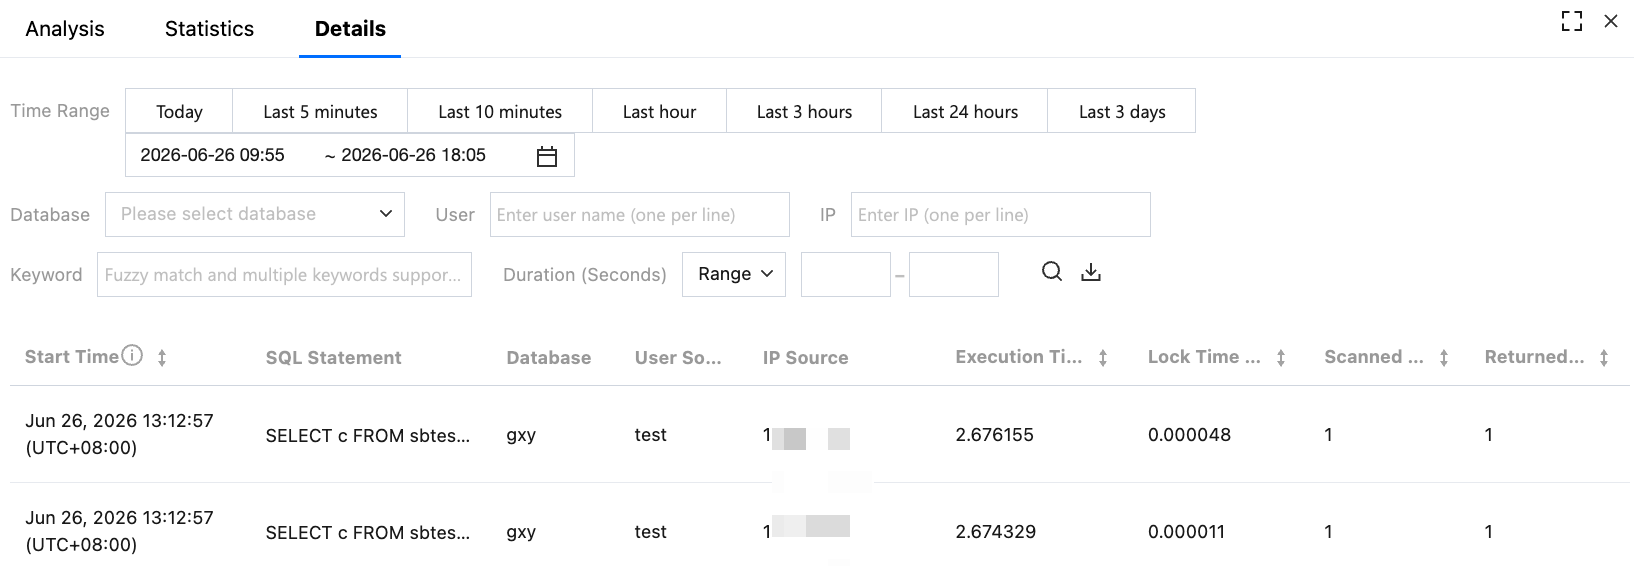
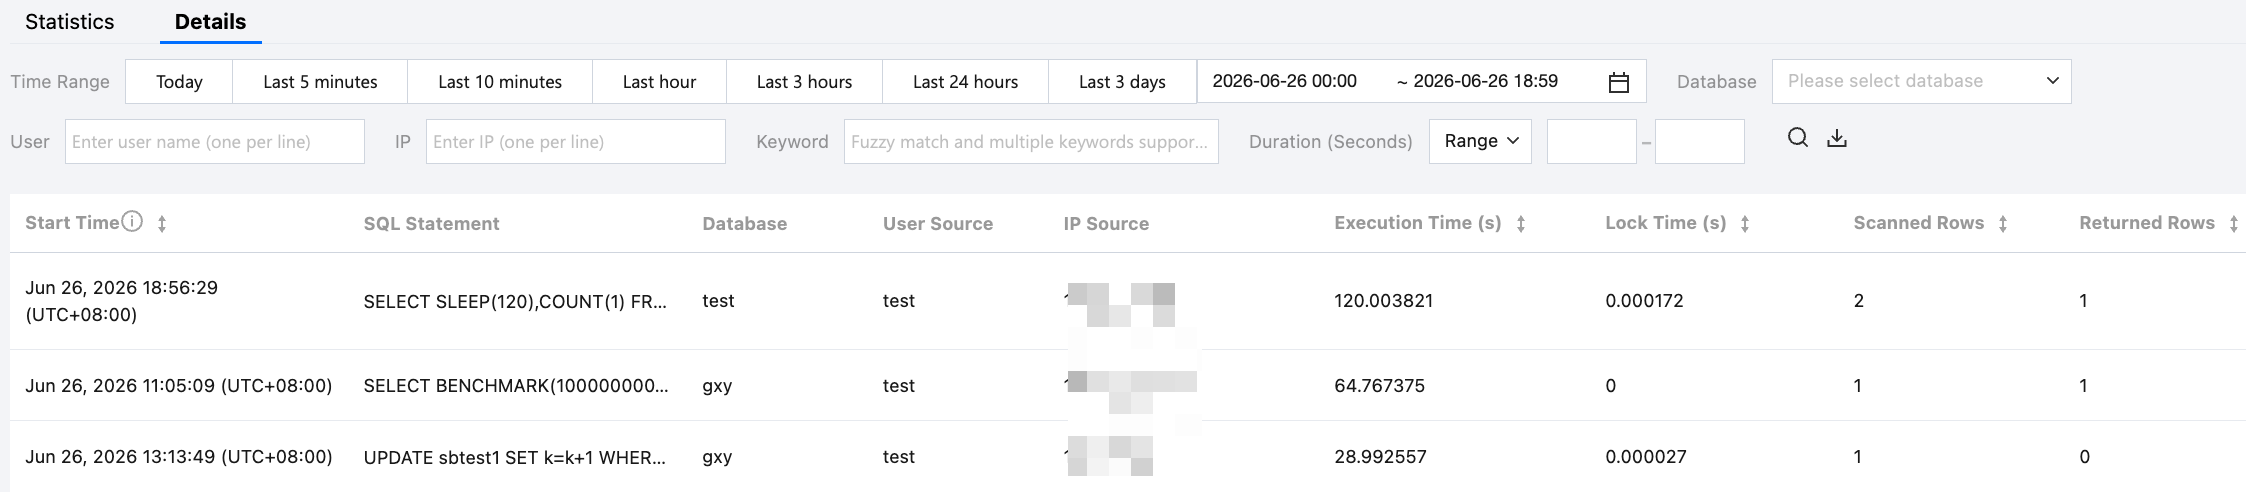
Details Tab: You can view detailed SQL execution information. For specific operations, see View Slow SQL Details.
The SQL list also supports the following operations:
Copy or View Command Template: Hover the cursor over the row containing the command template, then click Copy or View.
Clicking on a list header parameter item supports sorting in ascending or descending order: This includes items such as execution quantity, total time consumed, and average execution time (s).
6.1.2 Export the slow log list.
Click
in the upper-right corner of the slow log list to export all slow log statistics displayed in the current list. The export format is .csv.
2. In the left sidebar, select Performance Optimization, and then select the Slow SQL Analysis tab.
3. At the top of the page, select TDSQL Boundless as the database type, and then select the instance ID to be analyzed.
4. Select the Details tab.
5. Use the following conditions to filter and view detailed SQLs.
Select a time range: Supported options include Today, Last 5 minutes, Last 10 minutes, Last 1 hour, Last 3 hours, Last 24 hours, Last 3 days, or a custom time range (the earliest selectable time point is up to 30 days ago, and the maximum selectable time range is 3 days).
Filtering conditions include selecting a database, selecting a user, selecting an IP, and entering keywords.
The details list also supports the following operations:
Hover over the SQL statement to view and copy the it.
Click
at the top of the list to export the details list in .csv format. A single export is limited to a maximum of 10,000 records. To export records beyond this limit, narrow the time range and perform the export again.
Integrating with Other Analysis Features
On the Slow SQL Analysis page, you can further investigate issues by leveraging other analysis capabilities:
Click the Exception Diagnosis tab to check whether for resource-related alarms linked to the slow SQL exist within the specified time range.
Click the Real-time Session tab to confirm whether any sessions with the same template are still running.
Click the Space Analysis tab to perform a space assessment on the databases and tables involved in the slow SQL.
Following Steps
For the identified high-latency templates, perform index optimization or SQL statement rewriting based on the execution plan.
After optimization, return to this page to compare the changes in number of executions and latency before and after the optimization, thereby verifying the optimization's effectiveness.
Whether a slow SQL is collected depends on the slow log threshold set by the database kernel. Only SQL statements whose execution time exceeds the threshold are recorded in the slow log and analyzed. Additionally, due to collection latency, recently generated slow SQL may not appear immediately. You can refresh the page later to view it.
Q2: Are Slow SQL Queries with the Same Semantics but Different Parameters Merged for Display?
Slow SQL analysis performs aggregated statistics based on SQL templates (where parameters are replaced by placeholders). SQL statements with different parameters but identical semantics are grouped under the same template, facilitating the assessment of the template's impact on the overall performance of the instance.