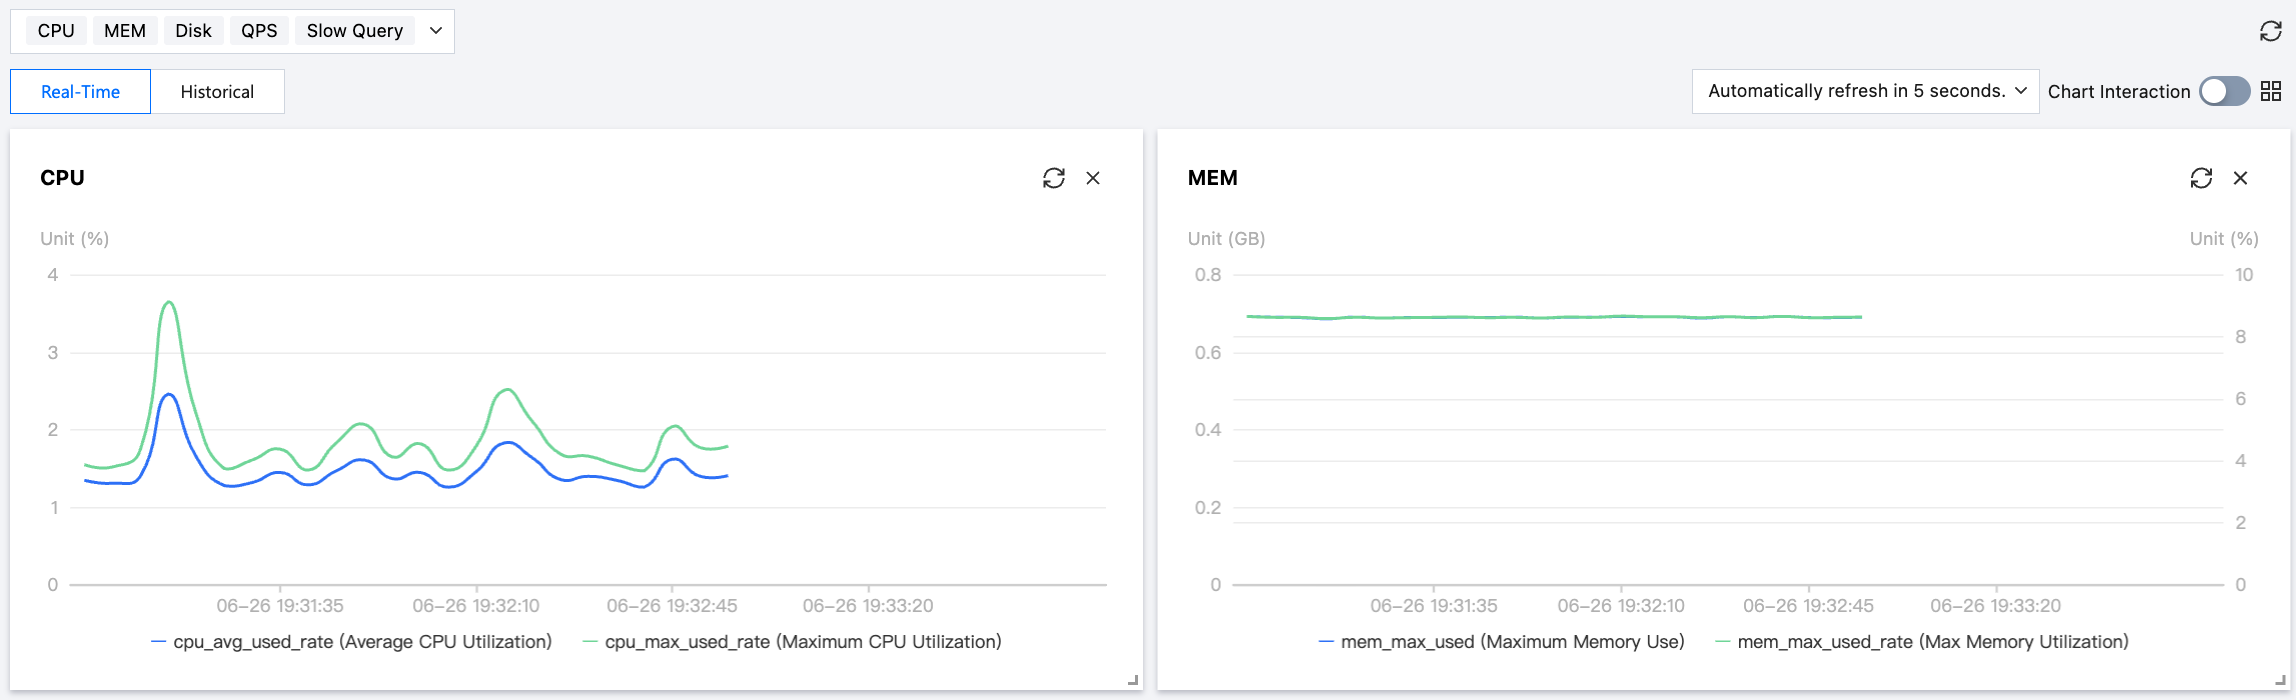
Performance trend provides multi-view monitoring capabilities organized by metric dimensions for TDSQL Boundless (TDStore engine) instances. On the same page, users can view time-series curves of key performance metrics such as CPU, memory, disk, QPS, and slow queries side by side. They can also customize metric selection and pin metrics of interest as the default view.
Scenarios
Compare and analyze instance resource usage before and after peak business hours.
Correlate and view the trends of multiple metrics, for example, to see whether a surge in slow queries is accompanied by an increase in QPS, or whether CPU usage spikes simultaneously.
When troubleshooting performance issues, cross-validate the root cause across multiple metrics.
During regular inspections, quickly review the operational status of all performance metrics.
Background Information
On the performance trend page, key performance metrics are categorized and organized by the resource monitoring dimension.
CPU: The average and maximum CPU utilization of the instance are displayed in a line chart.
MEM: The maximum usage and maximum utilization of the instance are displayed.
Disk: Disk utilization and used disk space are displayed.
QPS: The total QPS is displayed.
Slow Query: The number of slow queries is displayed.
Supported Performance Metrics
Category
Subcategory
Metric Name (English)
Unit
Description
Resource monitoring
CPU
cpu_avg_used_rate
%
Average CPU utilization within the sampling period, used to evaluate overall load.
cpu_max_used_rate
%
Peak CPU utilization within the sampling period, used to identify hotspots and skew.
Memory
mem_max_used
GB
Absolute peak memory usage within the sampling period (GB).
mem_max_used_rate
%
Percentage of the peak memory usage within the sampling period relative to the provisioned memory.
Disk
disk_total_used_rate
%
Percentage of used space / total available space.
disk_total_used
GB
Current absolute value of used disk space (data disk + log disk).
QPS
sql_com_qps
Times/second
Total number of SQL requests per second (including Select/Insert/Update/Delete).
Slow query
sql_slow_queries
Times/min
Number of slow queries per minute.
Implementation Mechanism
The performance trend obtains time-series metrics of instances through the underlying monitoring data collection pipeline and displays them in a categorized and aggregated manner on the frontend. User metric selections are saved to personal configurations and automatically loaded when the user enters the same instance again. To synchronize these preferences to other instances, you can use the "Save and Apply to All Instances" option.
Use Limits
Custom Metrics: Custom selections take effect only within the scope of the current session and persisted preferences of the logged-in account.
Notes
The curves in the performance trend are intended for trend observation only, and a single refresh may have a brief data delay. To obtain precise real-time values, please view them together with the real-time diagnostic curves on the Exception Diagnosis page.
Prerequisites
The TDSQL Boundless instance has been connected in DBbrain.
The current account has DBbrain view permissions for this instance.
2. In the left sidebar, select Performance Optimization.
3. At the top of the page, select TDSQL Boundless as the database type, and then select the target instance ID.
4. Click the Performance Trends tab.
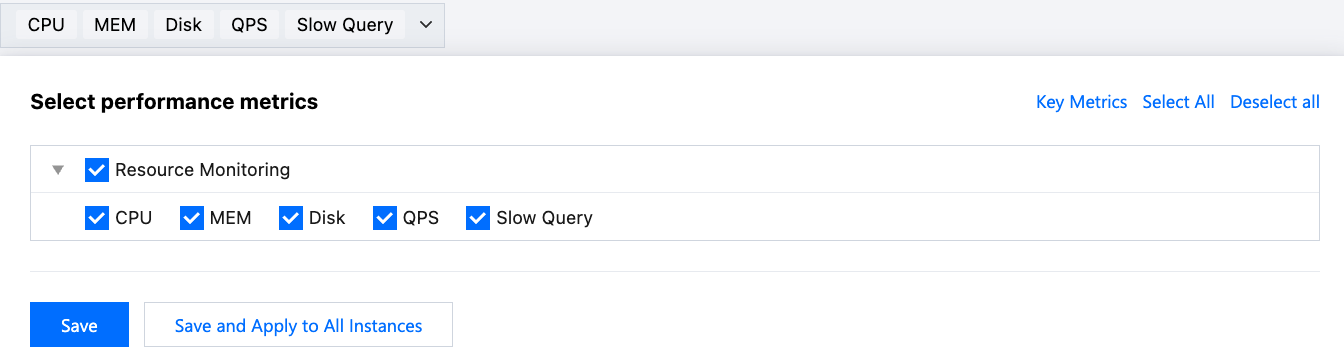
5. Select performance metrics from the drop-down list, or click Key Metrics, Select All, or Deselect All in the upper-right corner. After you select metrics, click Save.
Note:
Click Save to apply the metrics only to the currently selected instance. Click Save and Apply to All Instances to apply the selected metrics to all database instances under this account.
6. Select the time range for viewing.
Real-time view of performance trend: You can view the performance trend of the instance. Auto-refresh is enabled by default, with a refresh frequency of 5 seconds. You can also select 15 seconds or 30 seconds, or disable auto-refresh.
Historical view of performance trend: When you select a different time range, the performance trend monitoring view for the selected period is displayed. It supports quick time ranges such as the last 1 hour, 3 hours, 24 hours, and 7 days. You can also customize any continuous 7-day period within the last 30 days for viewing. This allows you to review metric changes at historical points in time.
7. View the performance trend chart. The following view methods are supported:
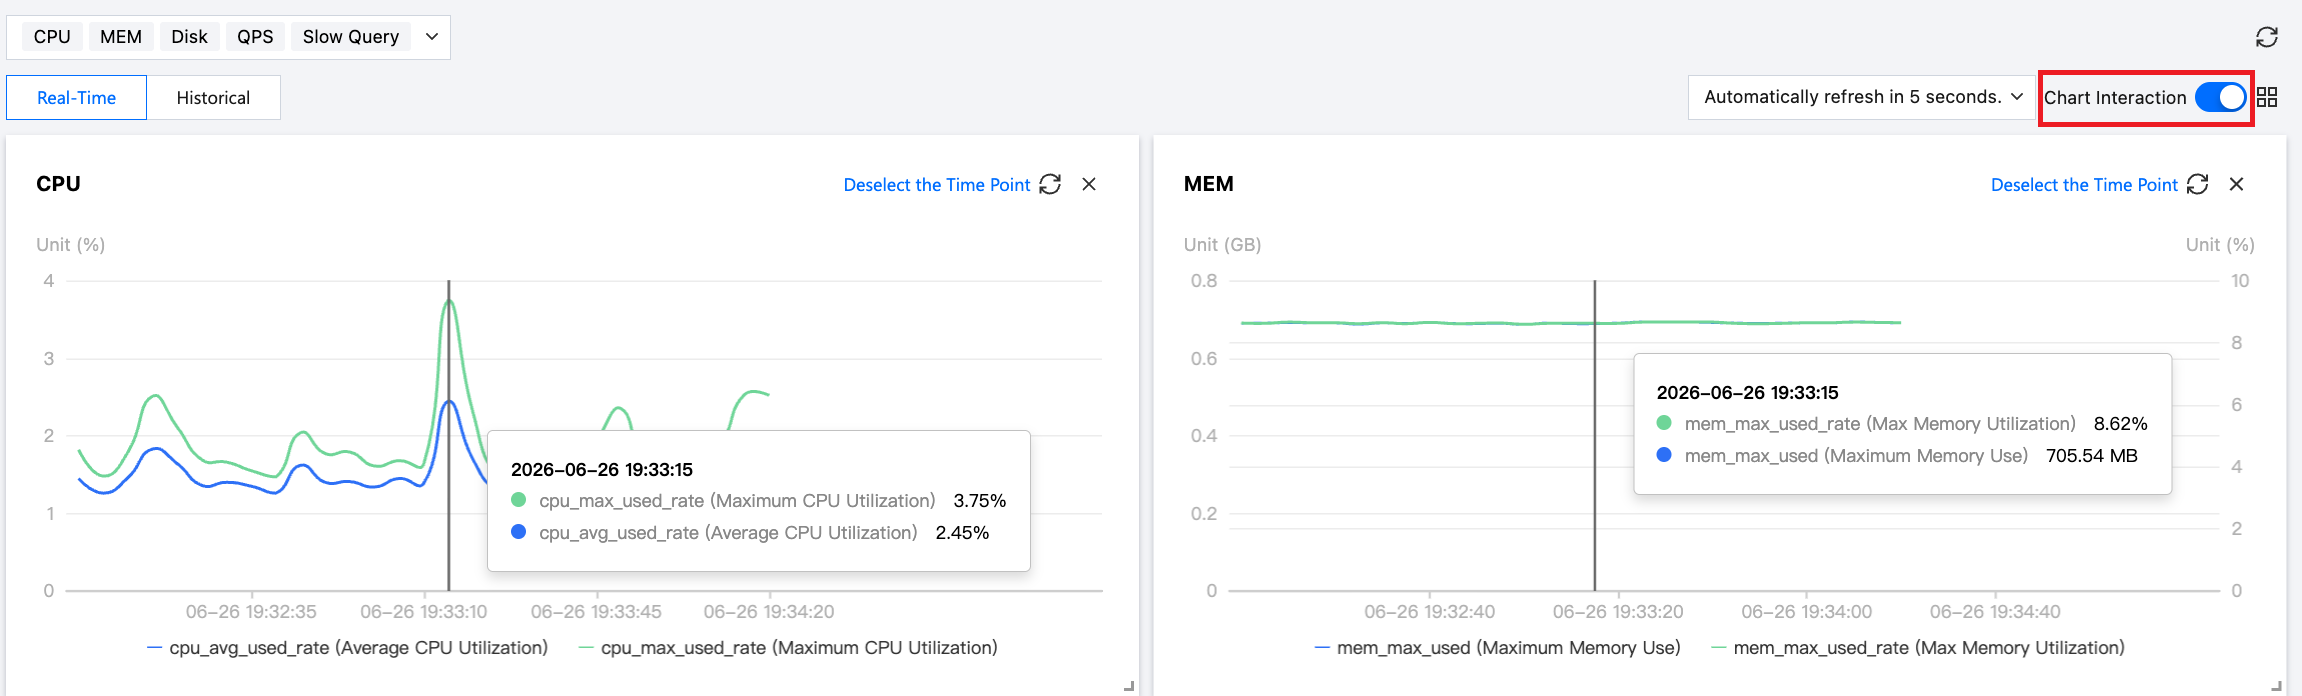
Chart Interaction: Click the Chart Interaction button on the right to view a correlated comparison of monitoring views across multiple instances and metrics.
Hover the cursor over a data point on any trend chart, and the other charts will display data for the same time point. Click to pin the data display. To unpin it, click Deselect the Time Point on the trend chart.
Switch between the one-column and two-column display modes: Click
(displayed in two-column mode) or
(displayed in one-column mode) to the right of Chart Interaction in the upper-right corner to switch display modes. The following figure shows the single-column mode.
Freely drag monitoring charts: Monitoring charts can be repositioned by dragging them. Click the border of a trend chart to move it freely within the dashboard.
Zoom in the monitoring chart: Drag the icon at the bottom-right corner of the monitoring chart to zoom in for a clearer, more fine-grained view of a single performance metric trend.
Following Steps
When a metric shows a significant anomaly, it is recommended that you go to the Exception Diagnosis page to check whether a corresponding diagnosis event exists.
If QPS and slow queries increase simultaneously, it is recommended that you go to the Slow SQL Analysis page to locate the specific inefficient SQL templates.
If disk metrics continue to rise, it is recommended that you go to the Space Analysis page to check the space usage TOP tables and fragmentation status.
Q1: Why Is There No Data for Certain Metric Curves?
This may be because the underlying monitoring system failed to collect this metric for a short period, or the selected time range is earlier than the data retention period. It is recommended that you refresh the page or adjust the time range and try again.
Q2: How to Quickly Restore the Default View?
Go to the Performance Metric Selection panel, click Key Metrics, and then save to restore the recommended default metric set.
Q3: Are Custom Saved Metric Preferences Account-Based or Instance-Based?
After saving, the changes take effect only on the current instance by default. If you select Save and Apply to All Instances, the changes are synchronized to all TDSQL Boundless instances under the current account.