Cloud Monitor Issues
Download
Focus Mode
Font Size
How to Configure "Data Pull Configuration"?
Note:
Data pull path:
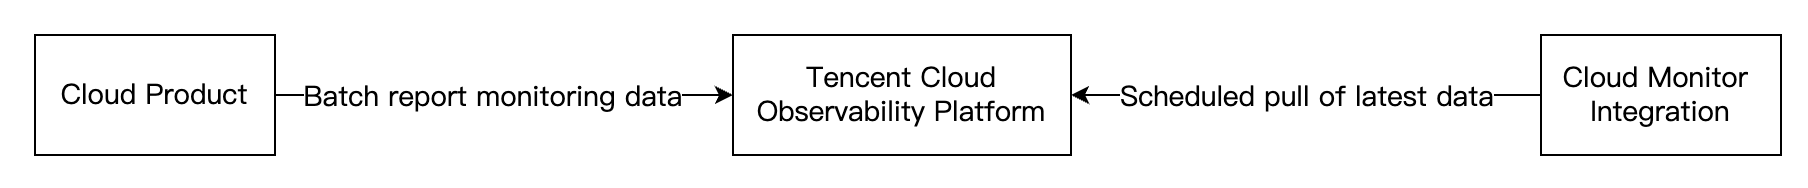
The data latency mentioned below refers to the latency from cloud products to TCOP.
If the configuration is 0, Prometheus will use the current timestamp to overwrite the original timestamp of data.
Use case: Ensure the real-timeness of data timestamps to maximize the timely issuance of alarms by Prometheus.
If the configuration is a value x greater than 0:
As long as the value is greater than 0, Prometheus will retain the original timestamp of the data.
Use case: Align with the timestamps on the cloud product console's monitoring page.
Time window for delayed data pulls (latency equals x).
Background: To be compatible with the latency of monitoring data reporting links of cloud products, Prometheus pulls data within the time range of
(now-fixed latency, now) by default.Use case: If the reporting link latency of certain products is too high, set x here to change the time range for pulling data to
(now-fixed latency-x, now-x), to ensure that data can be retrieved to the greatest extent possible within this delayed window.Data Occasionally Generates a 1-2 Minute Interruption?
Data Collection Latency is 0: This does not usually cause breakpoints. When a breakpoint occurs, submit a ticket.
Data Collection Latency is not 0: Check the integration logs. If there are no obvious errors, the breakpoints may be caused by latency fluctuations. In this case, observe the latency when metrics are normal, and reset Data Collection Latency to that latency value (such as set to 180 for a 3-minute latency). If the breakpoint issue persists, submit a ticket.
Note:
Resetting the Data Collection Latency affects all cloud products in the current integration. If only specific cloud product data has breakpoints, it is recommended to create a new integration separately.
Latency fluctuation: For some cloud product monitoring data, the latency is not stable. When the latency suddenly decreases, it means multiple data points are persisted within one minute. However, the Cloud Monitor integration only collects the latest data point per minute, which results in breakpoints.
Does the Data Not Match the Cloud Product Console's Monitoring Page?
This is usually because the Data pull configuration is set to 0. When the original timestamp of the data is ignored, delays in cloud product monitoring data cause mismatches in data points at the same time.
The data value at 12:00 in Prometheus corresponds to the value at 11:58 on the cloud product console's monitoring page?
Cloud products report data to TCOP with a few minutes of latency. For example, when Prometheus pulls data at 12:00, the timestamp of the latest data point it retrieves might be 11:58 (assuming a 2-minute data delay). Prometheus will ignore this timestamp and treat it as data for 12:00.
The value at 11:59 on the cloud product console's monitoring page cannot be found in Prometheus.
Continuing the previous example: When Prometheus pulls data at 12:01, the latest timestamp it retrieves remains 11:58 (some cloud products exhibit significant latency fluctuations, such as occasional delays up to 3 minutes). Since the original timestamp is ignored, Prometheus still treats it as data for 12:01. When Prometheus pulls data at 12:02, it retrieves a data point with a timestamp of 12:00 (when latency returns to 2 minutes, intermediate data points may be missing) and treats it as data for 12:02. This results in the missing value for 11:59.
To avoid the issues mentioned above, you can set Data Collection Latency to a non-zero value. For specific configuration instructions, refer to How to Configure "Data Pull Configuration" and Occasional 1-2 Minute Breakpoints in Data.
Are There Issues with Targets Display?
No collection objects: It takes a few minutes for newly created integrations to display the correct Targets.
(1/2) down: During rolling updates of the integration, the old pod continues collecting data until the new pod is successfully running, resulting in two Targets being displayed temporarily.
Certain Cloud Product Failed to Collect Metrics
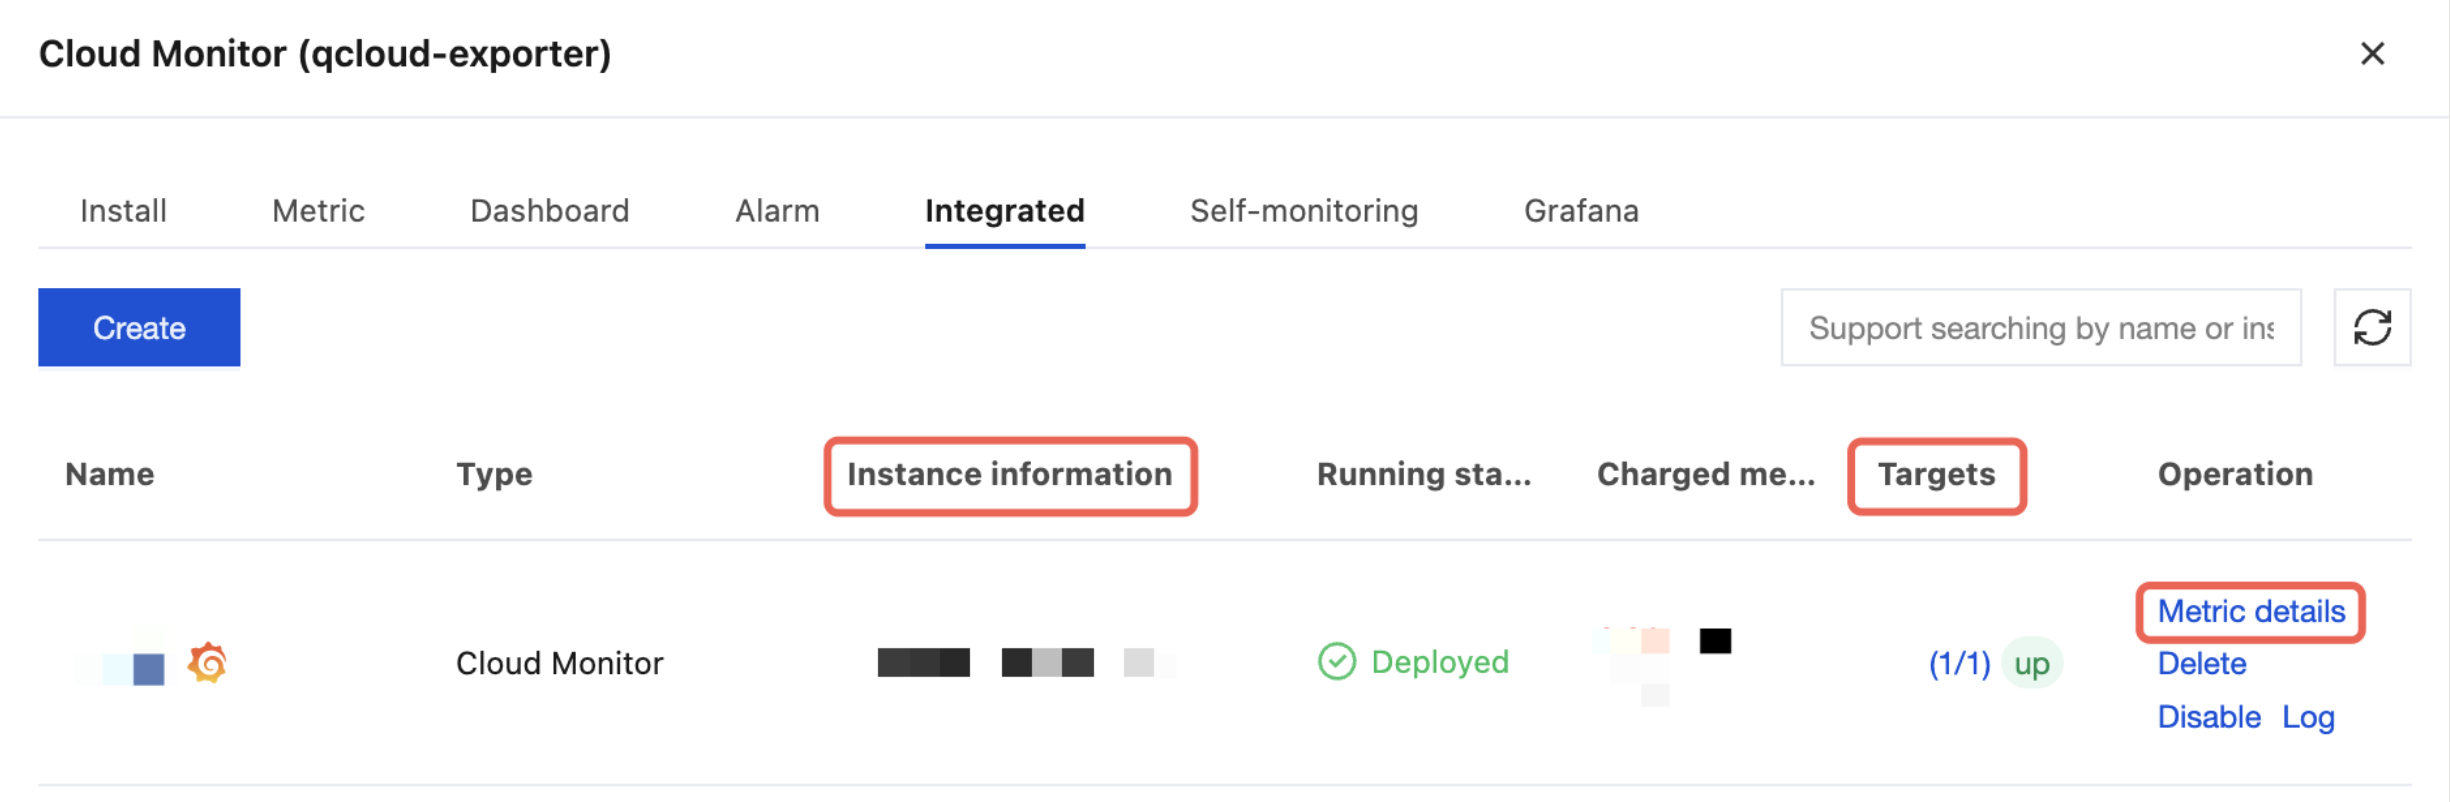
1. On the Integrated tab, you can check the following information:
Instance information: Check whether it contains the cloud product. If not, it means the cloud product was not selected.
Ensure that Targets are in up status.
Metric details: Check whether there are metrics for the cloud product. If there is, wait for a minute before querying again.
2. Ensure that there are cloud product instances in the selected region.
3. Check whether Instance ID filtering or Cloud Tag Key Filtering is configured, and ensure that the corresponding configuration can retrieve instances of this cloud product.
4. Check whether Metric Relabel Configuration is set up, and ensure that the corresponding configuration does not filter out metrics of this cloud product.
How to Restart the Integration/Update the Integration Version
Note:
This operation may result in the loss of at most one data point.
Integrations created via Terraform should not be operated through the console, as this may cause changes to the value of the content parameter.
Console
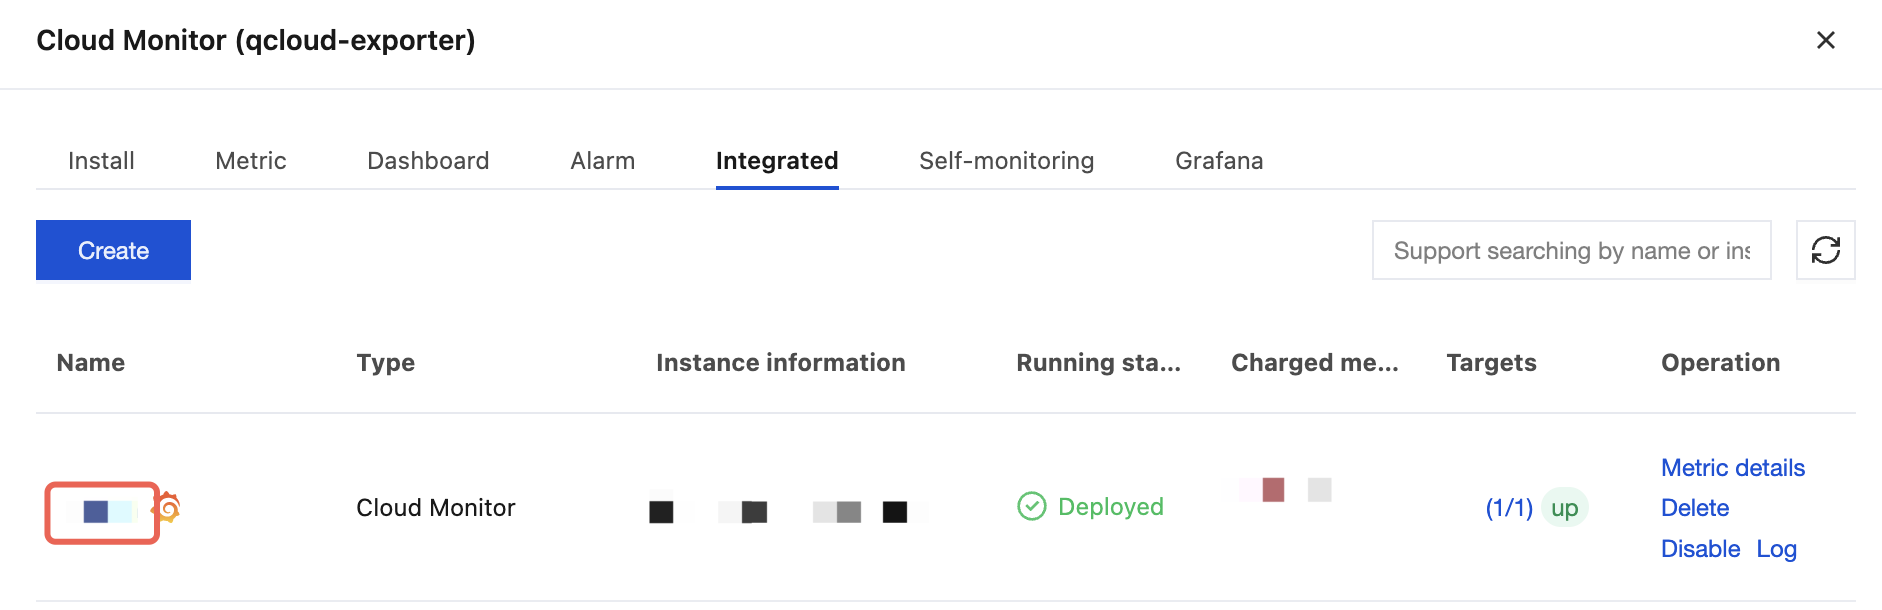
1. Under Integrated, click the name of the integration you want to operate on to navigate to the integration edit page.
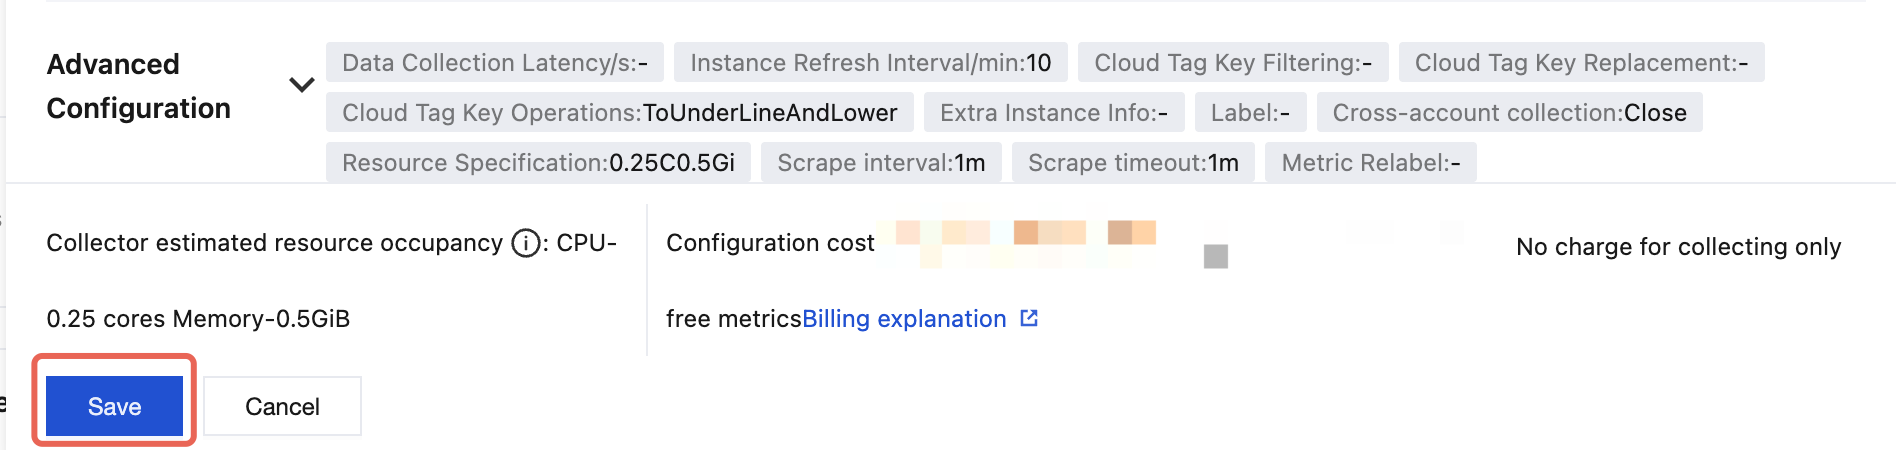
2. Click Save directly.
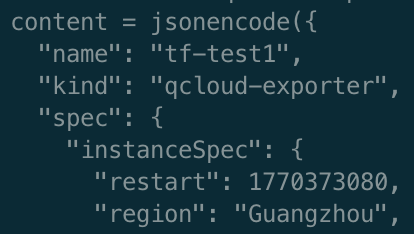
Terraform
Add the spec.instanceSpec.restart field to the content parameter, fill in the current timestamp, and update directly.
Help and Support
Was this page helpful?
You can also Contact sales or Submit a Ticket for help.
Help us improve! Rate your documentation experience in 5 mins.
Feedback