Overview
DMC provides multi-dimensional monitoring, including database status information, InnoDB storage engine row operations, database connections, and traffic, enabling users to stay informed about the performance status of database instances.
Directions
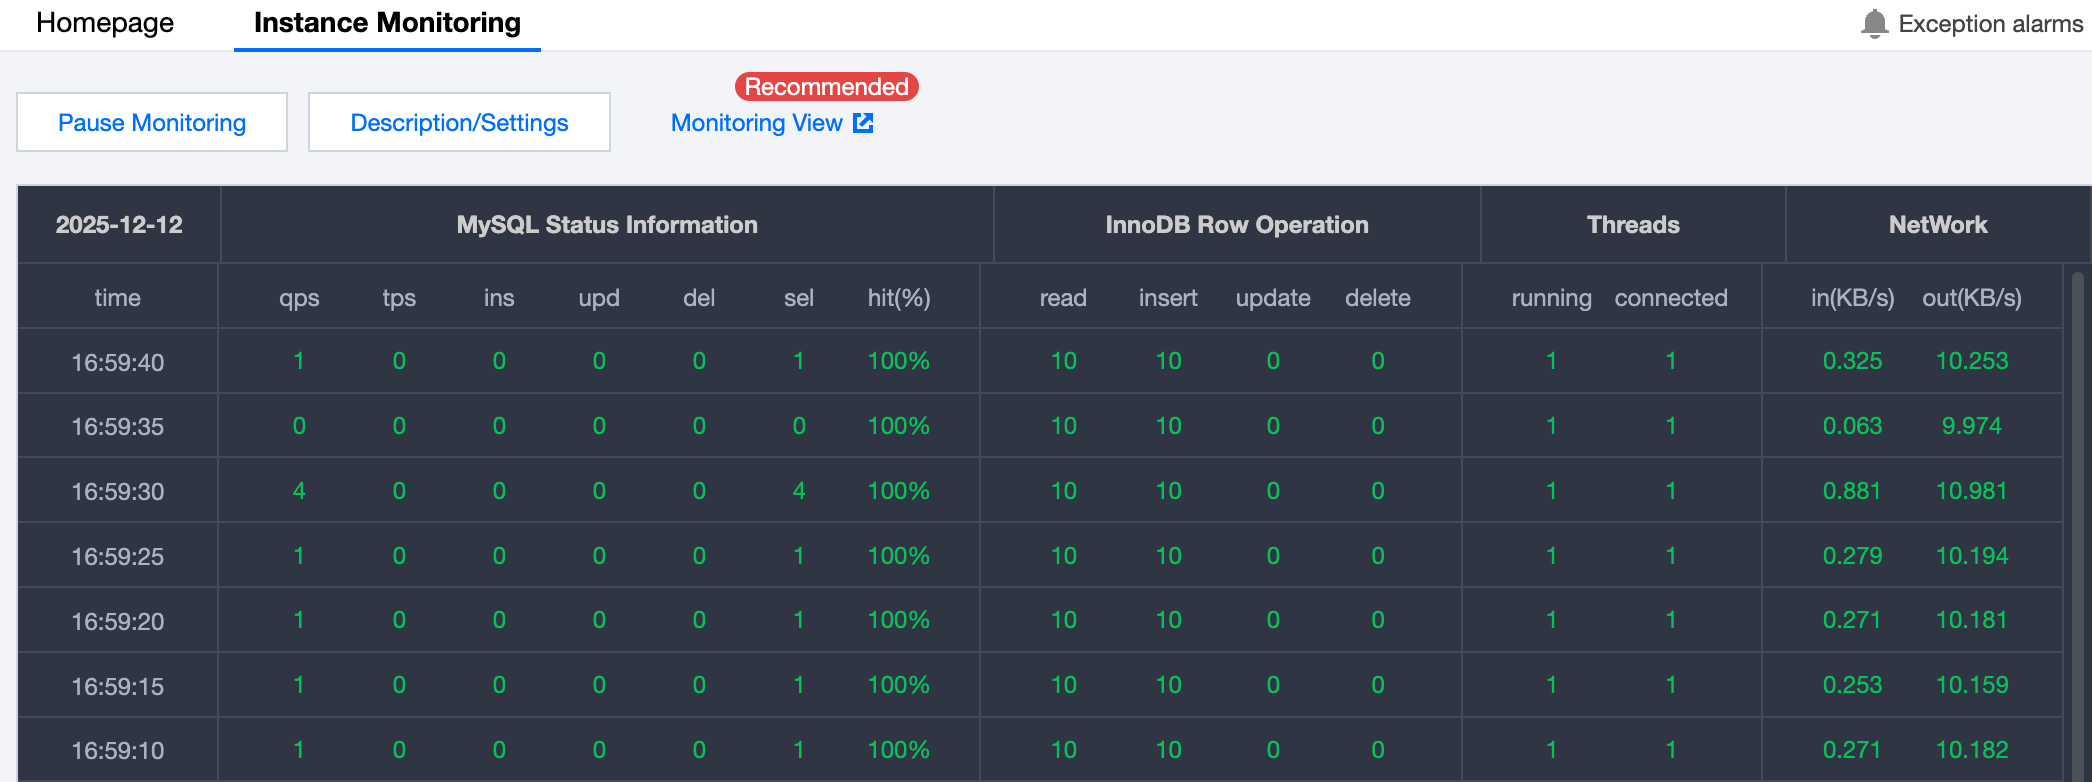
1. Log in to the DMC Console, switch to the top feature tab, and click Instance Monitoring. 2. Click Pause Monitoring to cancel instance monitor.
Performance Metrics Description
MySQL Status Information
[qps] indicates the number of queries responded per second
[tps] indicates the number of transactions processed per second
[ins] indicates the number of INSERT statements executed per second
[upd] indicates the number of UPDATE statements executed per second
[del] indicates the number of DELETE statements executed per second
[sel] indicates the number of SELECT statements executed per second
[hit%] indicates the cache hit rate, which mainly refers to the hit rate of innodb_buffer_pool
InnoDB Row Operation
[read] indicates the number of rows read in the InnoDB storage engine table
[insert] indicates the number of rows written in the InnoDB storage engine table
[update] indicates the number of rows updated in the InnoDB storage engine table
[delete] indicates the number of rows deleted in the InnoDB storage engine table
Thread: connections
[running] indicates the number of active connections, i.e., the number of connections where SQL statements are being executed
[connected] indicates the number of idle connections to the instance, i.e., the number of connections where SQL statements have not been executed
Network: network traffic in KB
[in] indicates the inbound network traffic of the instance
[out] indicates the outbound network traffic of the instance