tencent cloud

Business Intelligence

Product Introduction
Product Overview
Strengths
Product Features
Use Cases
Purchase Guide
Billing Instructions
Purchase Guide
Upgrade Instructions
Renewal Instructions
Quick Start
Data Access
Creating a VPC Data Source
Creating Cloud Data Sources
Creating Proprietary Data Sources
Data Table Creation and Data Processing
Introduction to Data Analysis Basics
Data Table Creation
Data Processing
Data Analysis
Analysis Settings
Interactive Analysis
Ad-Hoc Analysis
Data Visualization
Public Style Setting Instructions
Filter Components
Chart components
Rich Text Component
Other Components
Mobile Terminal Layout Editor
Theme Settings Introduction
Page Layout Introduction
Dashboard Directory Management
Collaboration and Application
Push Channel Management
Report Push
Sharing
Embedding
Self-Service Data Retrieval
Metric Alarms
Data Security
Parameter Construction
Platform Management
Account and Permission Management
Statistics and Analysis
System Settings
Resource Migration
Practical Tutorial
Collection of Optimization Practices
Performing Trend Analysis
Performing Proportion Analysis
Performing Data Analysis with Excel Files
Creating Tables
API Documentation
History
Introduction
API Category
Making API Requests
Project Management APIs
Role APIs
Database Table APIs
Report Embedding APIs
Page Management APIs
Data Types
Error Codes
FAQs
Relevant Agreements
Service Level Agreement
Privacy Policy
Data Privacy And Security Agreement
Contact Us

Proportion

PDF
Focus Mode
Font Size
Last updated: 2025-09-19 15:14:20
When calculating metrics, you can use the proportion calculation method to quickly obtain the relationship between the current value and the overall value.
If A has an income of 100, B has an income of 200, and C has an income of 150, then the income proportion of B is 44.44% (200/(100+200+150)).
Use case: Calculate the proportion of the current metric value in the overall value. For example, calculate the income proportion of the employee Zhang San among all employees.
Edition support: All editions.
Through this document, you will learn the following:
Total Proportion
Intra-group Proportion

Total Proportion

The total proportion calculates the ratio of the current value to the sum of all values. The following example demonstrates how to use the total proportion:
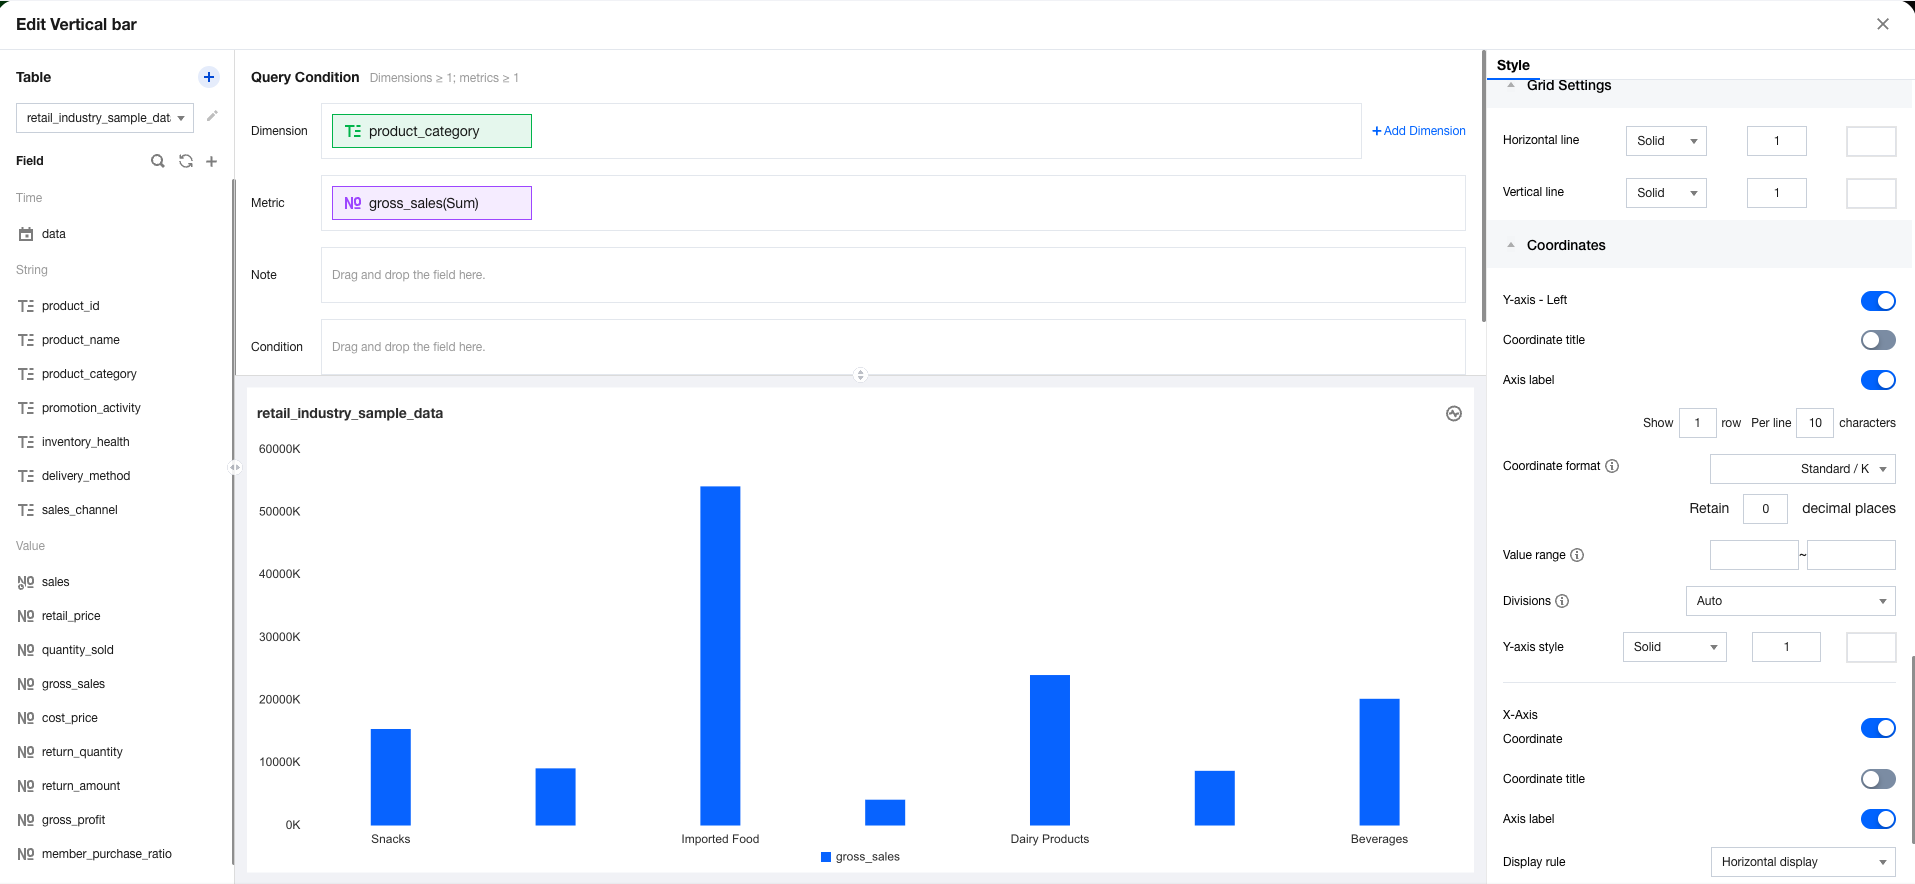
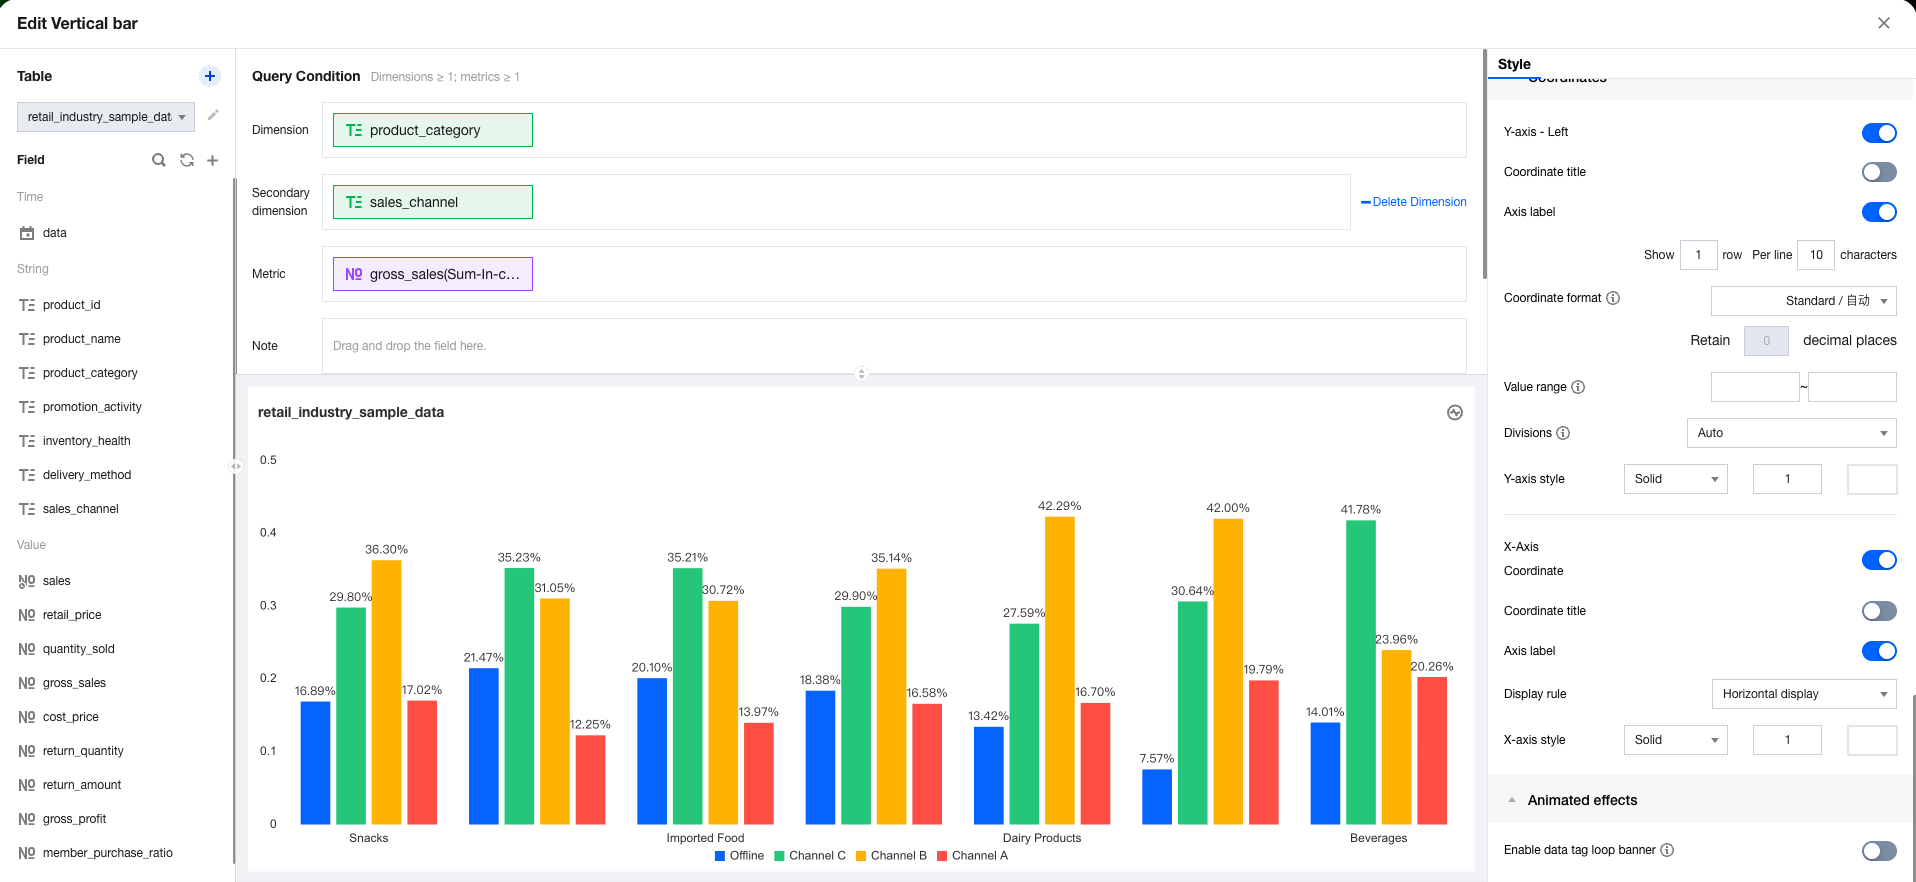
1. Enter the canvas, add a column chart component, then set the dimension and metric.


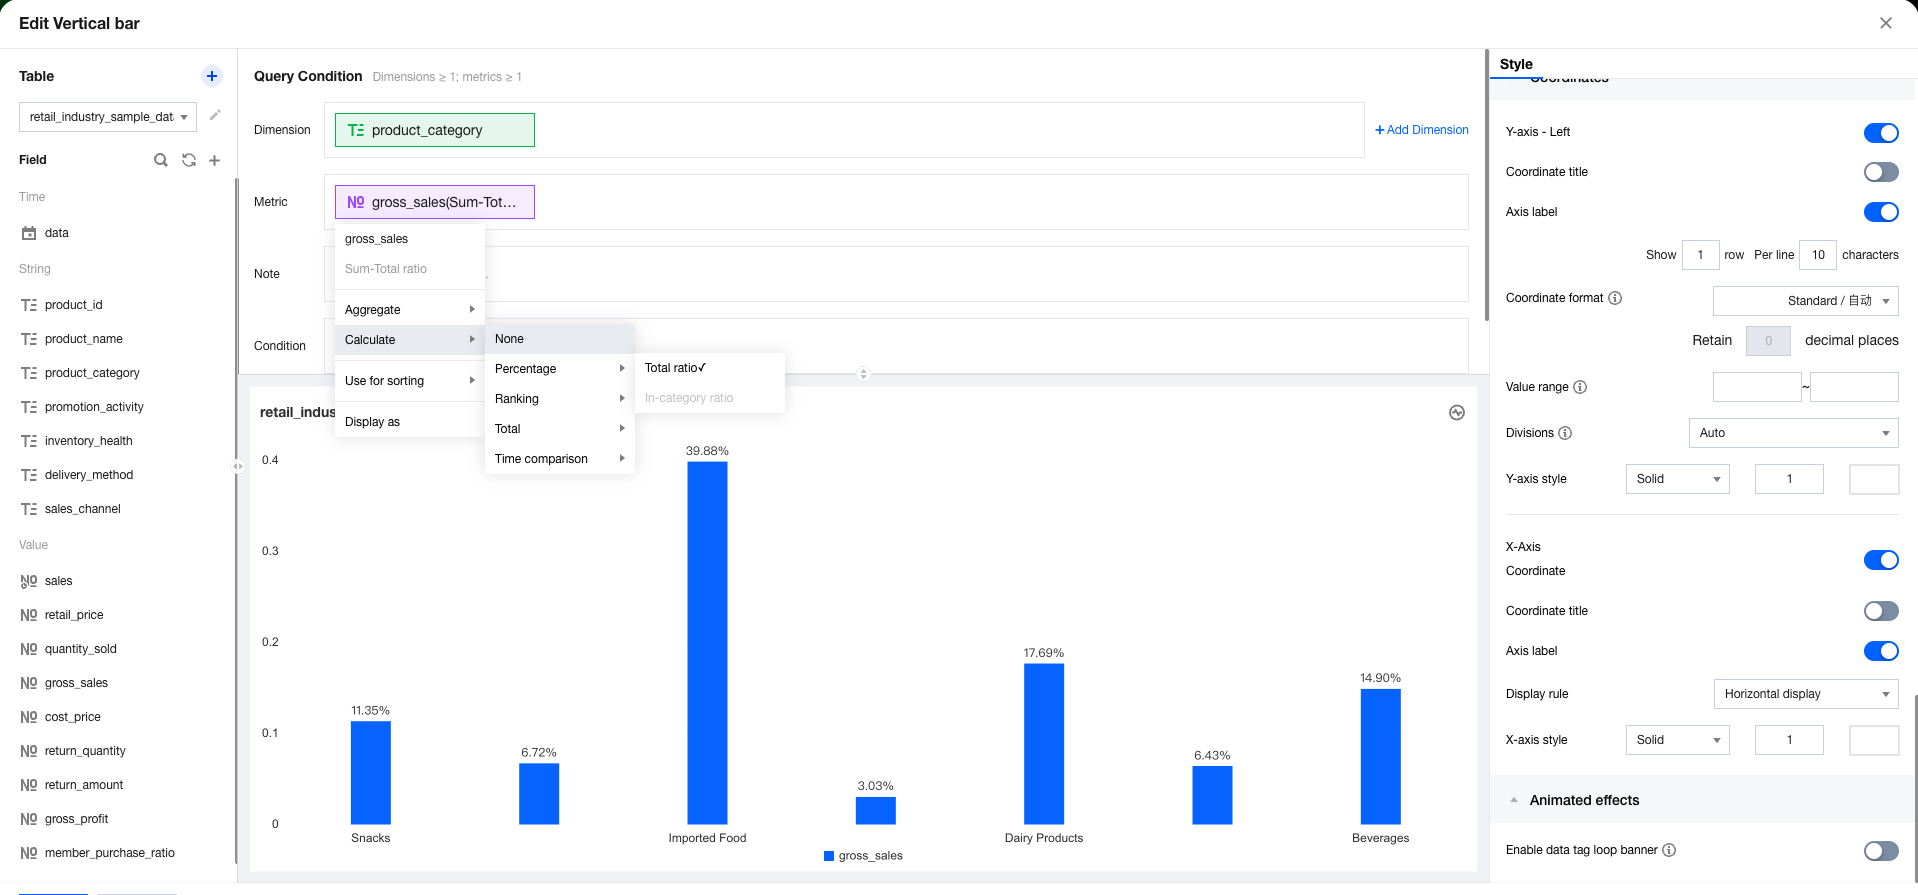
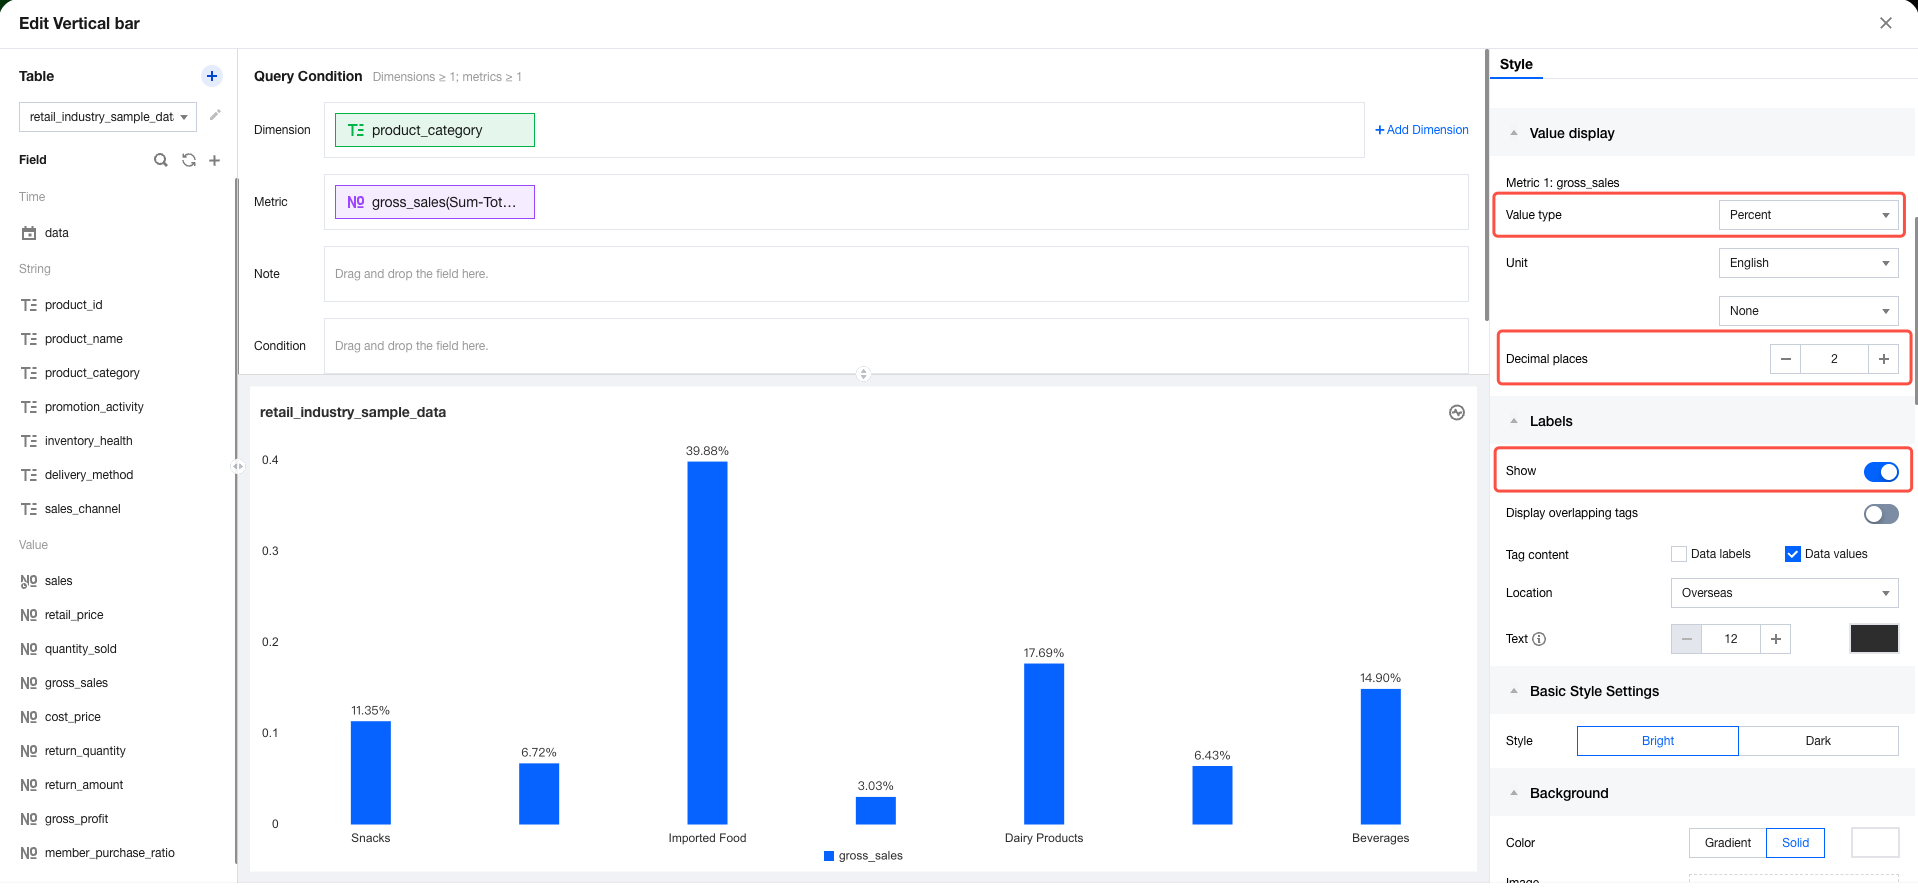
2. In the metric field, sequentially select quick calculation > Proportion > Total Proportion


3. In the style panel, set the value display and format the value as a percentage with 2 decimal places.


Intra-group Proportion

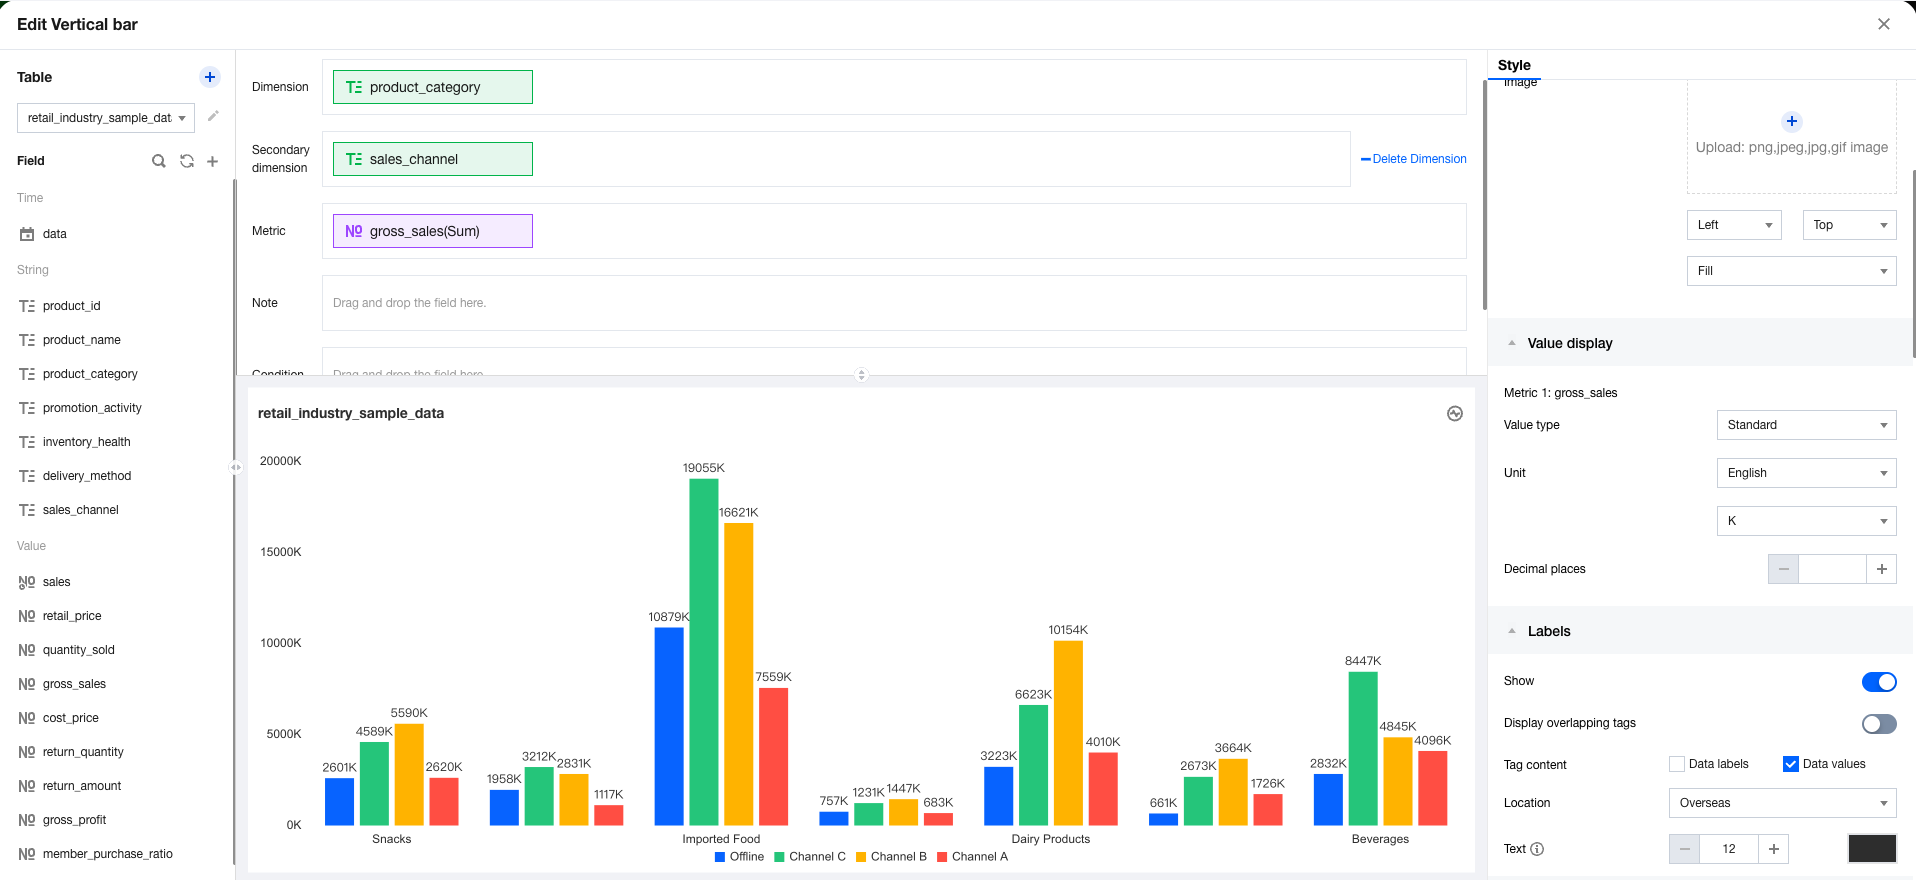
The intra-group proportion calculates the ratio of the current value to the sum of all values across all groups. The following example demonstrates how to use the intra-group proportion:
1. Enter the canvas, add a column chart component, then set the dimension, sub-axis, and metric.


2. In the metric field, select quick calculation, Proportion, and then Intra-group Proportion sequentially.


Note: When no group is available, you are unable to select "Intra-group Proportion".


Help and Support

Was this page helpful?

Help us improve! Rate your documentation experience in 5 mins.

Feedback