When calculating metrics, you may need to compare current data with historical data to analyze changes. For example, you may need to calculate the growth rate of income in May 2024 compared to income during the same period last year (May 2023).
Multiple comparison modes are available:
1. Year-over-year comparisons: Compare values for the same period. For example, the annual year-over-year comparison for January 2024 compares values from January 1–31, 2024, against those from January 1–31, 2023.
2. Period-over-previous period comparisons: Compare values of the current period with those of the previous period. For example, the month-over-month comparison for March 2024 compares values from March 1–31, 2024, against those from February 1–28, 2024.
3. Dynamic year-over-year/period-over-previous period comparisons: Dynamically adjust the time period according to the time period selected by the user in the filter. For example, if the user selects January 2–3, 2024 in the filter, the annual month-over-month comparison will compare values from this period against those from December 2–3, 2023 (the lengths of the 2 time periods remain the same).
4. Custom comparisons: Customize the selection of the time period and the time period for comparison. For example, you can compare values from the current day against those from last week (the lengths of the 2 time periods may not be the same).
Use case: Compare data by time. For example, the operations personnel compare the income of this month against the income of the same month last year.
Edition support: All editions.
Through this document, you will learn the following:
Year-Over-Year Comparisons
Period-Over-Previous Period Comparisons
Dynamic Year-Over-Year/Period-Over-Previous Period Comparisons
Custom Comparisons
Year-Over-Year Comparisons
Year-over-year comparisons allow for calculating values from the current period against those from the same period in the previous year. Annual year-over-year comparison, annual quarter-over-quarter comparison, annual month-over-month comparison, and annual week-over-week comparison are supported.
Note:
1. To use year-over-year comparisons, at least 1 time field is required in the dimension. Otherwise, year-over-year comparisons are unavailable (if multiple time fields exist, take the first time period);
2. The available granularities of year-over-year comparisons are determined by the aggregation granularity of time dimension fields. The relationship between time aggregation and available year-over-year comparisons is shown below:
Time Dimension Aggregation | Available Year-Over-Year Comparisons (Only Granularities That Are Greater Than the Granularity of Time Aggregation Are Available) |
Year | - |
Quarter | Annual year-over-year comparison |
Month | Annual year-over-year comparison and annual quarter-over-quarter comparison |
Week | Annual year-over-year comparison, annual quarter-over-quarter comparison, and annual month-over-month comparison |
Day | Annual year-over-year comparison, annual quarter-over-quarter comparison, annual month-over-month comparison, and annual week-over-week comparison |
Hour, minute, and second | Not supported yet |
The following example illustrates how to use year-over-year comparisons:
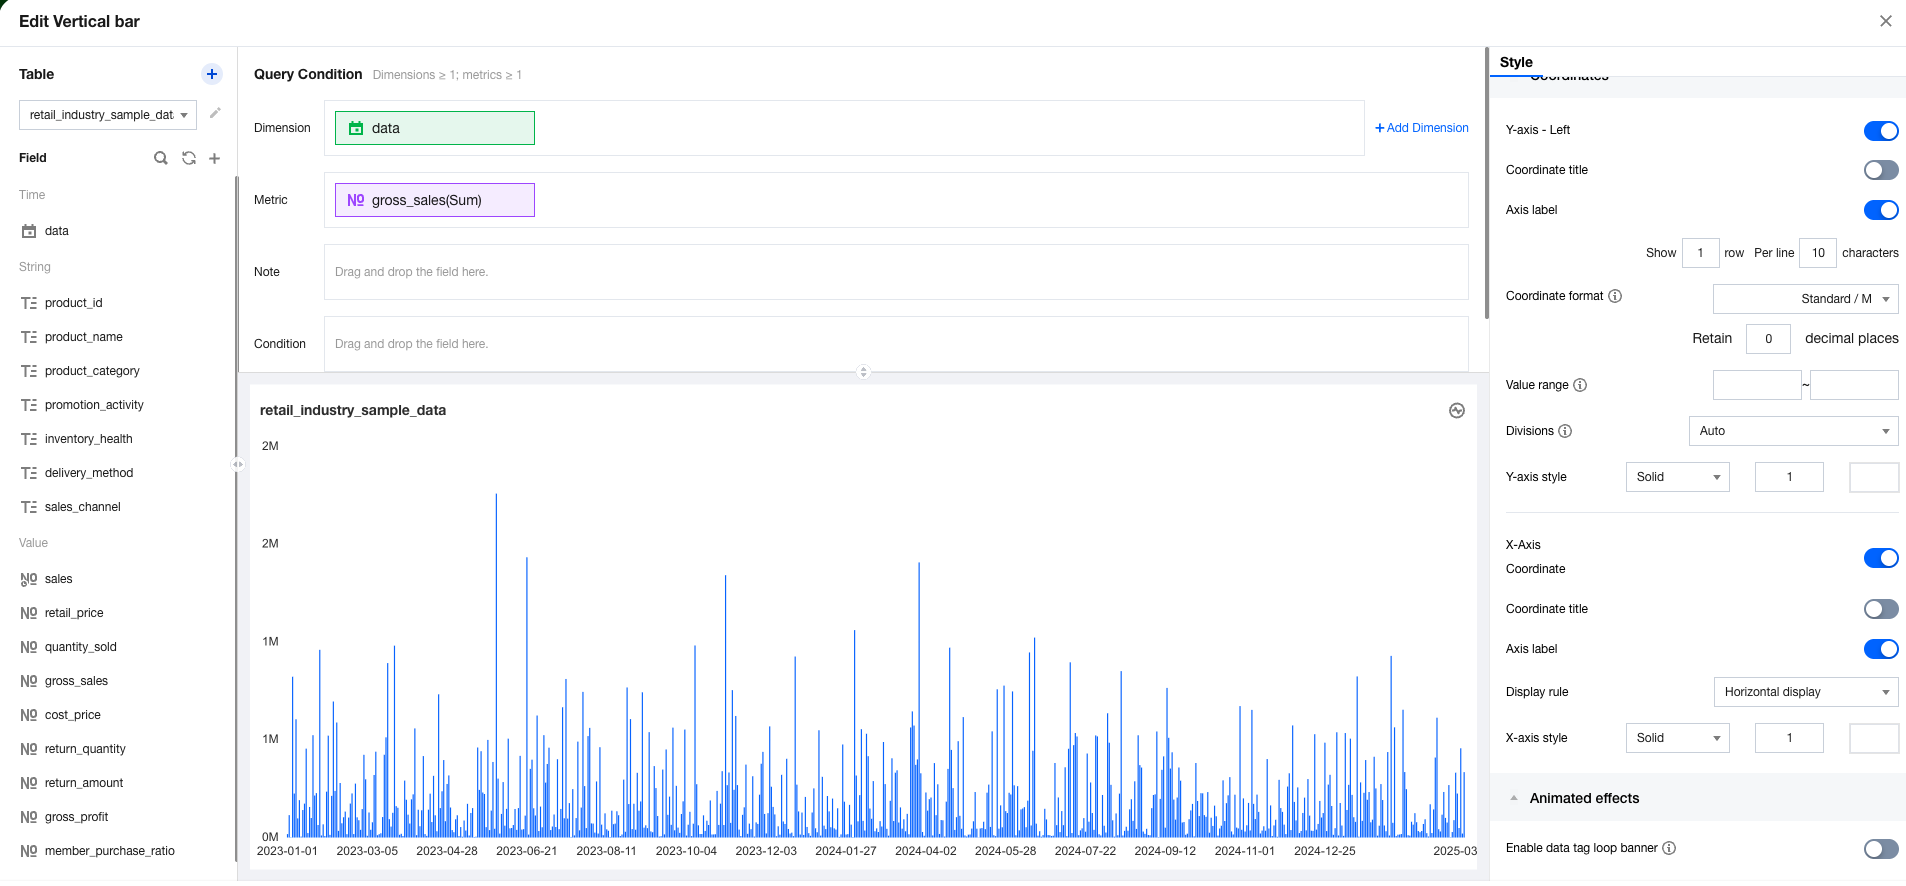
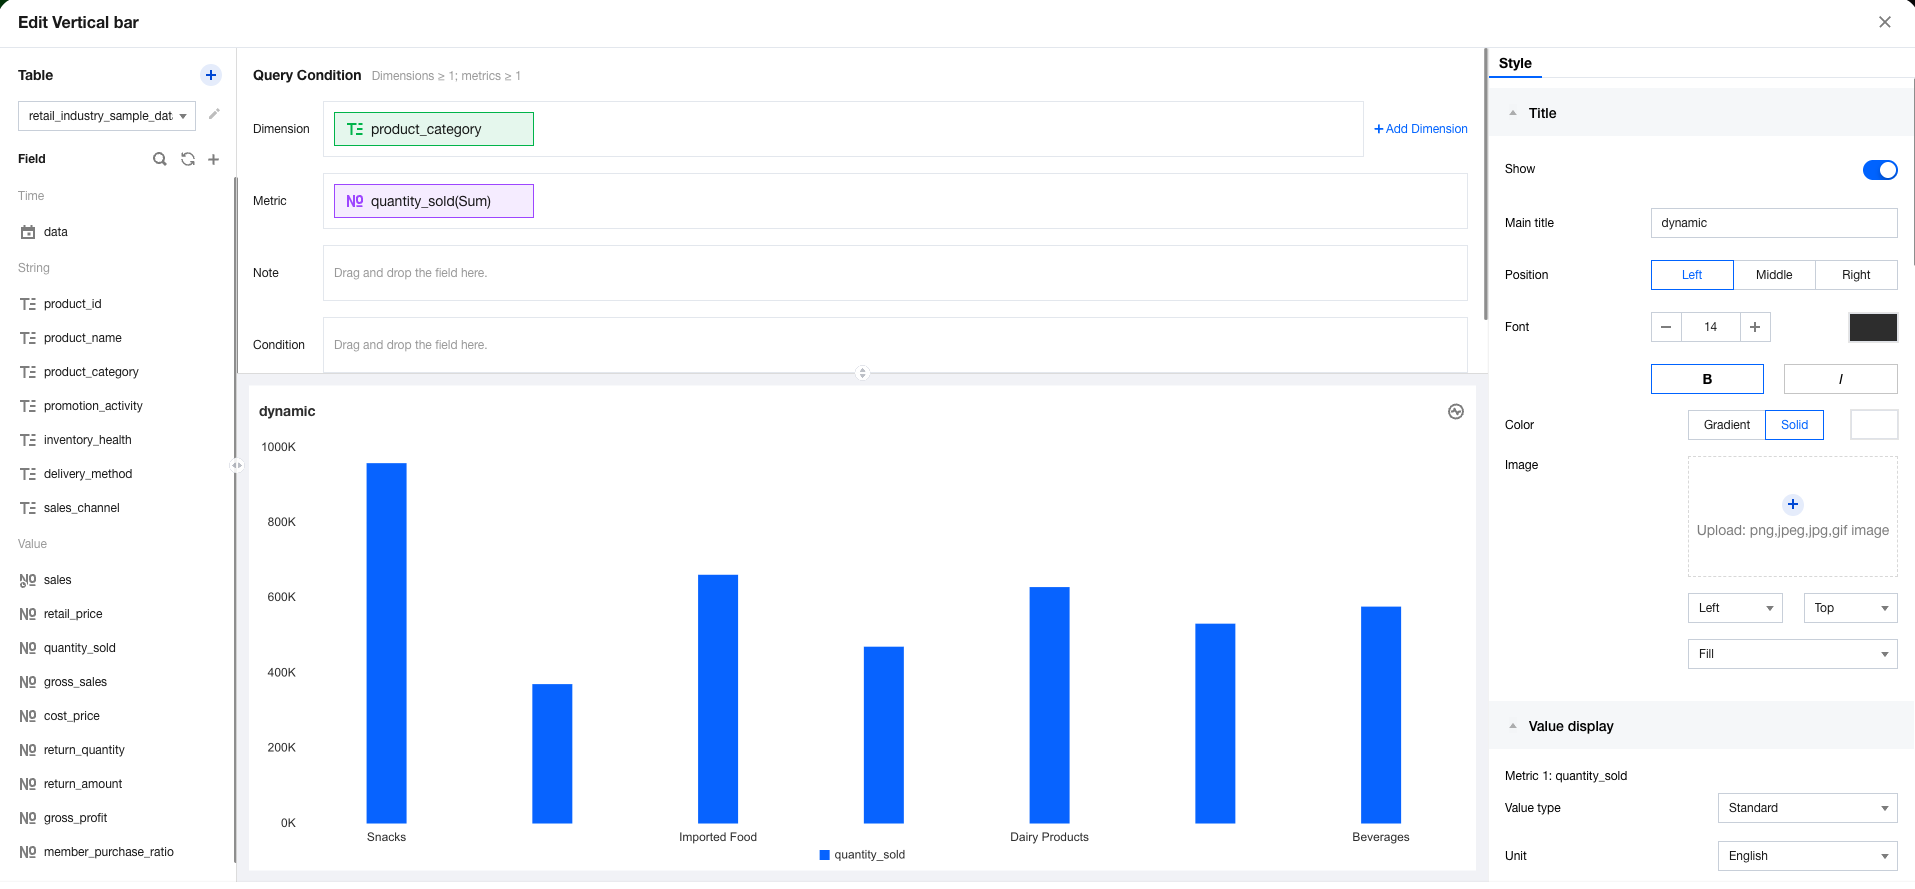
1. Enter the canvas, add a column chart component, set the dimension to time dimension, and metrics.
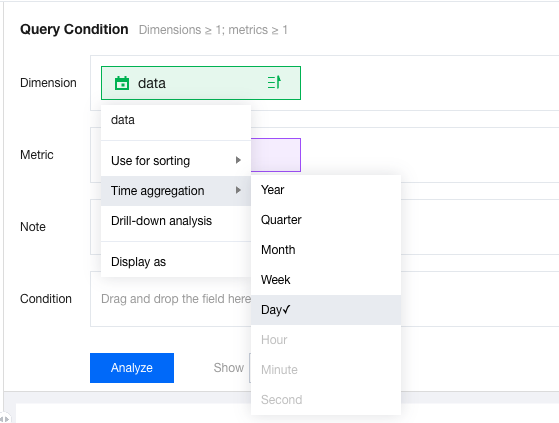
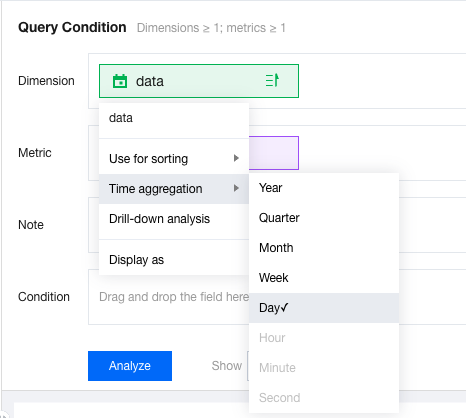
2. Set the time aggregation of the dimension to "day".
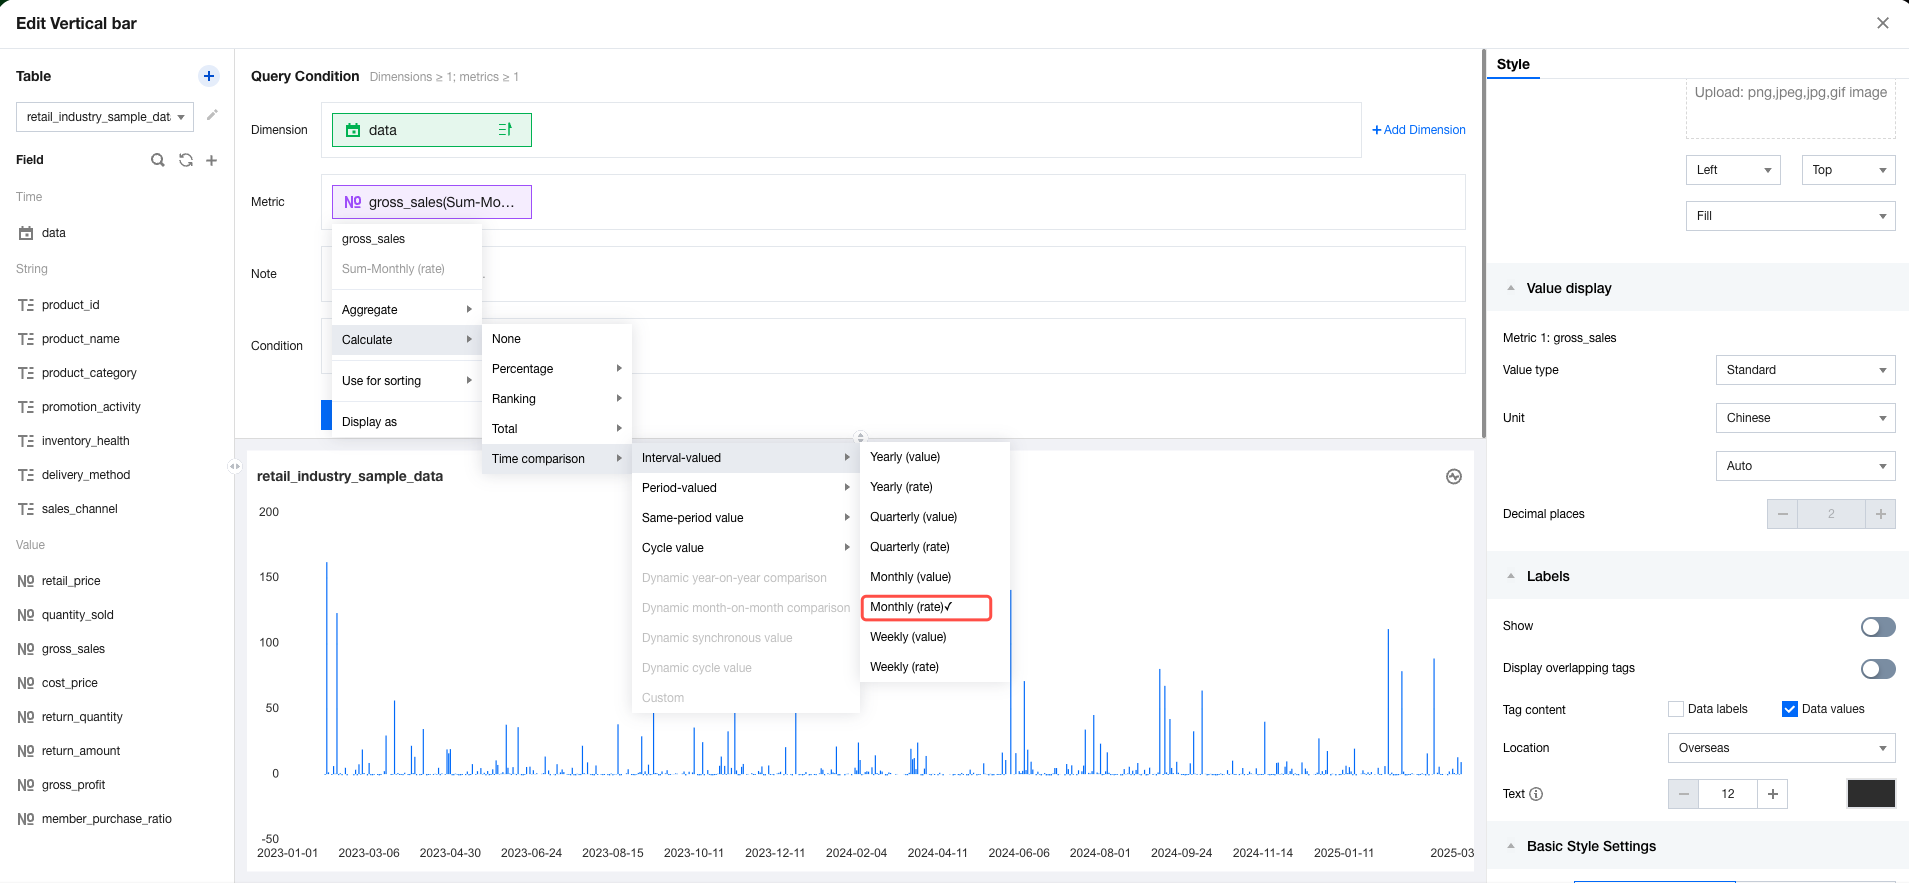
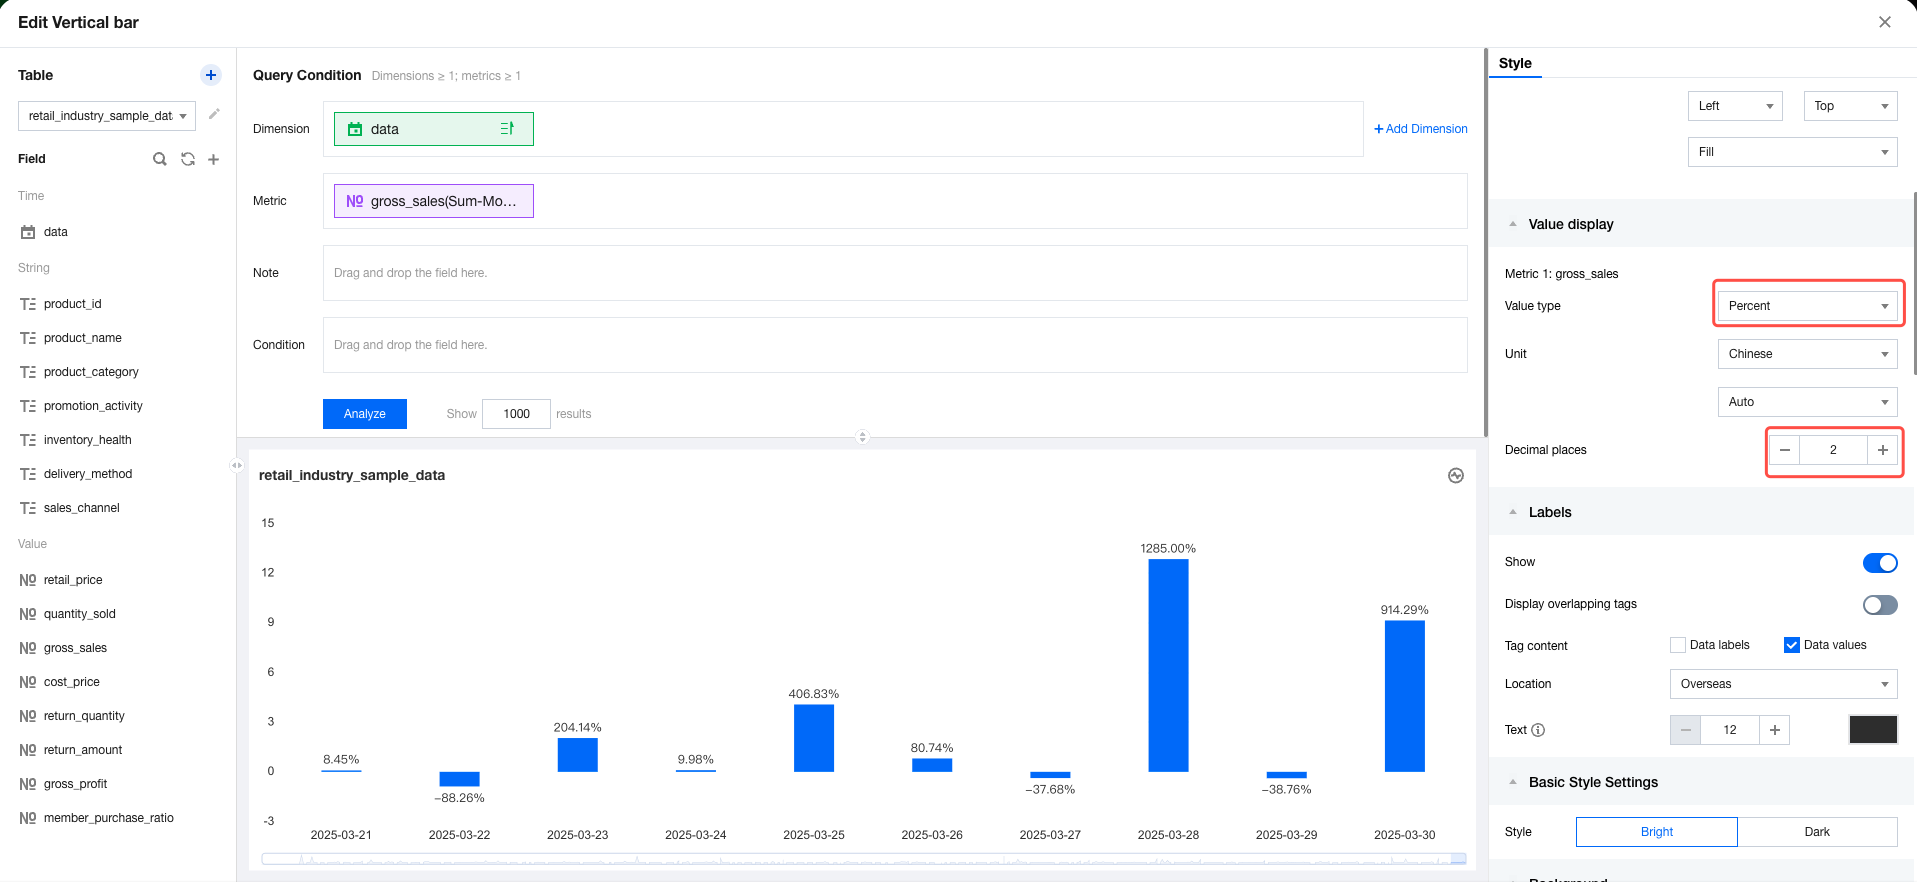
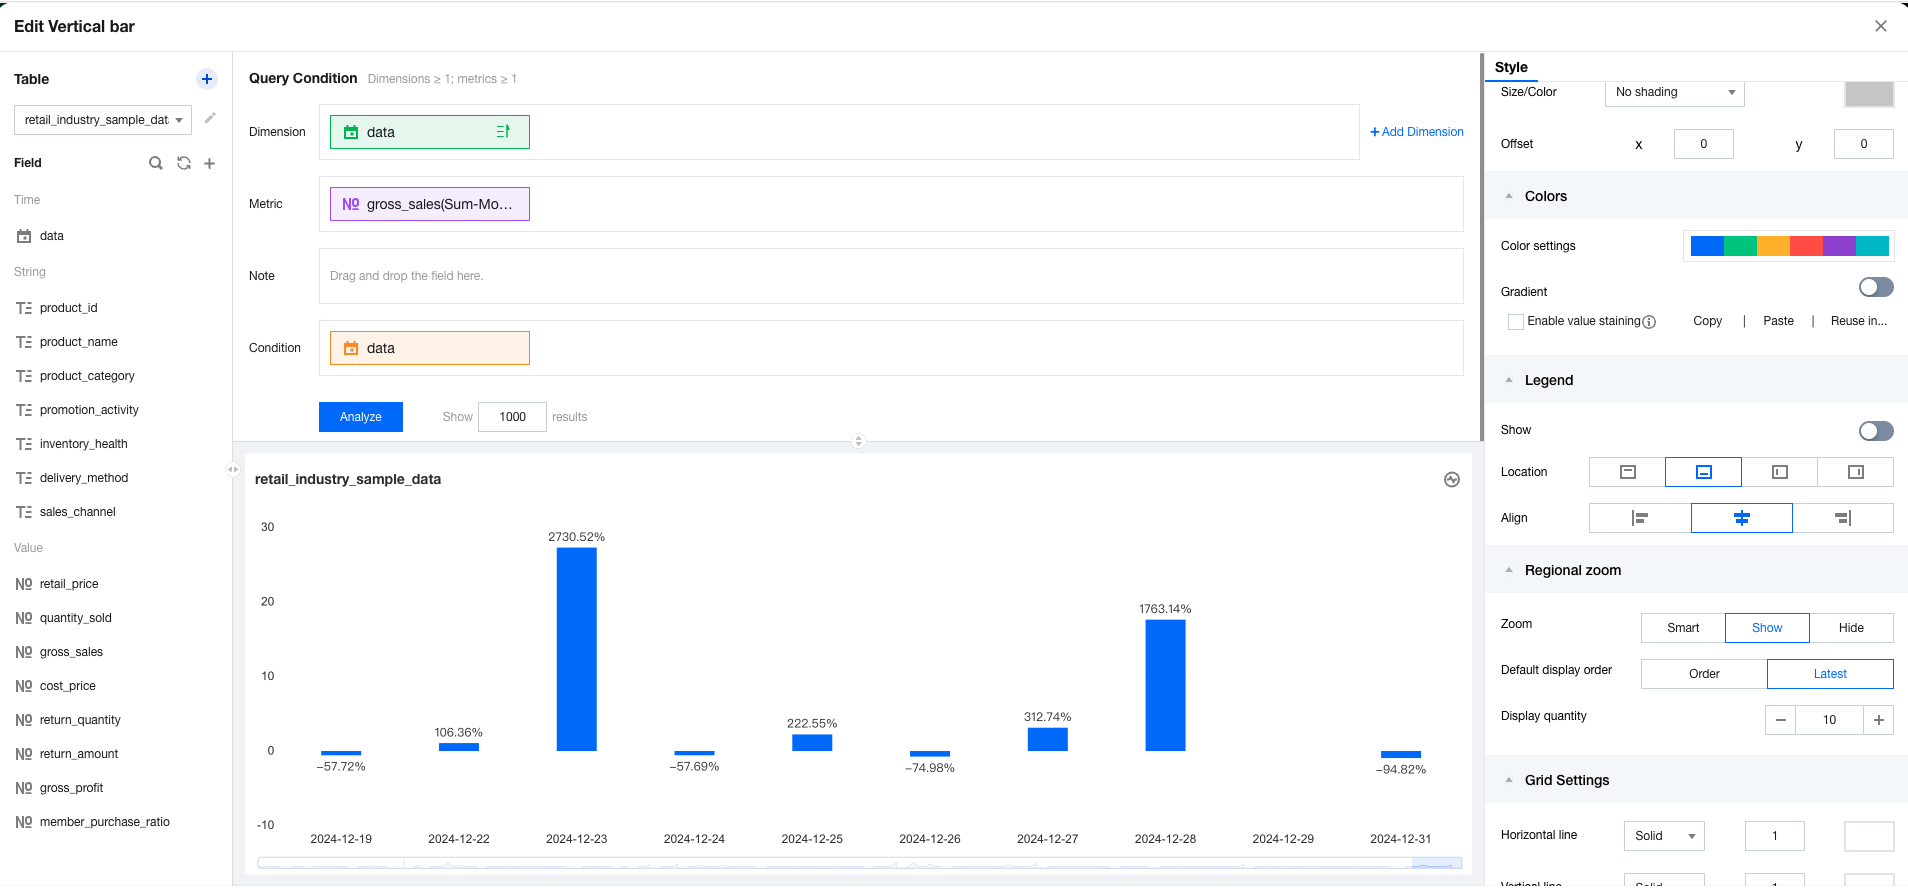
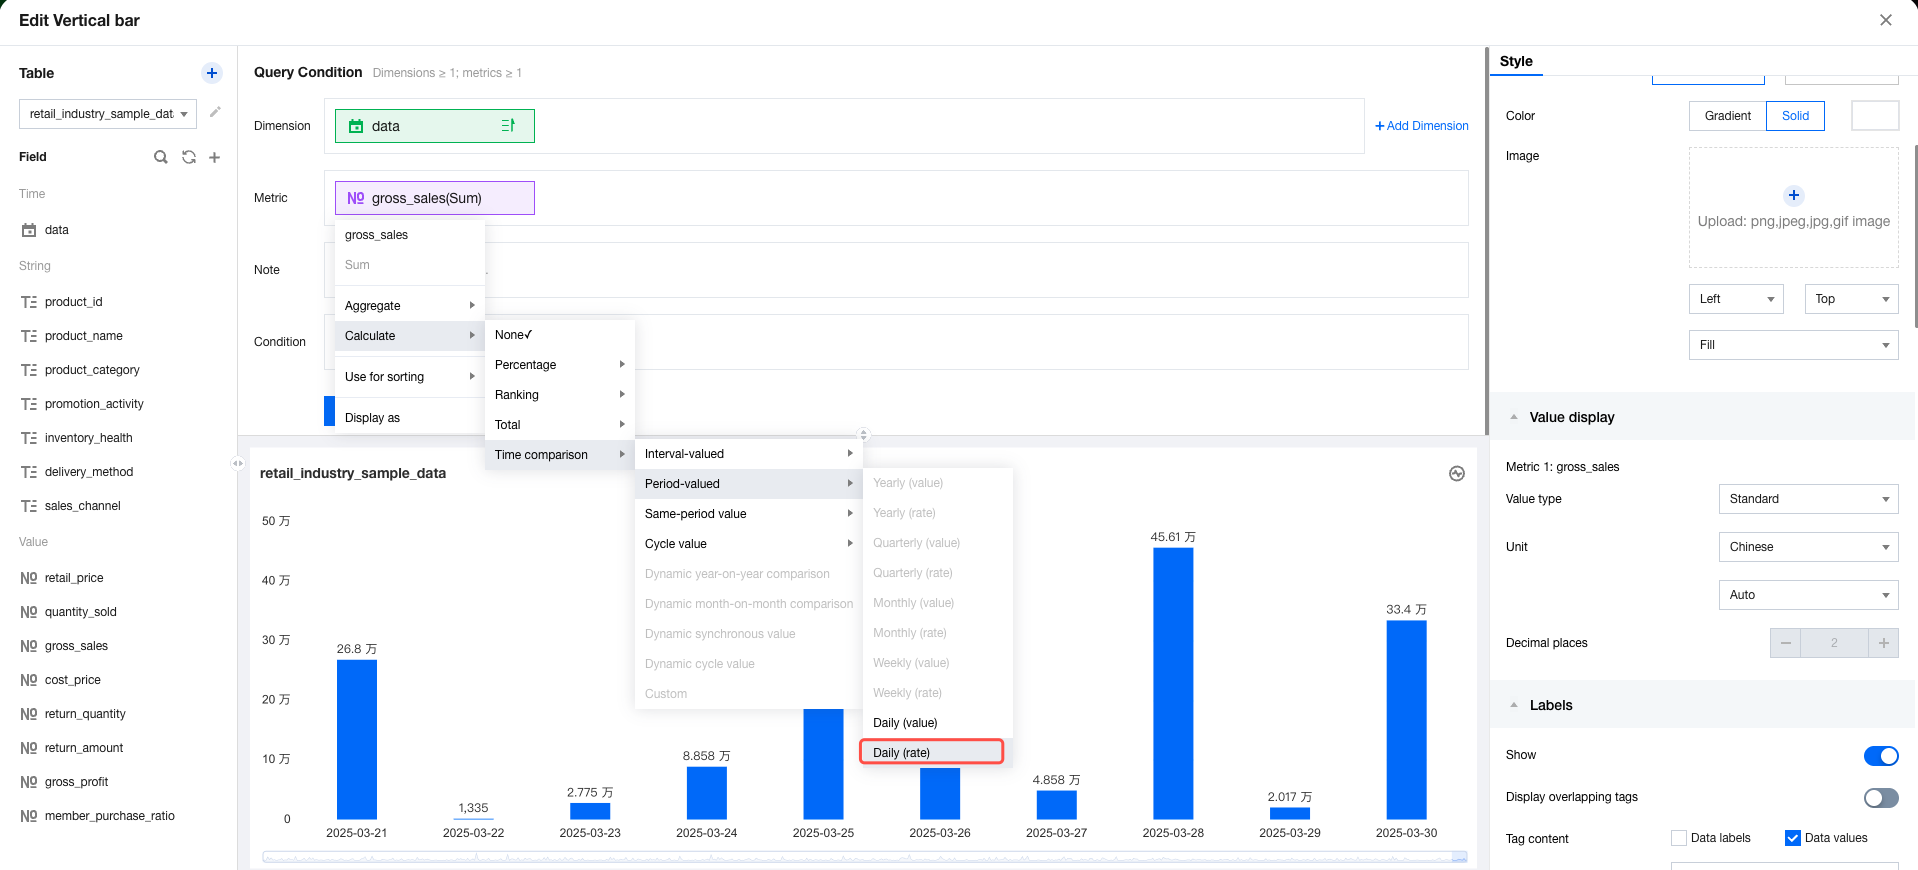
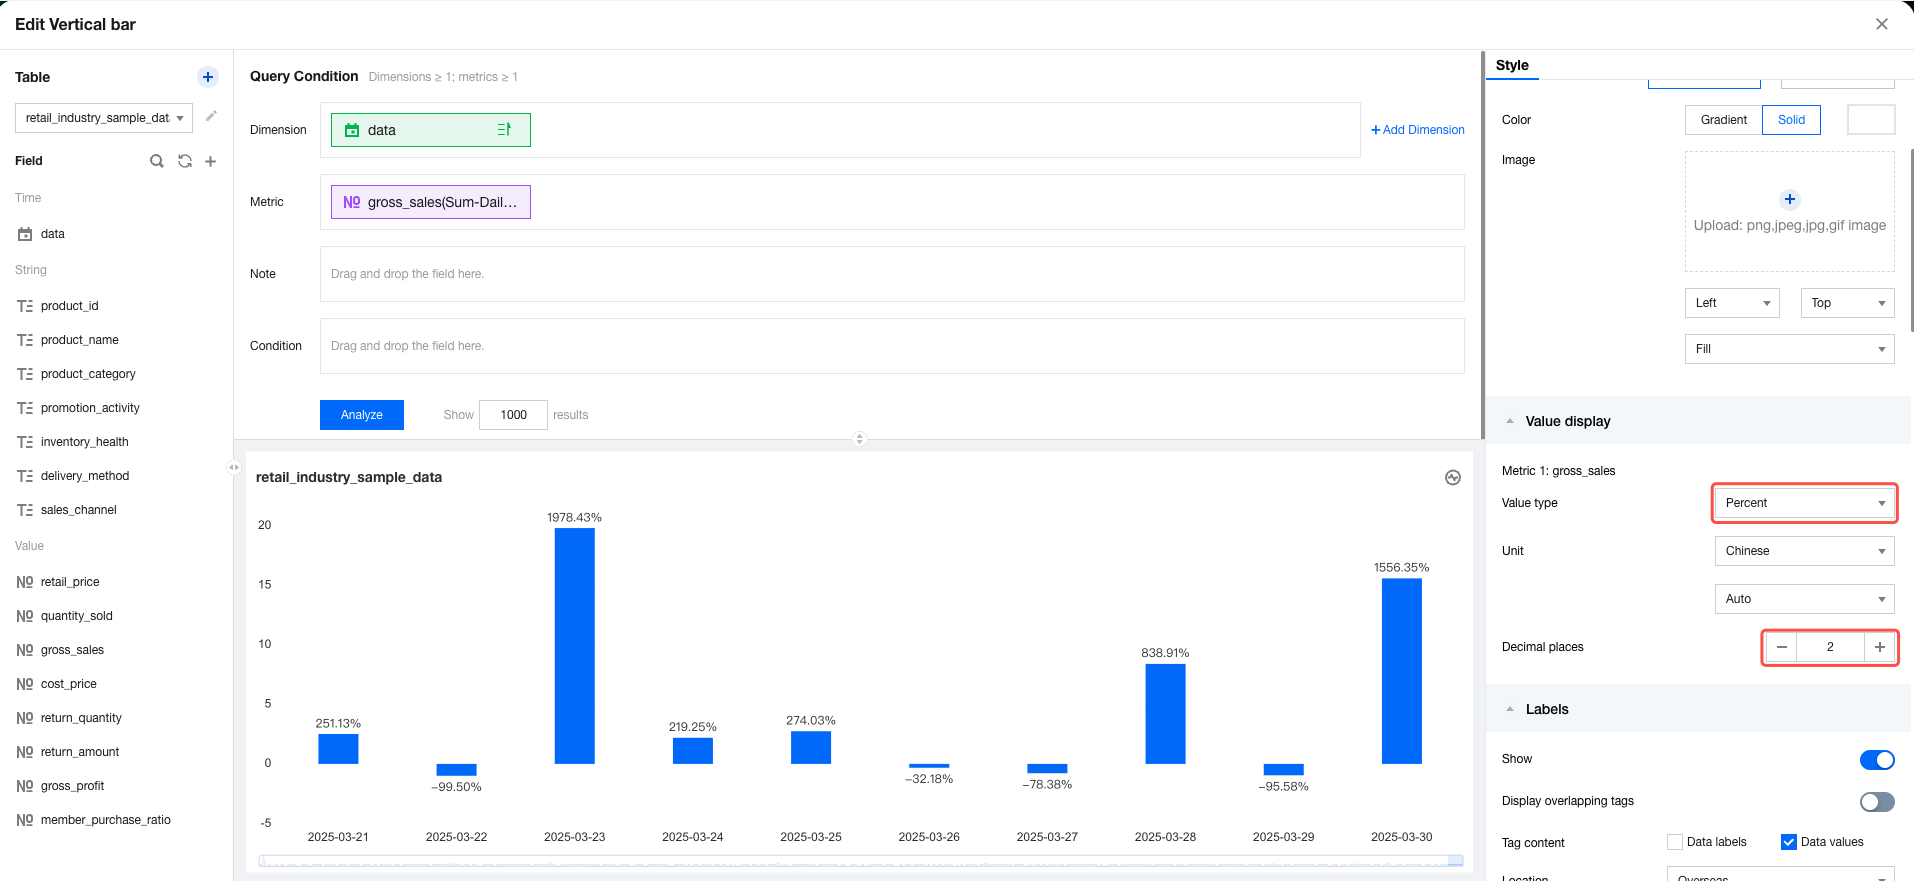
3. In the metric field, select quick calculation, year-over-year/period-over-previous period comparisons, year-over-year comparisons, and then month-on-month comparison (growth rate) sequentially. 4. In the style panel, set the value display and format the value as a percentage with 2 decimal places. 5. The current value is all time dimensions. We hope to only show data after a certain date, which can be filtered through analysis conditions. The filtered results are shown below:
Period-Over-Previous Period Comparisons
Period-over-previous period comparisons allow for calculating values from the current period against those from the previous period. Annual year-over-previous year comparison, annual quarter-over-previous quarter comparison, annual month-over-previous month comparison, and annual week-over-previous week comparison are supported.
Note:
1. To use period-over-previous period comparisons, at least 1 time field is required in the dimension. Otherwise, period-over-previous period comparisons are unavailable;
2. The available granularities of period-over-previous period comparisons are determined by the aggregation of time dimension fields. The relationship between time aggregation and available period-over-previous period comparisons is shown below:
Time Dimension Aggregation | an class="tGX" contenteditable="false"> |
Year | Year-over-previous year comparison |
Quarter | Quarter-over-previous quarter comparison |
Month | Month-over-previous month comparison |
Week | Week-over-previous week comparison |
Day | Day-over-previous day comparison |
Hour, minute, and second | Not supported yet |
The following example illustrates how to use year-over-year comparisons:
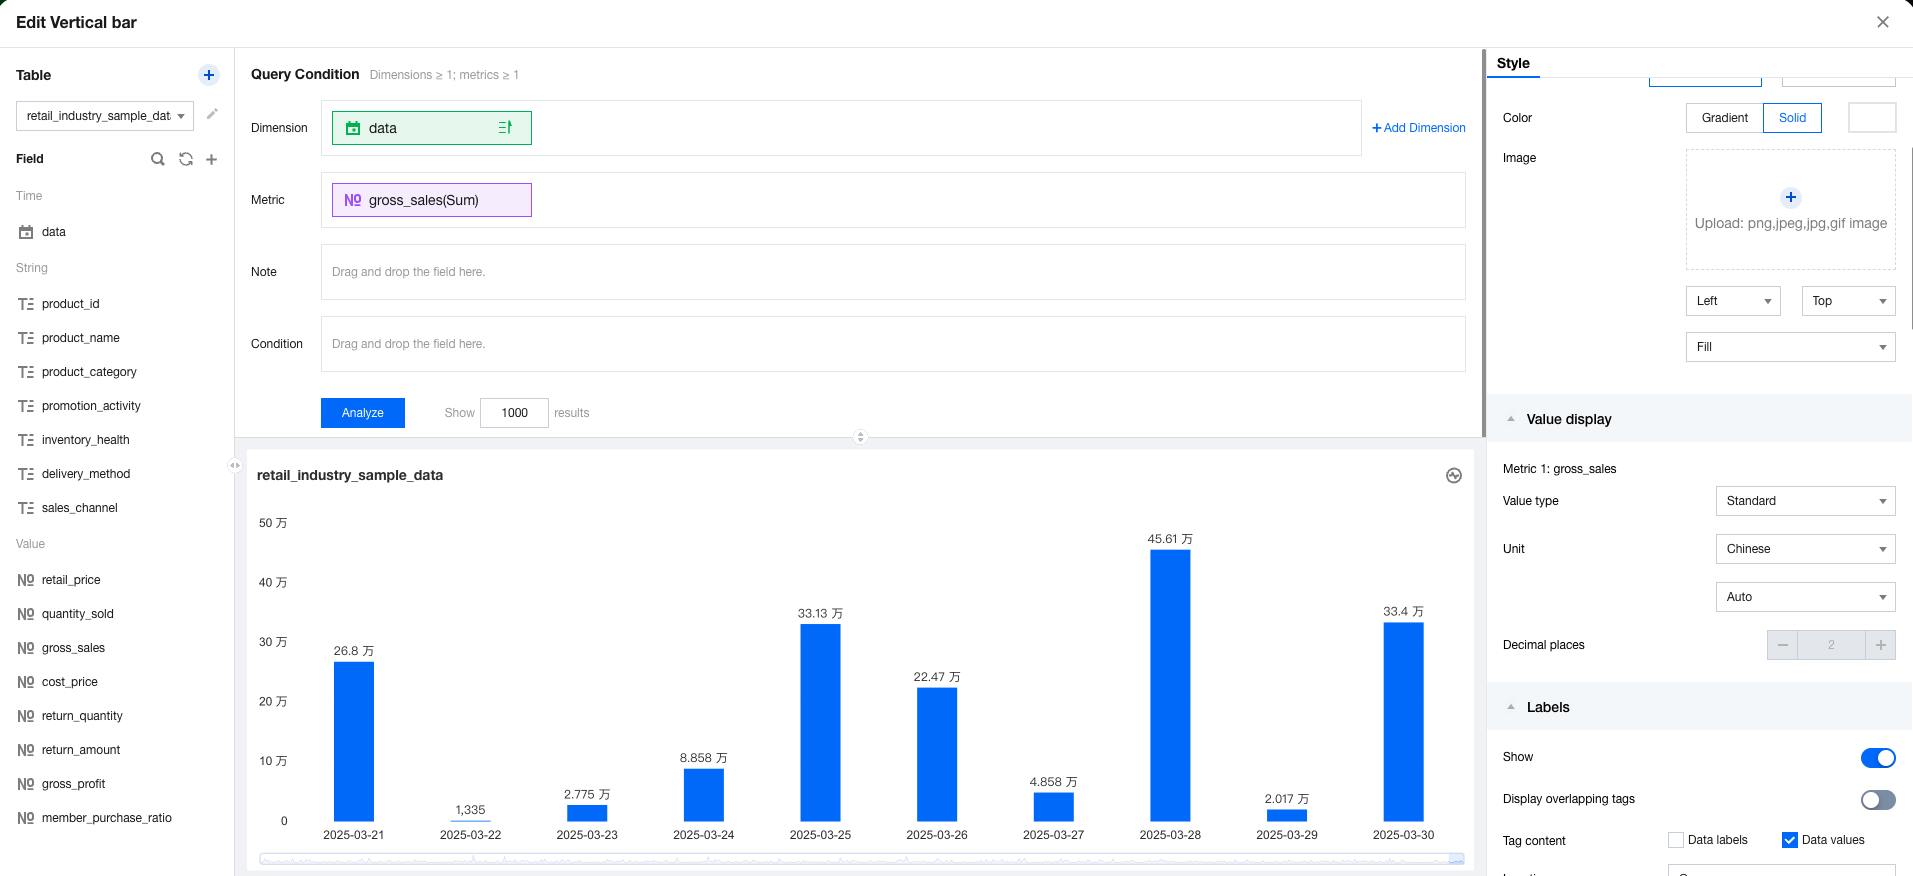
1. Enter the canvas, add a column chart component, set the dimension to time dimension, and metrics. 2. Set the time aggregation of the dimension to "day".
3. In the metric field, select quick calculation, year-over-year/period-over-previous period comparisons, period-over-previous period comparisons, and then day-over-previous day comparison (growth rate) sequentially. 4. In the style panel, set the value display and format the value as a percentage with 2 decimal places. The results are shown below: Dynamic Year-Over-Year/Period-Over-Previous Period Comparisons
Year-over-year/Period-over-previous period comparisons allow for comparing the data from a complete aggregation cycle (such as an entire month like February). However, in some cases, we need to compare the data from an incomplete aggregation cycle (such as an incomplete month from February 1 to February 15). The differences in these comparisons are shown in the following examples:
Assuming the current date is February 15, we calculate the annual year-over-year comparison result through year-over-year comparisons.
1. Year-over-year/Period-over-previous period comparisons: The calculation is to compare data from February 1–28, 2024, against data from February 1–28, 2023. Since the current date is February 15, we are actually comparing the period from February 1–15, 2024, against the full cycle of February 1–28, 2023. This means that we are comparing an incomplete cycle with a complete cycle in the last year.
2. Dynamic year-over-year/period-over-previous period comparisons: The calculation compares data from February 1–Feb 15, 2024, against data from February 1–15, 2023.
Note:
1. To use dynamic year-over-year/period-over-previous period comparisons, time fields cannot be included in the dimension. Otherwise, dynamic year-over-year/period-over-previous period comparisons are unavailable (they cannot be aggregated correctly);
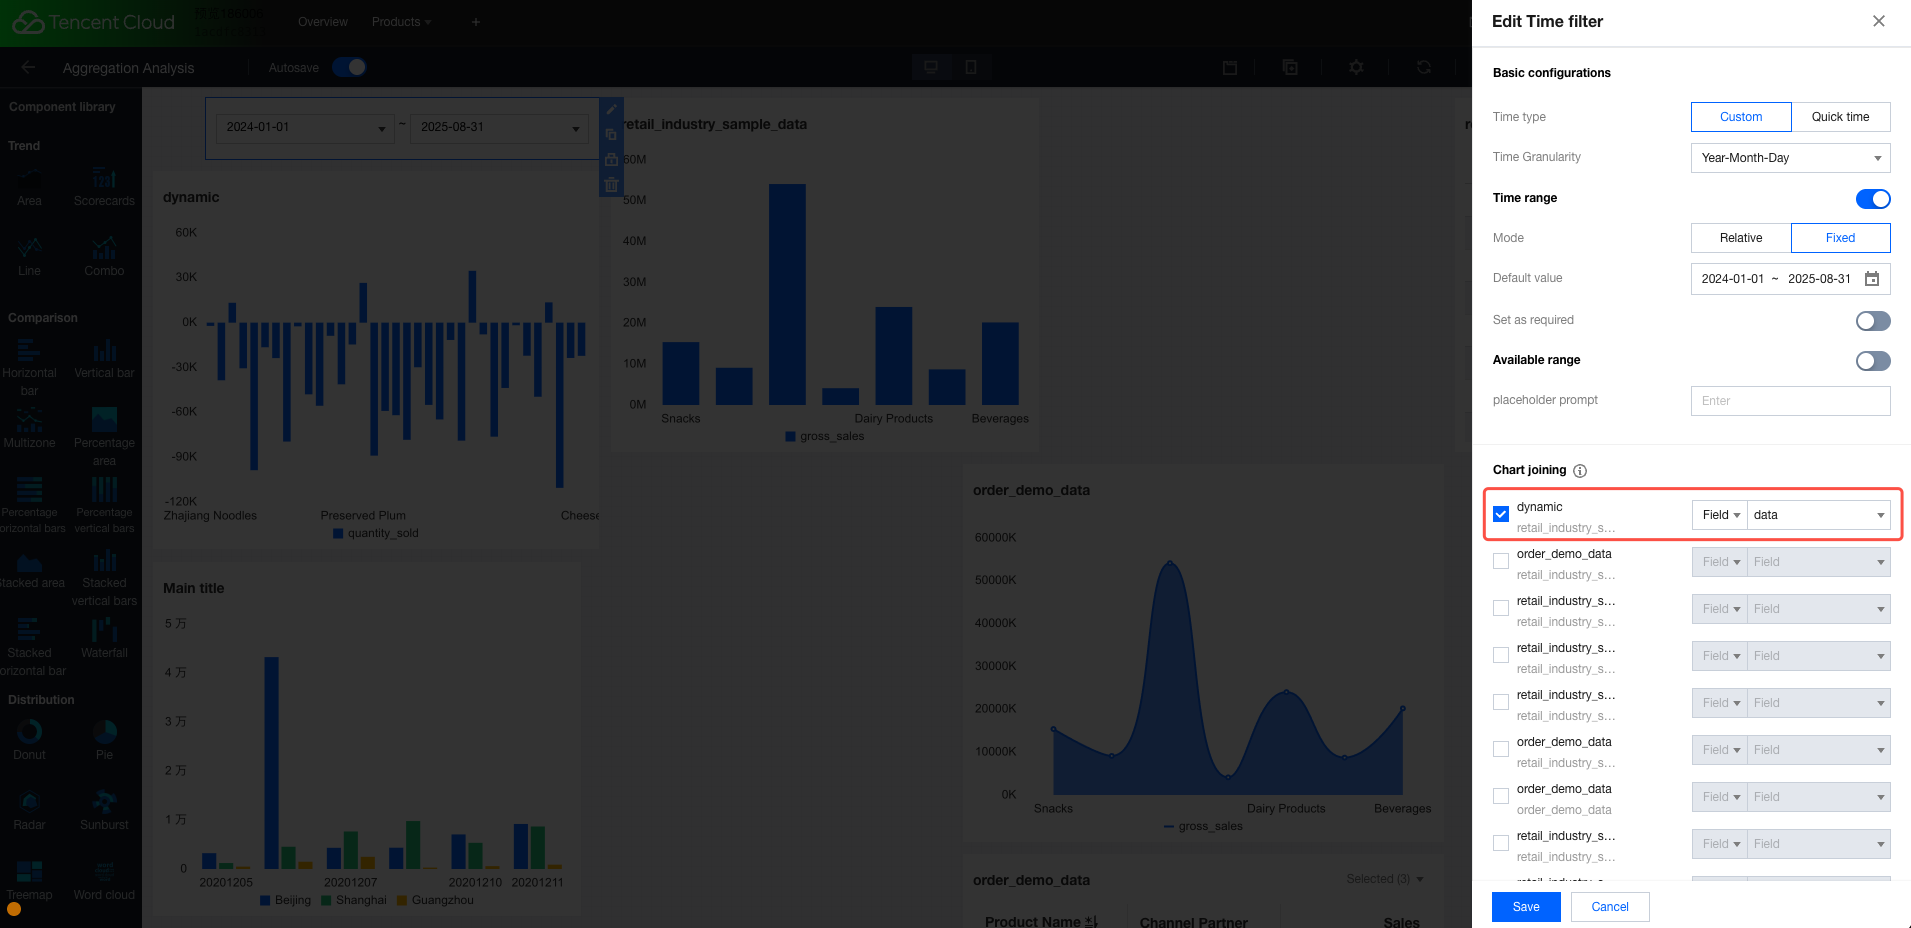
2. To use dynamic year-over-year/period-over-previous period comparisons, the component should be associated with a time filter. Otherwise, the settings will not take effect (the time cycle should be obtained through the filter).
The following "dynamic year-to-year period" example shows how to use year-over-year/Period-over-previous period comparisons:
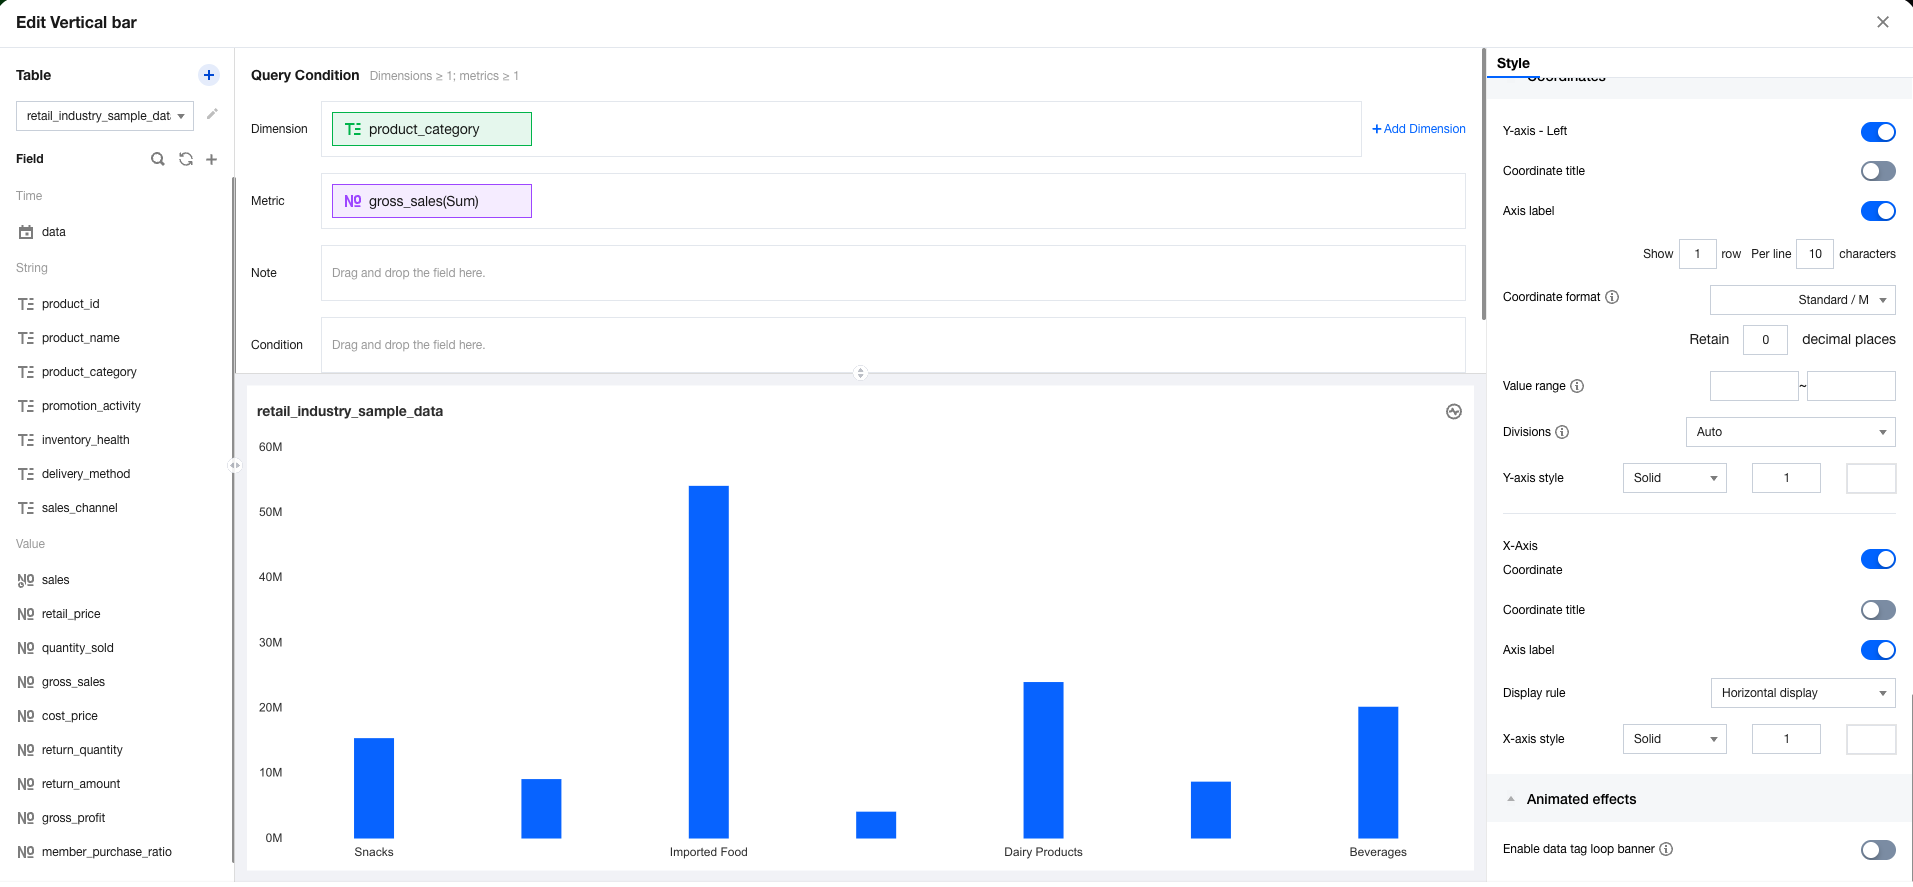
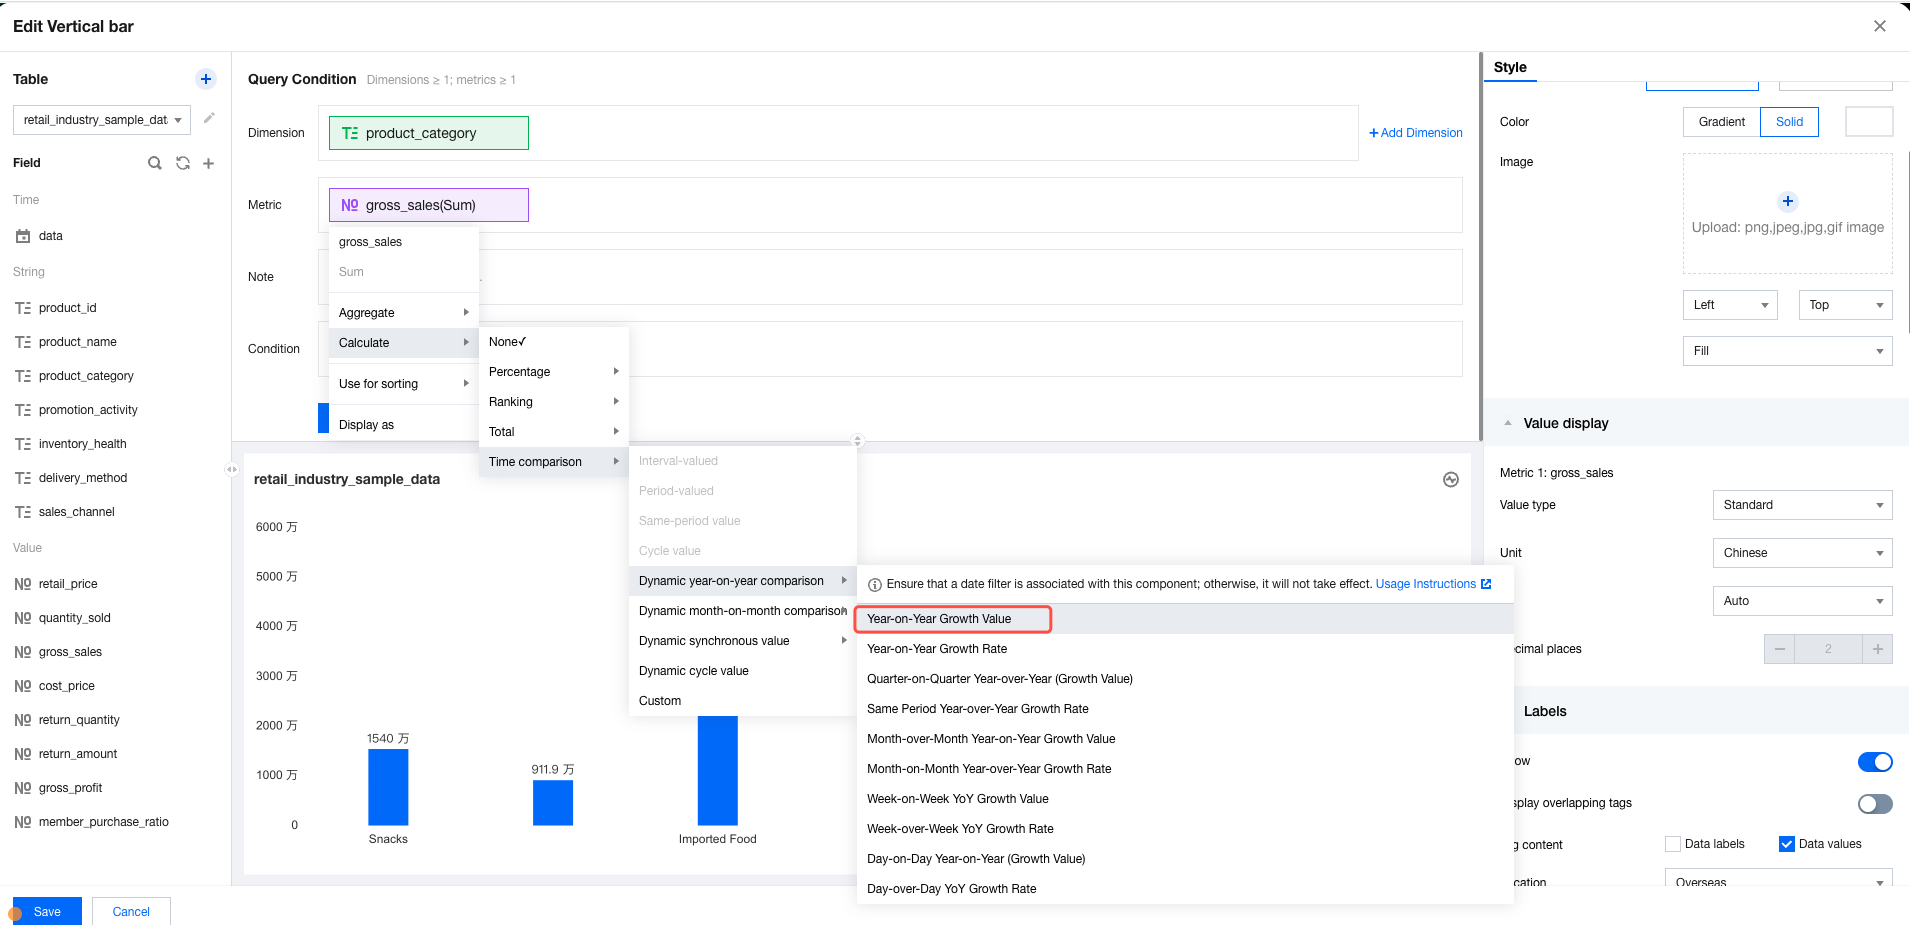
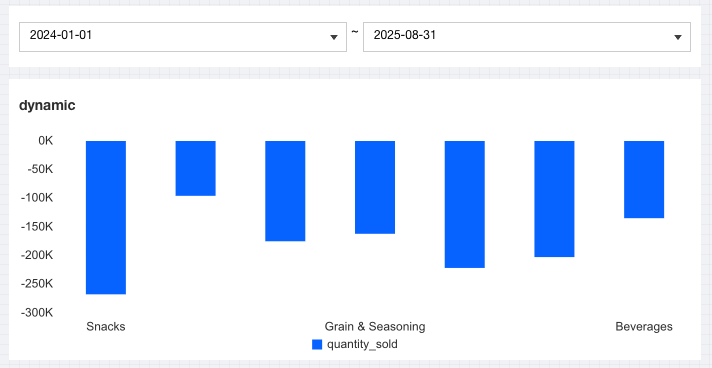
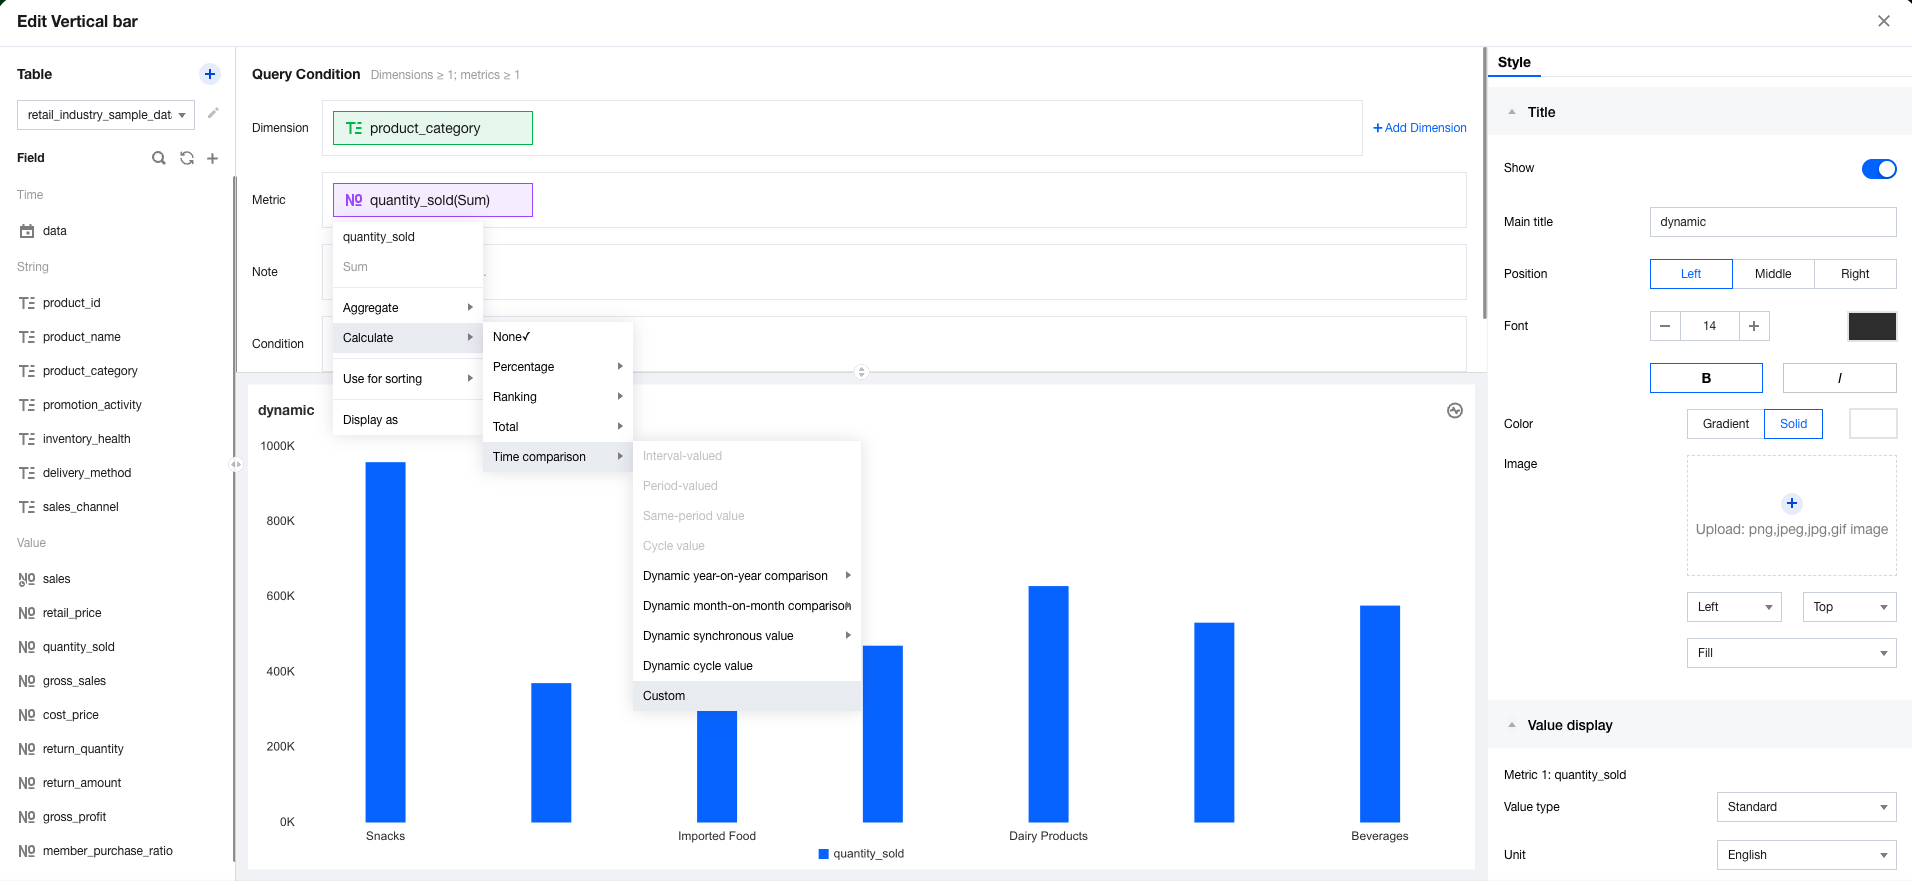
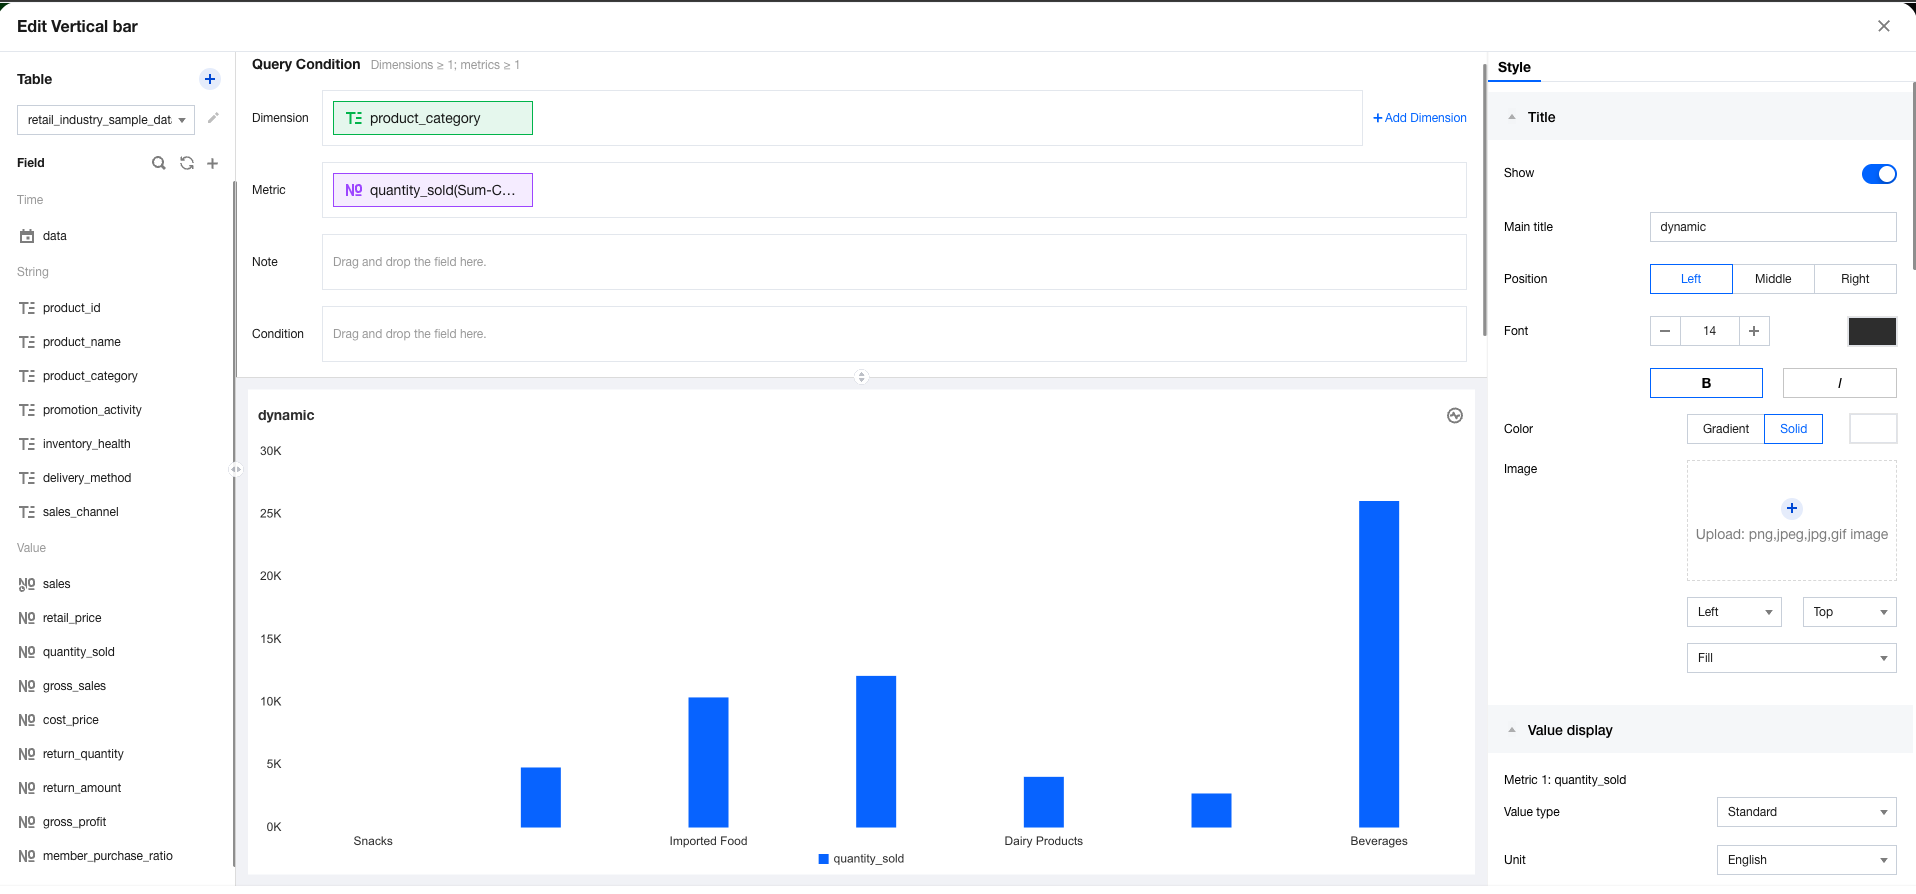
1. Enter the canvas, add a column chart component, set the dimension, and metrics. 2. In the metric field, select quick calculation, year-over-year/period-over-previous period comparisons, dynamic year-over-year comparison, and then year-over-year comparison (growth value) sequentially. 3. Add a time filter and associate it with the added column chart component: 4. In the canvas, select the time range in the time filter, as shown in the figure below, choose a certain date range, and you can see the column chart data dynamically compared. Custom Comparisons
With custom comparison, you can compare any two time segments, such as comparing one date range with another.
Note:
To use custom comparisons, time fields cannot be included in the dimension. Otherwise, custom comparisons are unavailable (they cannot be aggregated correctly);
The following example illustrates how to use year-over-year comparisons:
1. Enter the canvas, add a column chart component, set the dimension, and metrics.
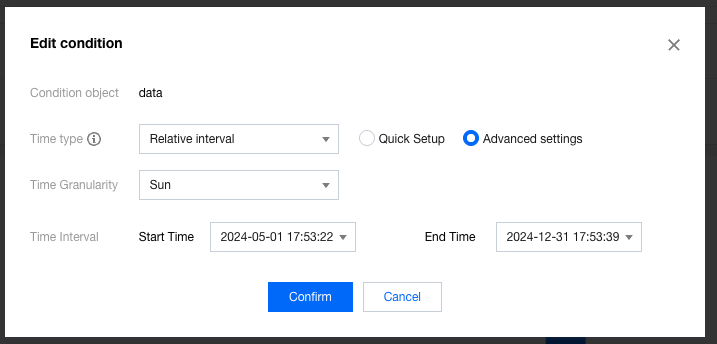
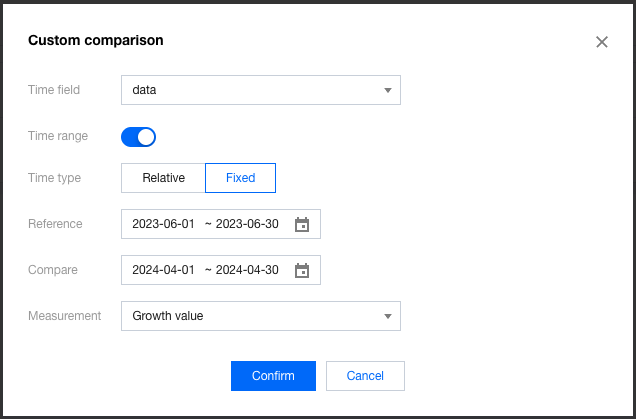
2. In the metric field, select quick calculation, year-over-year/period-over-previous period comparisons, and then custom comparison sequentially. 3. Set custom comparison information:
Time field: Select the time field of the data table as the offset basis.
Interval comparison: When this feature is enabled, you can compare 2 time intervals.
Time type: "relative time" and "fixed time" are supported.
Reference time: Used as the main comparison time to compare with other time periods.
Comparison time: Used as the data time for the comparison object, serving as the time period data to be compared.
Display method: Set the comparison result as a comparison value or a percentage ratio.
4. Click Analyze to obtain the data result of the comparison between two time intervals for each department.