Product Overview
Strengths
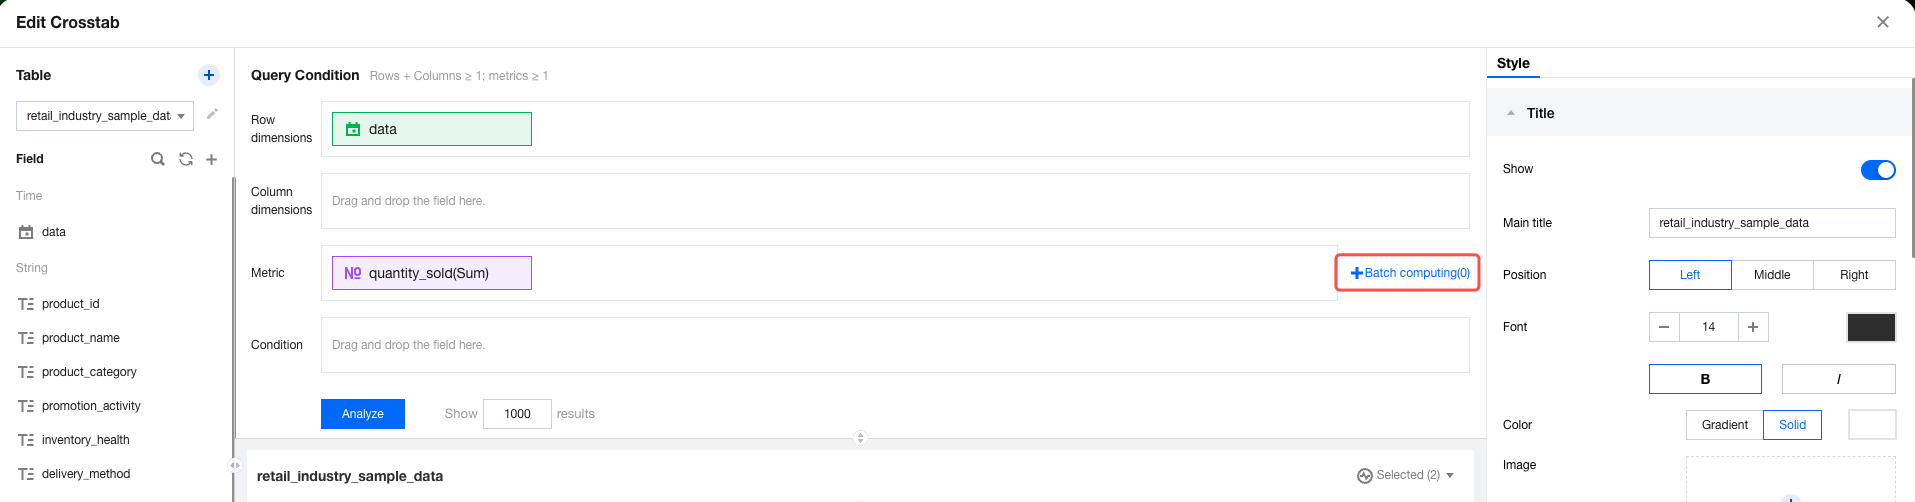
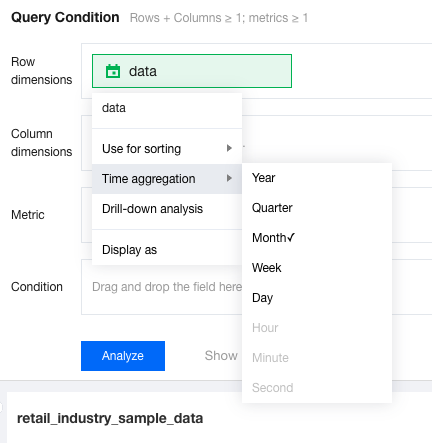
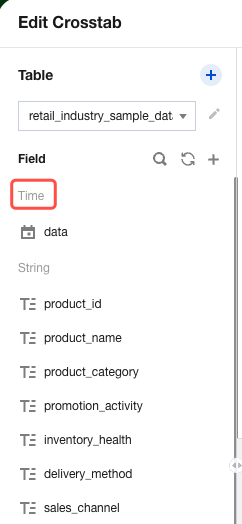
Product Features
Use Cases
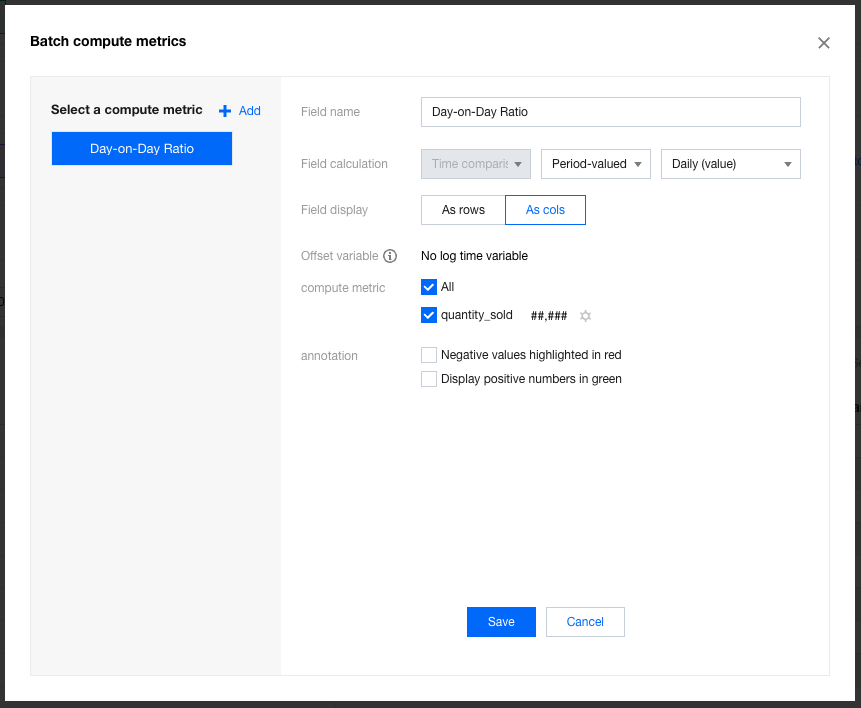
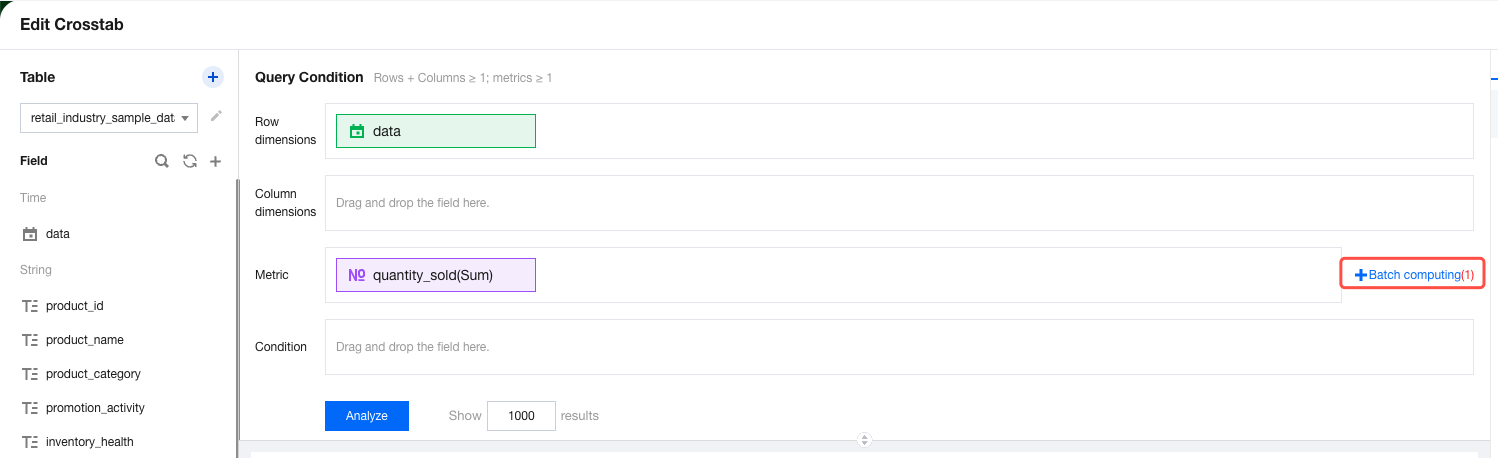
Setting Item | Description | Example |
Field name | This item will appear in the table column. | If you want to calculate the month-over-previous month comparison values, enter "MoM". |
Field calculation | Currently, the calculations of year-over-year and period-over-previous period comparison values are supported. The available granularities of year-over-year and period-over-previous period comparisons are determined by the time dimension aggregation granularity of charts. | If the time field "data time" is aggregated by "month", select "MoM" and then "Month-over-Month". |
Field display | Specifies whether the current field is added to rows or columns. | If you want to display "Month-over-Month" on the right of the "sales" metric, select "as a column". |
Offset variable | When the associated data table of the component is created using SQL and the SQL uses time-type parameters, you can bind the time variables in SQL. During execution, both the current system time and comparison time will be passed to the SQL parameters. | If the SQL sets "sale_date >${st} and sale_date<${st-30d}", you can select the time variable "st" to apply an offset for year-over-year and period-over-previous period comparisons. |
Calculation metric | Specifies all or part of metrics to participate in calculations. Unselected metric fields will not participate in calculations. | If you only want to calculate the month-over-previous month comparison values for "sales" and "profit", select the "sales" and "profit" metrics. |
Calculation metric - Set calculation result style | Set the data result style for metric calculations | For details, see "Setting the Batch Calculation Format" below. |
Exception handling | When "growth rate" is selected for calculations, you may encounter issues that the metric value of the previous period is zero or a negative number. Exception handling can help prevent data calculation errors or display data more reasonably. | If you want to display a department with zero sales in the previous period as "-" when calculating "sequential period-over-period (growth rate)", select "show as -". |
Annotation | Annotations are supported for positive and negative values. | If you want to annotate negative profit values in red font, select "negative values highlighted in red". |
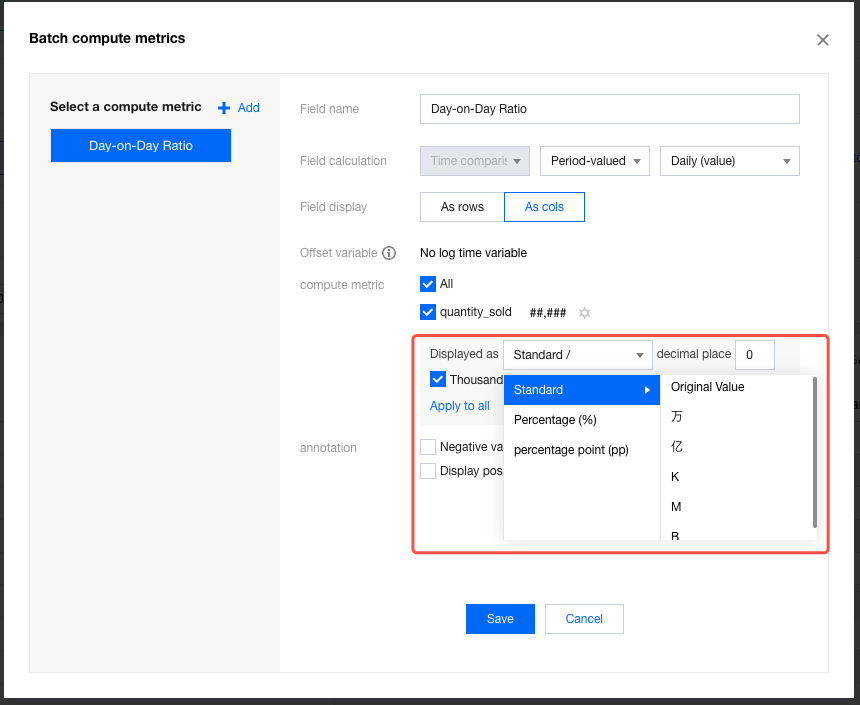
Setting Item | Description | Example |
Display type | Options include standard numerical value, percentage, and percentage point. Standard numerical values support unit settings. Percentages and percentage points do not support unit settings. The calculation of percentage points always uses the current value minus the value from the previous period, whether for "growth rate" or "growth value". | If you want to view the percentage point increase in the current "profit margin" compared to the previous period, select "percentage point (PP)". |
Decimal place | You can set the number of decimal places for results. | If you want to display data with accuracy up to 0.00 percentage points, set the number of decimal places to 2. |
Thousand separator | If this setting is enabled, values greater than 1000 will be displayed with thousand separators. | If you want to display the "sales" period-over-previous period value with thousand separators, enable "thousand separator". |
Apply to all | When multiple metrics are present, you can use "apply to all" to quickly unify the result format. | If you want to unify the format configurations for metrics such as "attrition rate" and "churn rate" with "profit margin", click "apply to all" under the "profit margin" configurations. |
Was this page helpful?
You can also Contact sales or Submit a Ticket for help.
Help us improve! Rate your documentation experience in 5 mins.
Feedback