tencent cloud

Business Intelligence

Product Introduction
Product Overview
Strengths
Product Features
Use Cases
Purchase Guide
Billing Instructions
Purchase Guide
Upgrade Instructions
Renewal Instructions
Quick Start
Data Access
Creating a VPC Data Source
Creating Cloud Data Sources
Creating Proprietary Data Sources
Data Table Creation and Data Processing
Introduction to Data Analysis Basics
Data Table Creation
Data Processing
Data Analysis
Analysis Settings
Interactive Analysis
Ad-Hoc Analysis
Data Visualization
Public Style Setting Instructions
Filter Components
Chart components
Rich Text Component
Other Components
Mobile Terminal Layout Editor
Theme Settings Introduction
Page Layout Introduction
Dashboard Directory Management
Collaboration and Application
Push Channel Management
Report Push
Sharing
Embedding
Self-Service Data Retrieval
Metric Alarms
Data Security
Parameter Construction
Platform Management
Account and Permission Management
Statistics and Analysis
System Settings
Resource Migration
Practical Tutorial
Collection of Optimization Practices
Performing Trend Analysis
Performing Proportion Analysis
Performing Data Analysis with Excel Files
Creating Tables
API Documentation
History
Introduction
API Category
Making API Requests
Project Management APIs
Role APIs
Database Table APIs
Report Embedding APIs
Page Management APIs
Data Types
Error Codes
FAQs
Relevant Agreements
Service Level Agreement
Privacy Policy
Data Privacy And Security Agreement
Contact Us

Dimension Sub-axis

PDF
Focus Mode
Font Size
Last updated: 2025-09-19 15:14:20
In data analysis scenarios, you may need to group dimensions. For example, if two analysis dimensions are selected, you may want the chart to display sub-dimensions under the same dimension as a group to help understand the numeric value performance of different sub-dimensions within a dimension. To achieve the dimension grouping, you will need to use the dimension sub-axis feature. Specific operations are as follows:
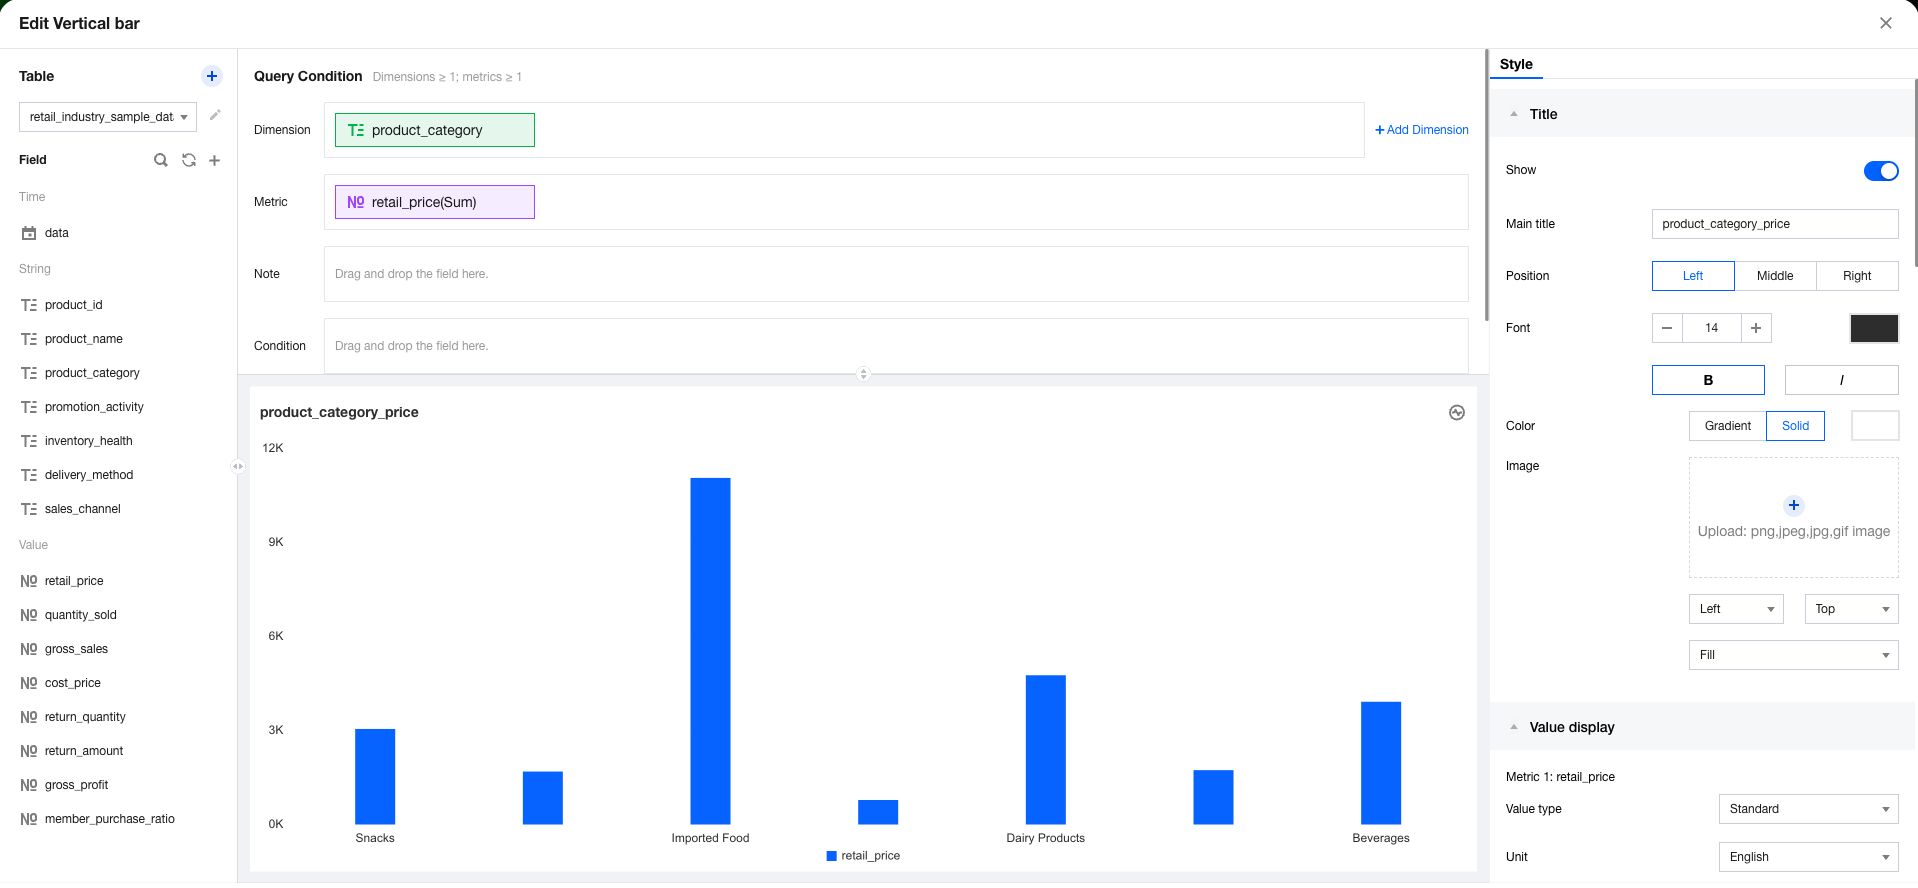
1. Go to the chart editing page and add a dimension sub-axis.


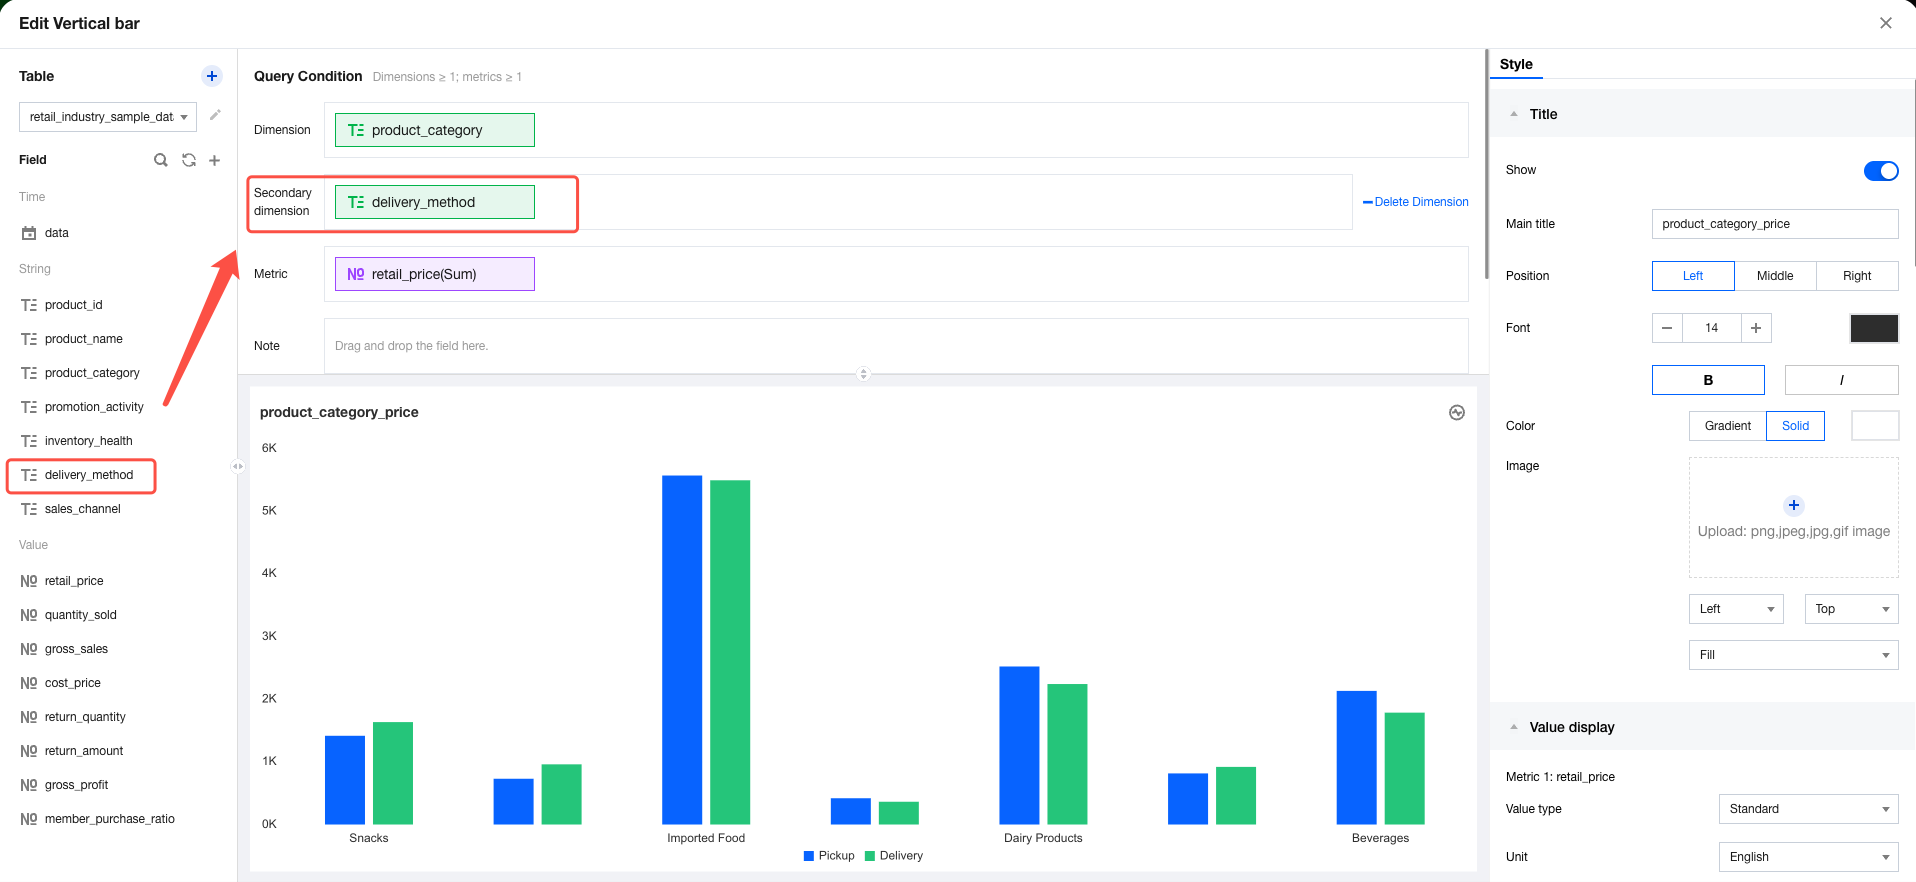
2. Drag and drop the dimension sub-axis field to be displayed into the "dimension sub-axis" box.


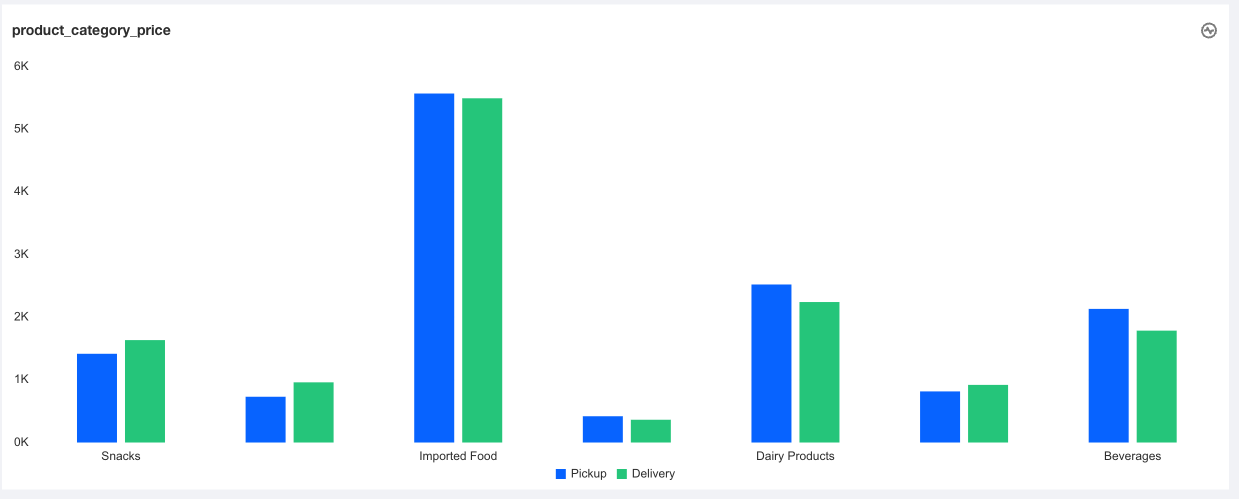
3. Click Analyze to view the sub-axis effect.


4. Delete the sub-axis: Click delete dimension on the right of the dimension sub-axis to delete the dimension sub-axis settings.
Note
The sub-axis feature is only supported for trend and comparison charts (such as line and column charts). Distribution and relationship charts (such as pie charts and word clouds) are not supported.

Help and Support

Was this page helpful?

Help us improve! Rate your documentation experience in 5 mins.

Feedback