The performance trends feature monitors the key performance metrics of database instances, Redis nodes, and proxy nodes in real time, including CPU, memory, key information, network usage, network utilization, requests, and responses. It collects monitoring data at the second granularity, dynamically displays the change trends of metrics as well as their maximum, minimum, and average values in tables graphically. You can compare the metrics of multiple nodes and different time periods and zoom in on and drag the monitoring view as needed.
The performance trends feature can meet your needs in various routine Ops and troubleshooting scenarios of database instances thanks to its strong statistical analysis capabilities, diverse visual options, and extremely high real-timeness. These capacities let you quickly get a holistic picture of database performance to minimize risks.
Monitoring Metrics
Supported monitoring metrics are displayed in three dimensions: instance, Redis node, and proxy node.
Instance
Category
Description
Metric
Unit
Meaning
CPU
CPU Utilization
cpu_util
%
Average CPU utilization
Max CPU Utilization of Node
cpu_max_util
%
The maximum CPU utilization of a node (shard or replica) in an instance
Memory information
Memory Usage
mem_used
MB
Actually used memory capacity, including the capacity for data and cache
Memory utilization
mem_util
%
The ratio of the actually used memory to the requested total memory
Max Memory Utilization of Node
mem_max_util
%
The maximum among all node (shard or replica) memory utilizations in an instance
Key information
Total Keys
keys
Pcs
The total number of keys (level-1 keys) in instance storage
Expired Keys
expired
Pcs
The number of keys expired in a time window, which is equal to the value of expired_keys output by the info command.
Evicted Keys
evicted
Pcs
The number of keys evicted in a time window, which is equal to the value of evicted_keys output by the info command.
Network usage
Number of connections
connections
Pcs
The number of TCP connections to an instance
Inbound Traffic
in_flow
MB/s
Private network inbound traffic
Outbound traffic
out_flow
MB/s
Private network outbound traffic
Network usage rates
Connection Utilization
connections_util
%
The ratio of the number of TCP connections to the maximum number of connections
Inbound Traffic Utilization
in_bandwidth_util
%
The ratio of the actually used private inbound traffic to the maximum traffic
Outbound Traffic Utilization
out_bandwidth_util
%
The ratio of the actually used private outbound traffic to the maximum traffic
Request
Total Requests
commands
Times/sec
Queries per second
Read request
cmd_read
Times/sec
The number of read command executions per second
Write request
cmd_write
Times/sec
The number of write command executions per second
Other Requests
cmd_other
Times/sec
The number of command (excluding write and read commands) executions per second
Big Value Requests
cmd_big_value
Times/sec
The number of executions of requests larger than 32 KB per second
Key Requests
cmd_key_count
Times/sec
The number of keys requested per second
Mget Executions
cmd_cmget
Times/sec
The number of requests made through MGET per second
Response
Checking slow queries
cmd_slow
times
The number of command executions with a latency greater than the slowlog-log-slower-than configuration
Read Request Hits
cmd_hits
times
The number of keys successfully requested by read commands, which is equal to the value of the keyspace_hits metric output by the info command.
Read Request Misses
cmd_miss
times
The number of keys unsuccessfully requested by read commands, which is equal to the value of the keyspace_misses metric output by the info command.
Read Request Hit Rate
cmd_hits_ratio
%
Key hits/(key hits + key misses). This metric can reflect the situation of cache miss. When the access request quantity is 0, the value of this metric will be null.
Execution Error
Execution Error
cmd_err
times
The number of command execution errors. For example, the command does not exist, parameters are incorrect, etc.
Latency
Average Execution Latency
latency_avg
ms
The average execution latency between the proxy and the Redis server
Max Execution Latency
latency_max
ms
The maximum execution latency between the proxy and the Redis server
P99 execution latency
latency_p99
ms
The P99 execution latency between the proxy and the Redis server
Average Read Latency
latency_read
ms
The average execution latency of read commands between the proxy and the Redis server. For more information on read command types, see Command types.
Average Write Latency
latency_write
ms
The average execution latency of write command between the proxy and the Redis server. For more information on write command types, see Command types.
Average Latency of Other Commands
latency_other
ms
The average execution latency of commands (excluding write and read commands) between the proxy and the Redis server
Redis node
Category
Description
Metric
Unit
Meaning
CPU
CPU Utilization
cpu_util
%
Average CPU utilization
Network usage
Number of connections
connections
Pcs
The number of connections between the proxy and a node
Connection Utilization
connections_util
%
The connection utilization of the node
Memory information
Memory Usage
mem_used
MB
Actually used memory capacity, including the capacity for data and cache
Memory utilization
mem_util
%
The ratio of the actually used memory to the requested total memory
Key information
Total Keys
keys
Pcs
The total number of keys (level-1 keys) in instance storage
Expired Keys
expired
Pcs
The number of keys expired in a time window, which is equal to the value of expired_keys output by the info command.
Evicted Keys
evicted
Pcs
The number of keys evicted in a time window, which is equal to the value of evicted_keys output by the info command.
Replication Delay
Replication Delay
repl_delay
Byte
The command delay between the replica node and the master node
Request
Total Requests
commands
Times/sec
Queries per second
Read request
cmd_read
Times/sec
Number of read command executions. For more information on read command types, see Command types.
Write request
cmd_write
Times/sec
Number of write command executions. For more information on write command types, see Command types.
Other Requests
cmd_other
Times/sec
The number of command (excluding write and read commands) executions per second
Response
Checking slow queries
cmd_slow
times
The number of command executions with a latency greater than the slowlog-log-slower-than configuration
Read Request Hits
cmd_hits
times
The number of keys successfully requested by read commands, which is equal to the value of the keyspace_hits metric output by the info command.
Read Request Misses
cmd_miss
times
The number of keys unsuccessfully requested by read commands, which is equal to the value of the keyspace_misses metric output by the info command.
Read Request Hit Rate
cmd_hits_ratio
%
Key hits/(key hits + key misses). This metric can reflect the situation of cache miss.
Proxy node
Category
Description
Metric
Unit
Meaning
CPU
CPU Utilization
cpu_util
%
CPU utilization of the proxy
Request
Total Requests
proxy_commands
Times/sec
The number of commands executed by the proxy
Key Requests
cmd_key_count
Counts/sec
The number of keys accessed by a command per second
Mget Executions
cmd_mget
Times/sec
The number of MGET commands executed per second
Execution Error
cmd_err
Times/sec
The number of command execution errors in the proxy. For example, the command does not exist, parameters are incorrect, etc.
Big Value Requests
cmd_big_value
Times/sec
The number of executions of requests larger than 32 KB per second
Traffic
Inbound Traffic
in_flow
MB/s
Private network inbound traffic
Outbound traffic
out_flow
MB/s
Private network outbound traffic
Network usage
Number of connections
connections
Pcs
The number of TCP connections to an instance
Connections per sec
client_connections_received_per_second
Pcs
The number of TCP connections established per second
Disconnections per sec
client_connections_closed_per_second
Pcs
The number of TCP connections closed per second
Abnormal connections per second
client_connections_aborted_per_second
Pcs
The number of TCP connections aborted per second
Network usage rates
Connection Utilization
connections_util
%
The ratio of the number of TCP connections to the maximum number of connections
Inbound Traffic Utilization
in_bandwidth_util
%
The ratio of the actually used private inbound traffic to the maximum traffic
Inbound Traffic Limit Count
in_flow_limit
times
The number of times inbound traffic triggers a traffic limit
Outbound Traffic Utilization
out_bandwidth_util
%
The ratio of the actually used private outbound traffic to the maximum traffic
Outbound Traffic Limit Count
out_flow_limit
times
The number of times outbound traffic triggers a traffic limit
Latency
Average Execution Latency
latency_avg
ms
The average execution latency between the proxy and the Redis server
Max Execution Latency
latency_max
ms
The maximum execution latency between the proxy and the Redis server
P99 execution latency
latency_p99
ms
The P99 execution latency between the proxy and the Redis server
Average Read Latency
latency_read
ms
The average execution latency of read commands between the proxy and the Redis server. For more information on read command types, see Command types.
Average Write Latency
latency_write
ms
The average execution latency of write command between the proxy and the Redis server. For more information on write command types, see Command types.
Average Latency of Other Commands
latency_other
ms
The average execution latency of commands (excluding write and read commands) between the proxy and the Redis server
2. On the left sidebar, select Performance Optimization.
3. At the top of the Performance Optimization page of DBbrain, select the target instance in the Instance ID drop-down list.
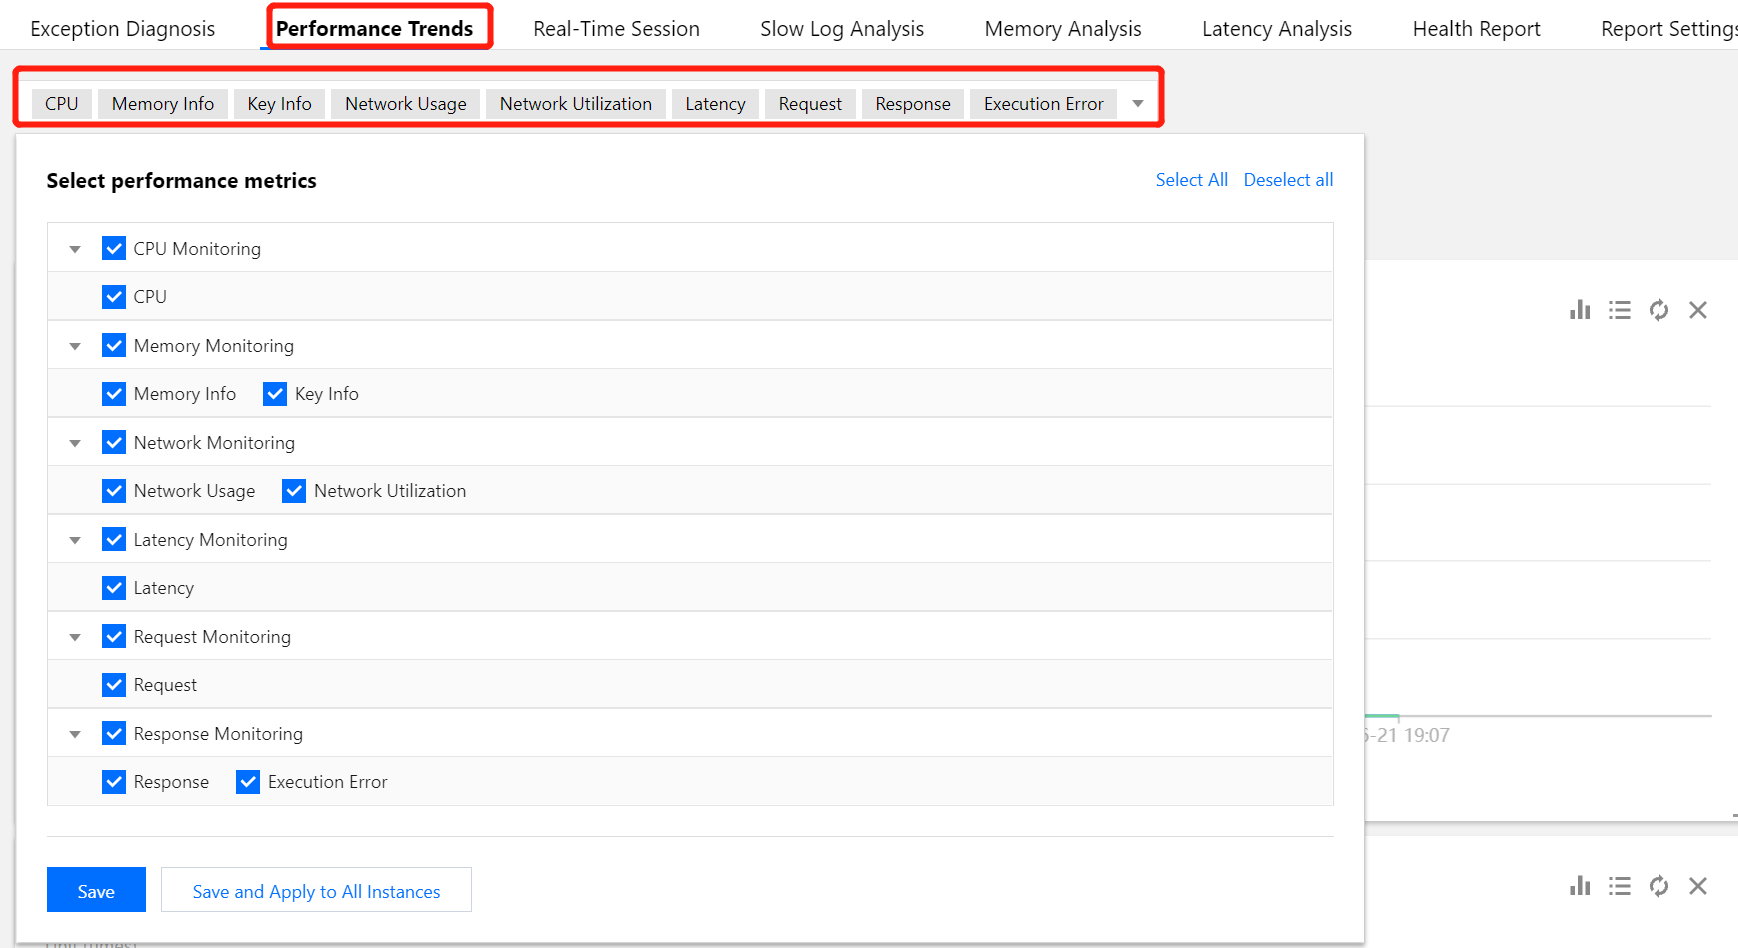
4. Click the Performance Trends tab, select the target performance metrics in the metric category drop-down list, and click Save.
To apply the selected performance metrics to all the TencentDB for Redis instances under your account, click Save and Apply to All Instances as shown below:
Step 2. Set the collection granularity
In the top-right corner of the Performance Trends tab, set the collection granularity of the monitoring data in the drop-down list on the right of Auto-Refresh to 5s, 15s, or 30s as shown below:
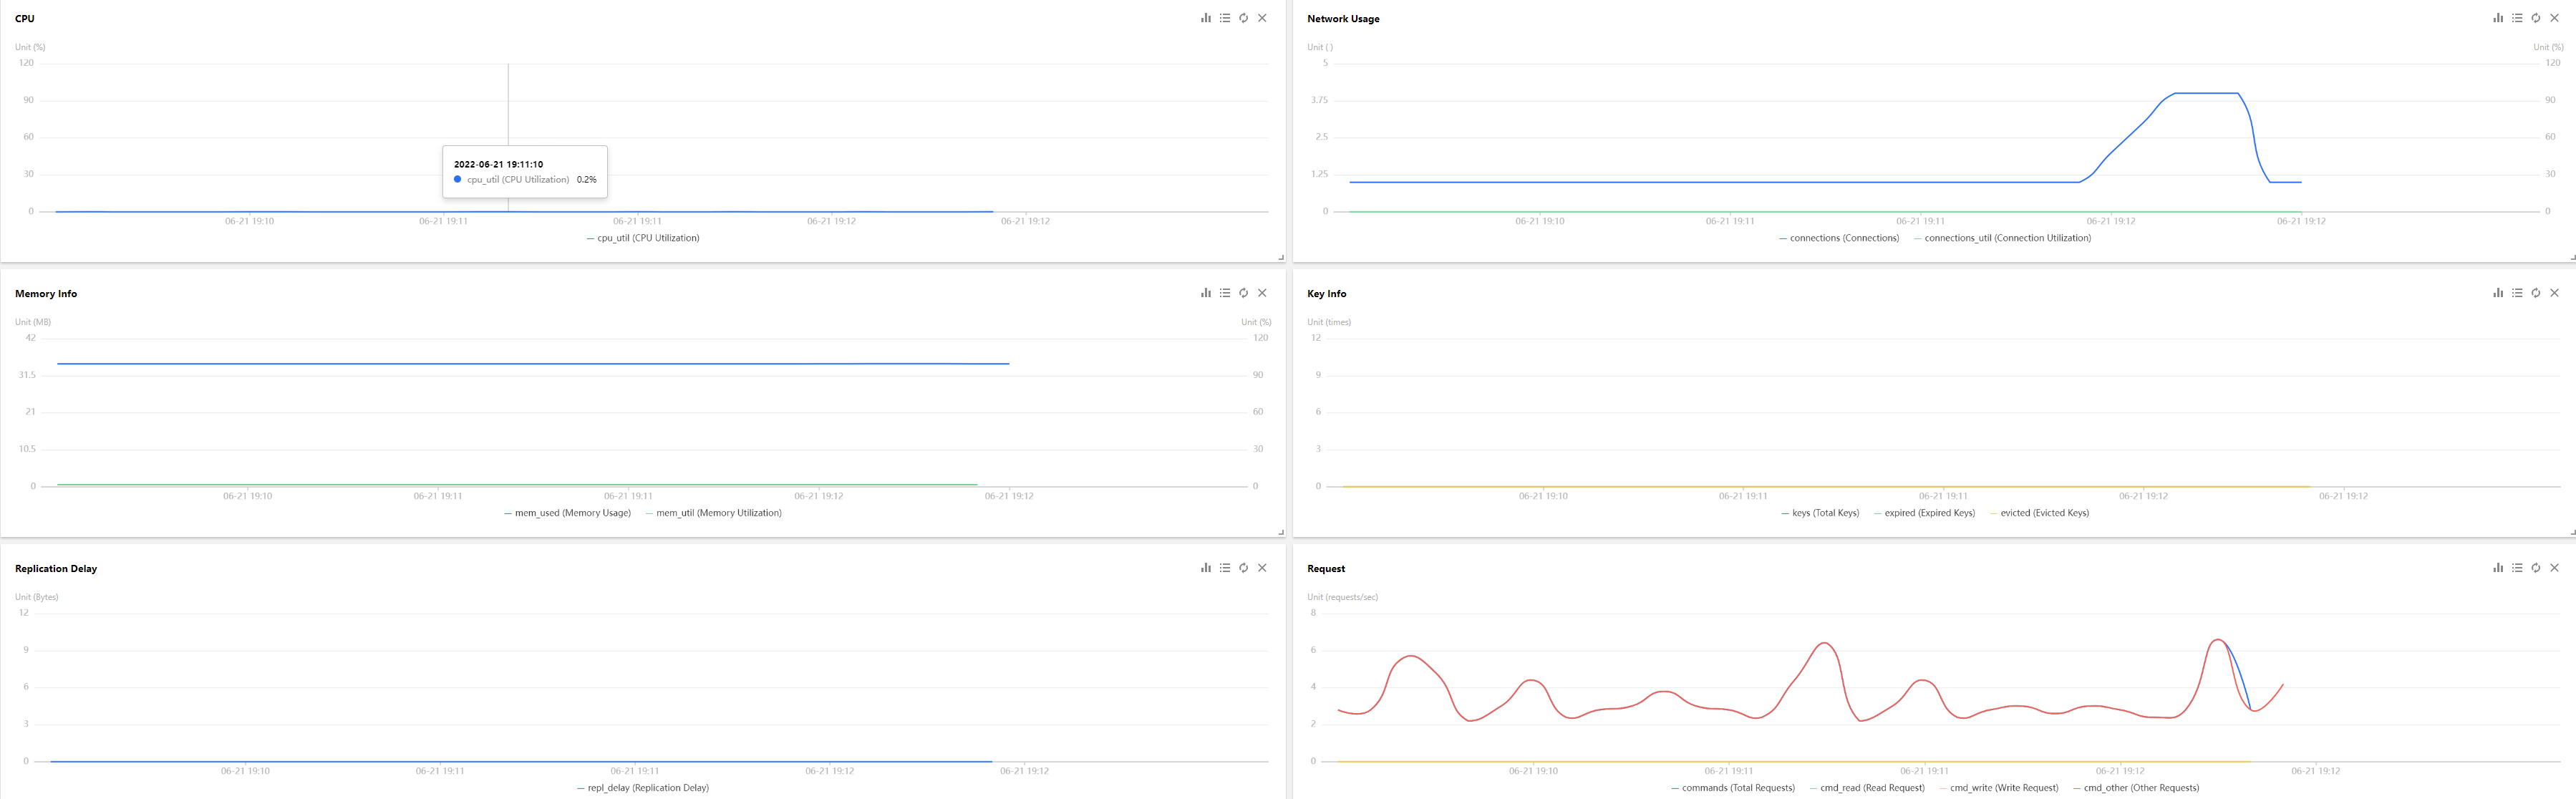
Step 3. View the change trends of the monitoring metrics
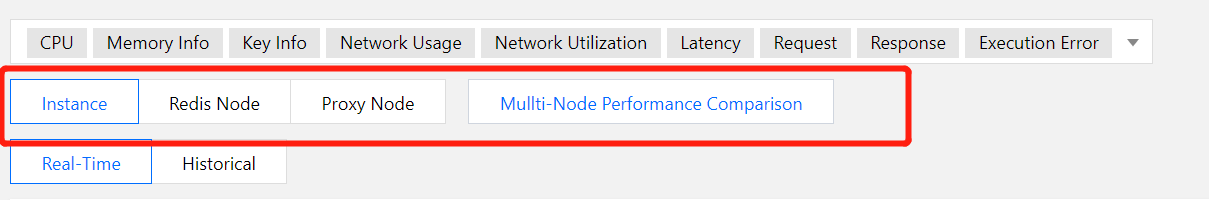
Viewing monitoring metrics in different dimensions
Below the metric categories on the Performance Trends tab, you can view the monitoring metric data by instance, Redis node, and proxy node as needed.
Comparing the performance metrics of multiple nodes
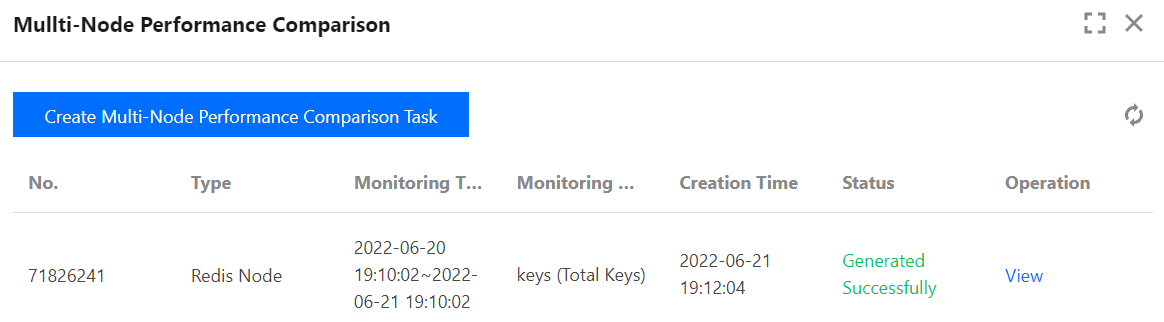
1. On the Performance Trends tab, click Multi-Node Performance Comparison.
2. In the Multi-Node Performance Comparison panel, click Create Multi-Node Performance Comparison Task.
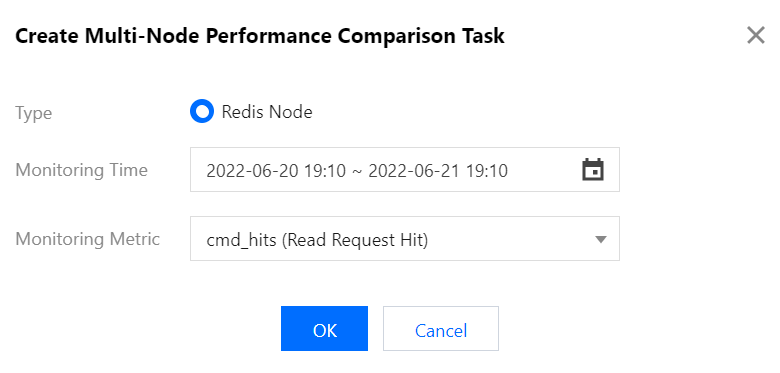
3. In the Create Multi-Node Performance Comparison Task window, click
in the selection box next to Monitoring Time to select the monitoring time period, select the target monitoring metric in the Monitoring Metric drop-down list, and click OK.
4. Wait for the Status to become Successful in the task list in the Multi-Node Performance Comparison panel.
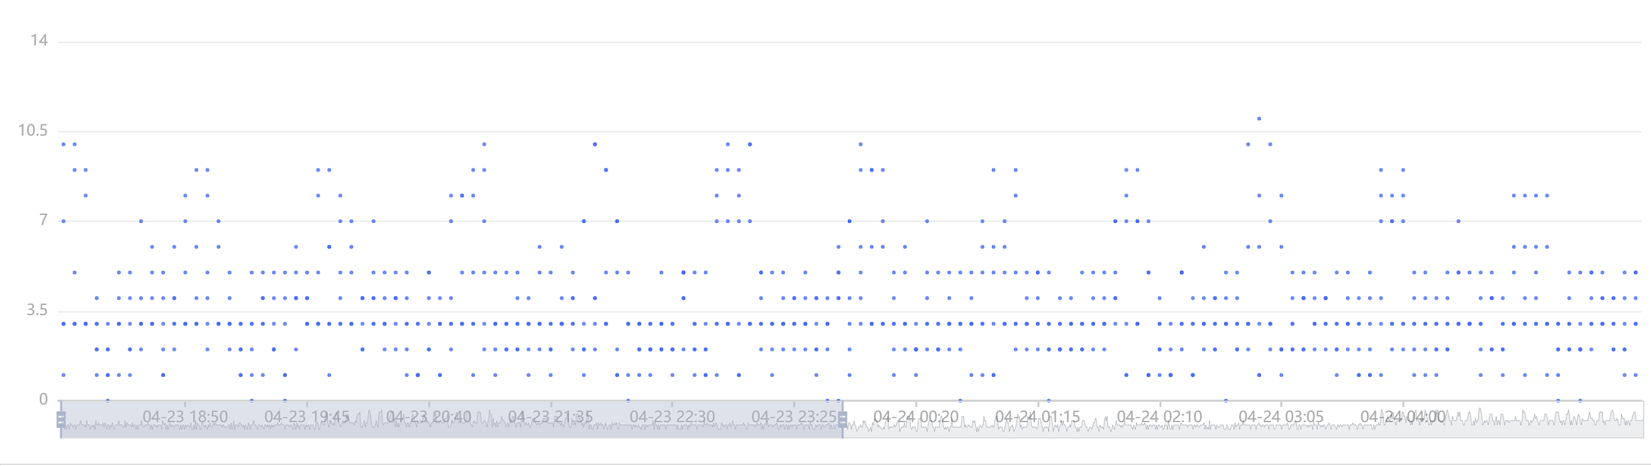
5. Click View in the Operation column to view the comparison data of all Redis nodes. The connections metric is used as an example as shown below:
Switching between real-time and historical views
On the Performance Trends tab, the real-time monitoring data is displayed by default.
In routine Ops monitoring, database instance metrics can be monitored in real time.
When you need to locate exceptions, you can click Historical to analyze the monitoring data in a past time period.
The monitoring data in the last 1 hour, 3 hours, and 7 days can be viewed.
Click
to view the monitoring data in any time period in the last 30 days.
Comparing performance metrics in different time periods
1. On the Performance Trends tab, click Historical and then click Add Time Comparison.
2. In the time selection box, select two time periods for comparison.
3. Select the target monitoring metrics and hover over the change trend in the monitoring view to compare the monitoring data in the two time periods.
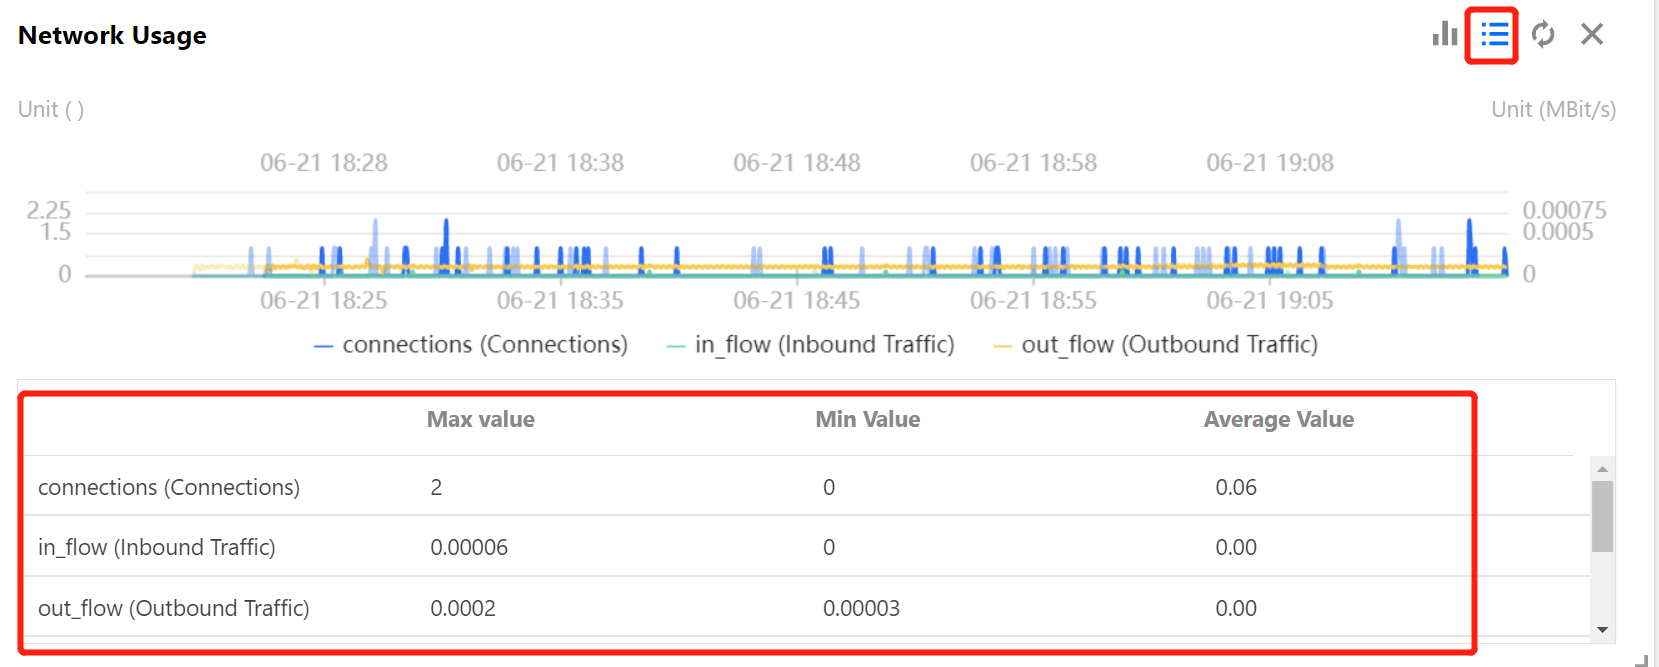
Displaying monitoring metric data in chart
Click
next to Show Statistics as shown below to display the max, min, and average values of each monitoring metric in a table.
Click
in the top-right corner of any monitoring view to display the max, min, and average values of the monitoring metric in a table.
The Network Usage metric is used as an example as shown below:
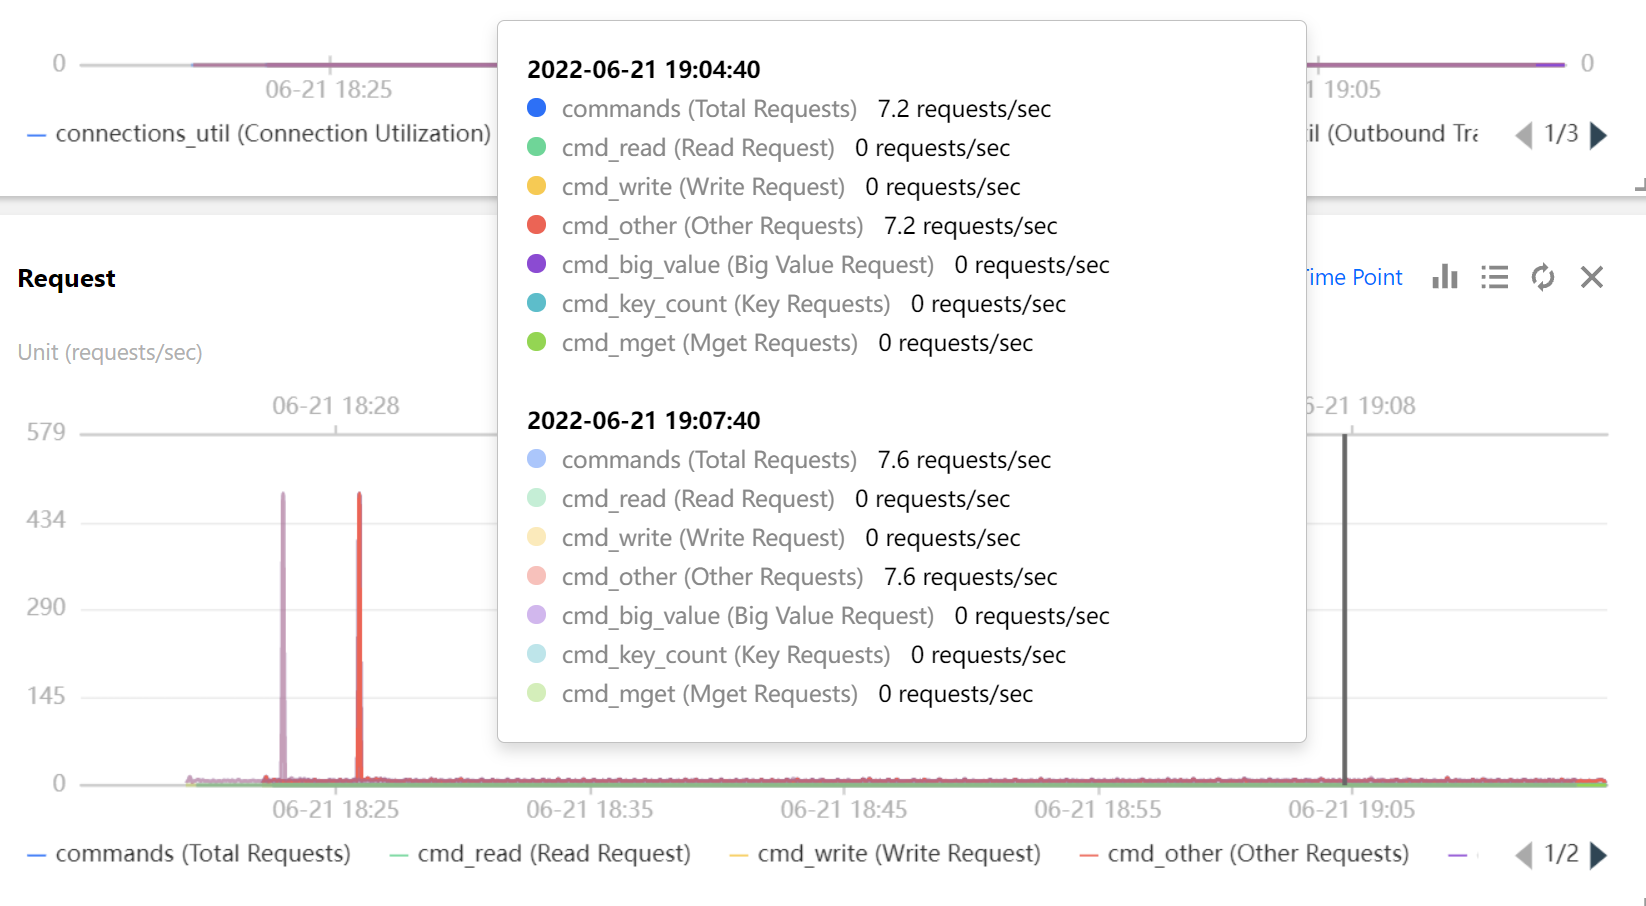
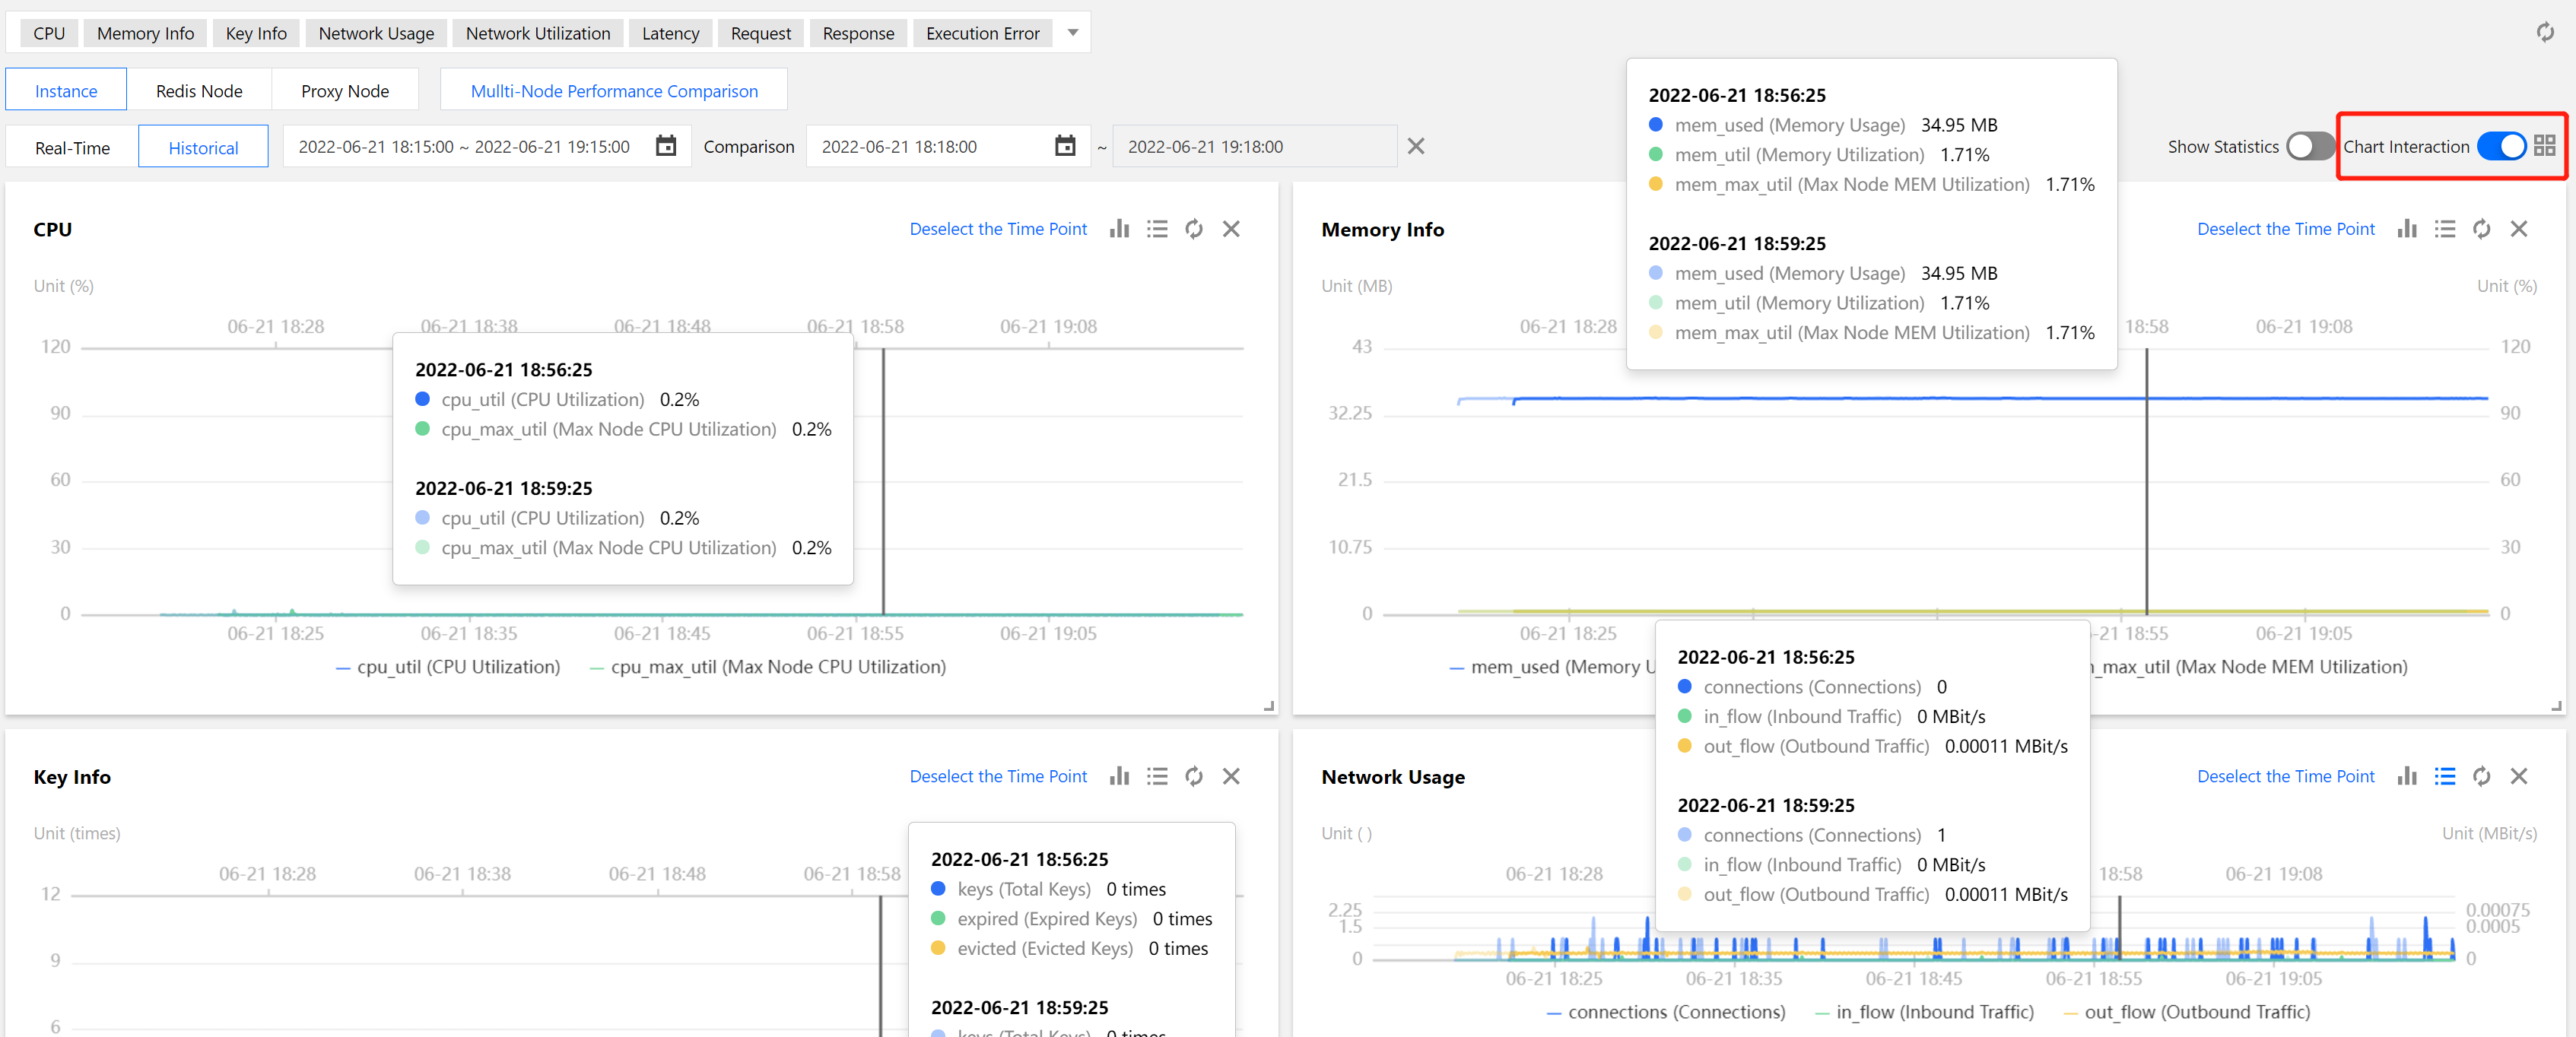
Viewing monitoring data through chart interaction
The Chart Interaction feature is suitable for analyzing the data of a monitoring view and its associated monitoring views.
1. In the top-right corner of the Performance Trends tab, click
next to Chart Interaction.
2. In any of the monitoring views to be analyzed, select a time point and click it, and the data at the same time point will be fixed for display in other monitoring views.
3. You can click Deselect the Time Point in the top-right corner of the monitoring view to cancel the fixed display.
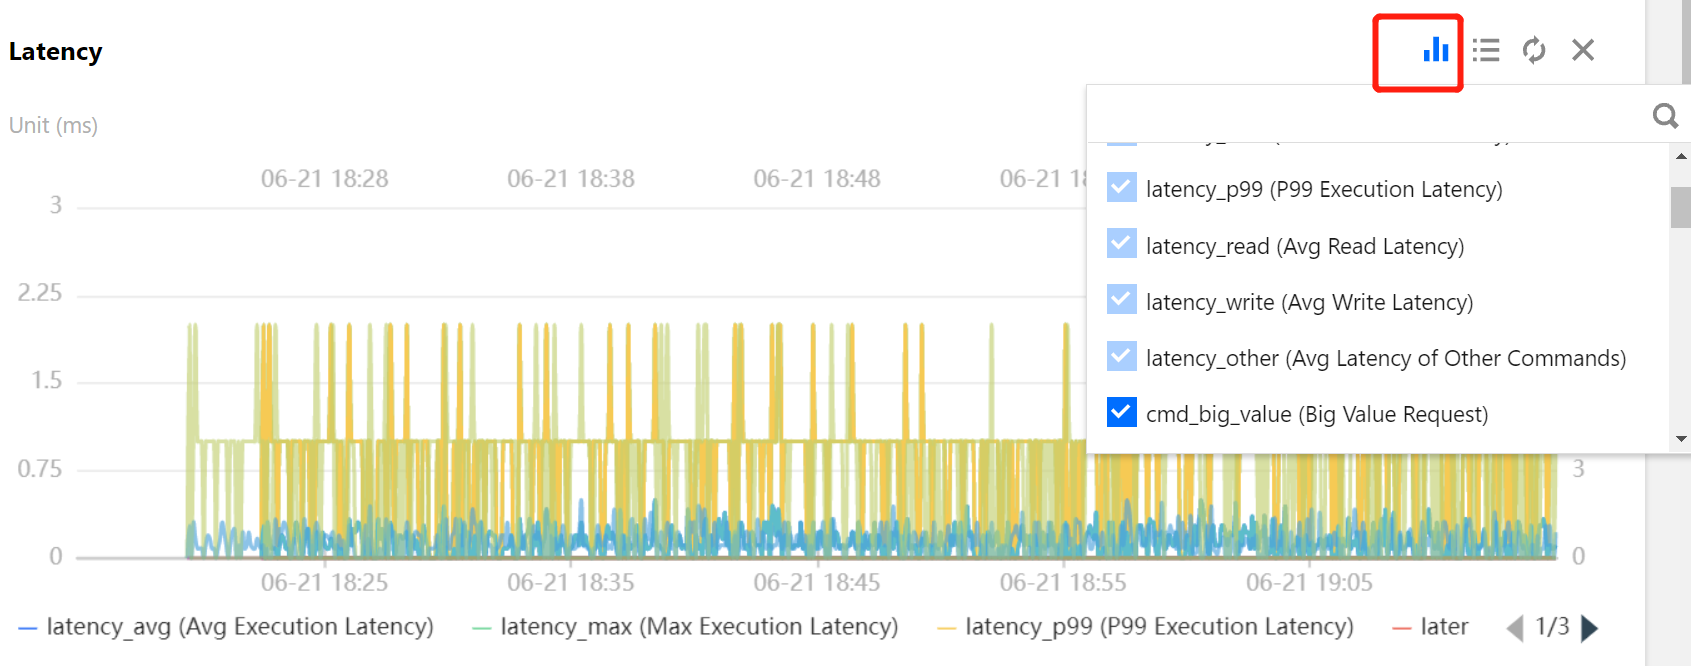
Customizing monitoring metric for comparative analysis
Click
in the top-right corner of any monitoring view to add monitoring metrics of other types for comparative display and analysis.
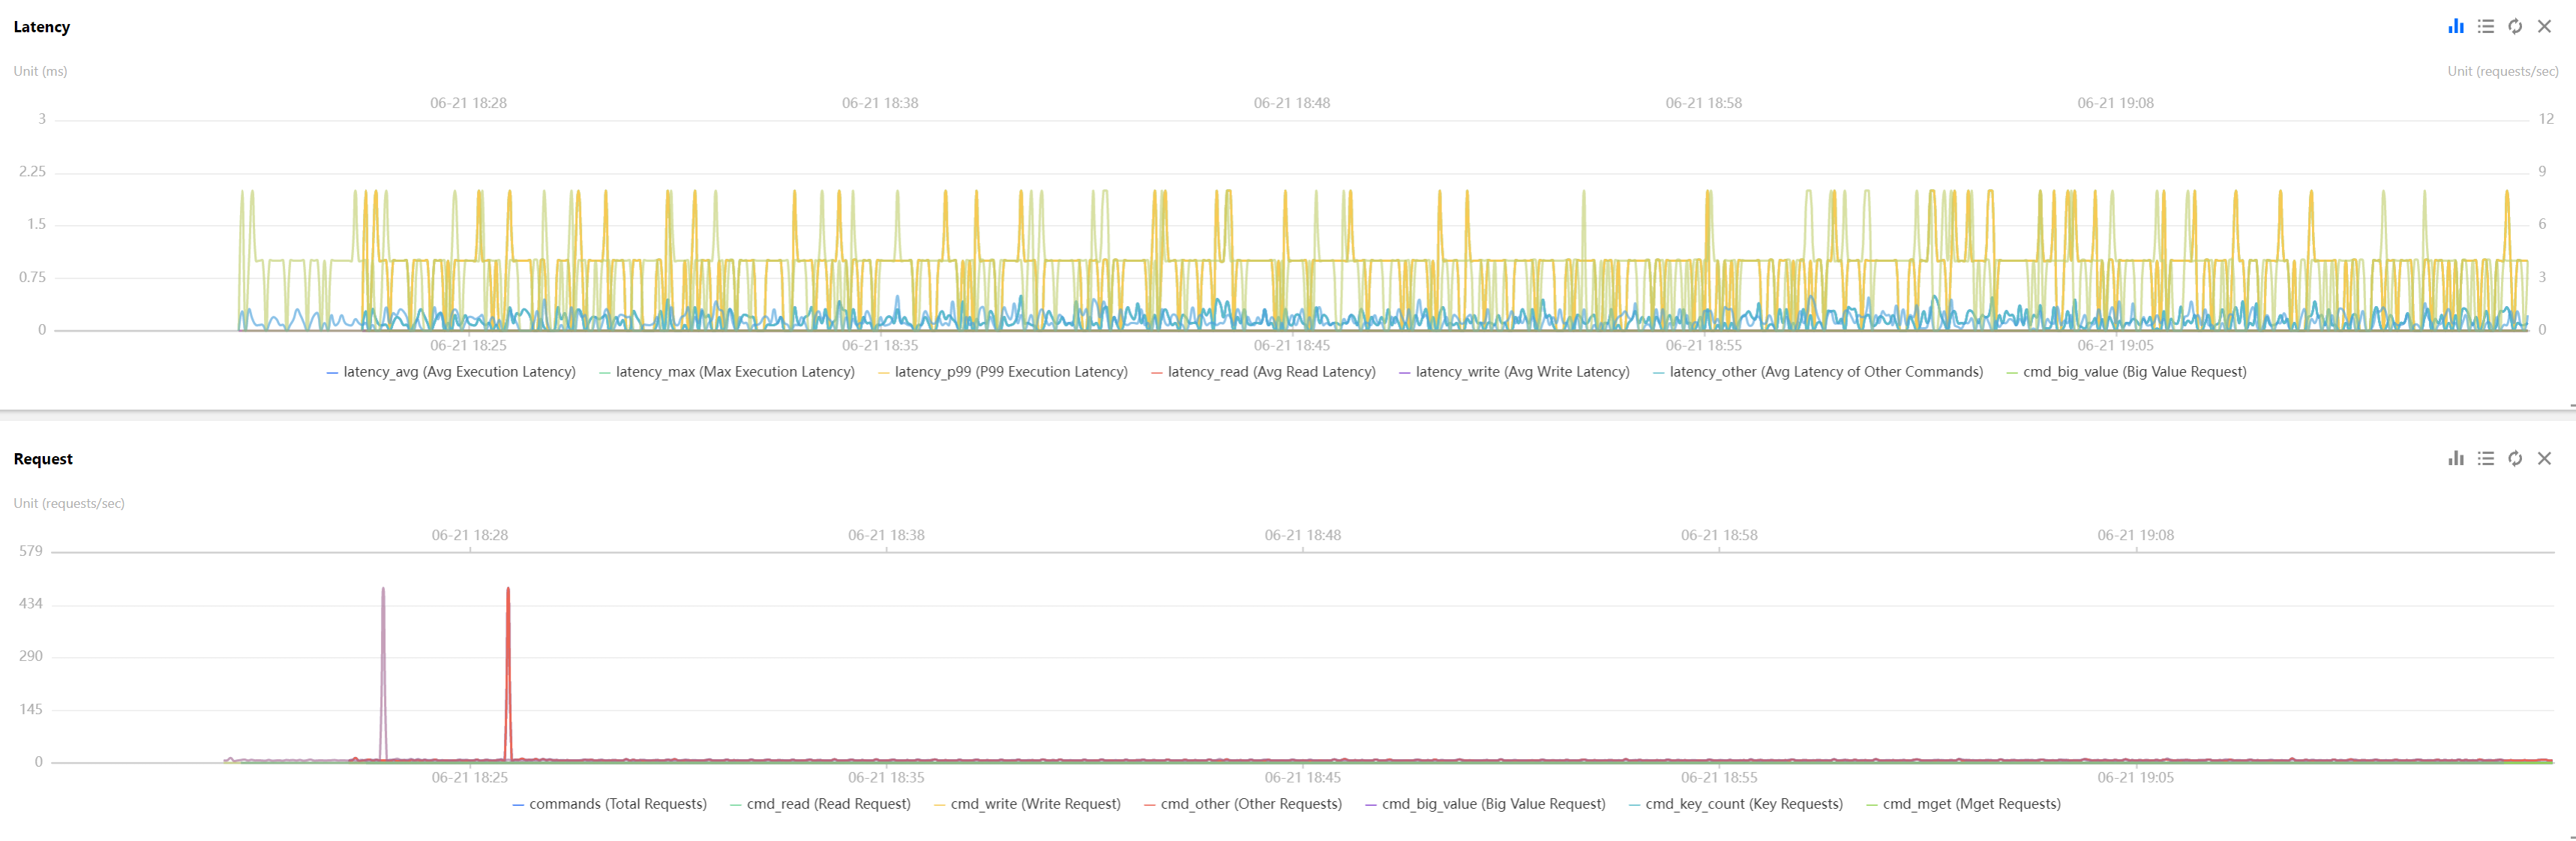
Switching between one-column and two-column mode of monitoring view
Click
on the right of Chart Interaction in the top-right corner to switch between the one-column and two-column modes. The former is as shown below:
Dragging monitoring view
The monitoring views can be freely dragged to flexible adjust their order for efficient display and analysis.
Zooming in on monitoring view
Drag the icon in the bottom-right corner of any monitoring view to zoom in on the image for clearer display of the metric trends.


 Yes
Yes
 No
No
Was this page helpful?