Monitoring Through Prometheus
Unduh
Mode fokus
Ukuran font
Scenarios
This document describes how to use Prometheus to obtain monitoring data for the Cloud Native Gateway. TSF supports two methods: associating with Tencent Cloud Prometheus and configuring a self-managed Prometheus.
Associating with a Tencent Cloud Prometheus instance: After associating with a Prometheus instance, the gateway automatically reports monitoring data to the associated Prometheus instance.
Configuring a self-managed Prometheus: Configure the gateway node information on your Prometheus Server to collect data.
Prerequisites
The cloud-native gateway instance has been purchased. For details, see Operation Documentation.
You have a Tencent Cloud Prometheus instance or a self-managed Prometheus instance.
Method 1: Associating with a Tencent Cloud Prometheus Instance
1. Log in to the TSF console.
2. In the left sidebar, click Cloud Native Gateway to go to the corresponding gateway instance, and then select Data Observation.
3. Click the Prometheus tab > Associate with a Tencent Cloud Prometheus instance.
4. Select the Tencent Cloud Prometheus instance you want to associate with. (You can only select Prometheus instances in the same VPC as the gateway instance.)
5. Click Confirm to complete the association.
Method 2: Configuring a Self-Built Prometheus Instance
Step 1: Enabling the Prometheus Plugin
To use Prometheus for monitoring, you must enable the Prometheus plugin on the Cloud Native Gateway. You can select from the following two feature scenarios based on your needs:
Scenario 1: Enabling the Prometheus Plugin for a Specified API
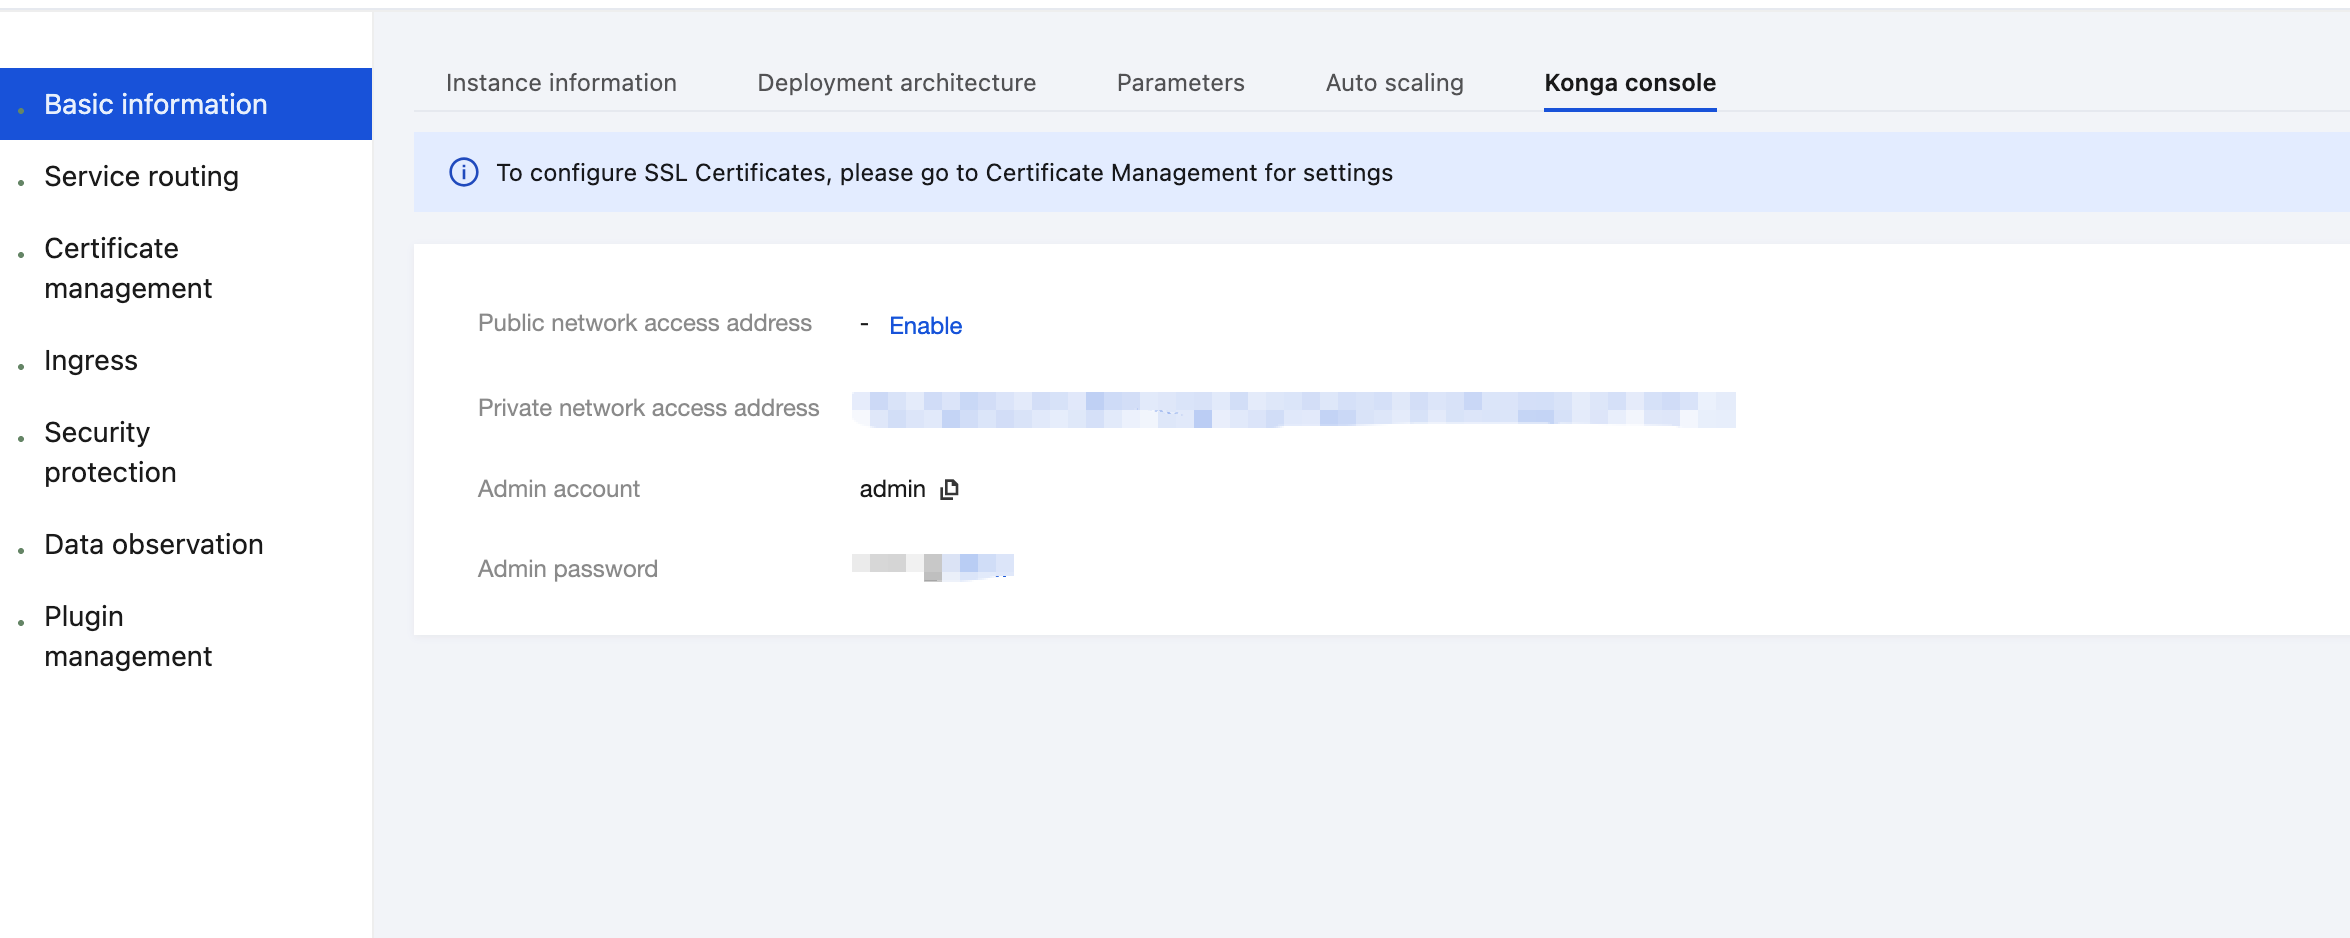
1. Log in to the TSF console, go to the details page of the gateway instance for which the Prometheus plugin needs to be configured, and view the Konga console login method on the Konga Console tab page.
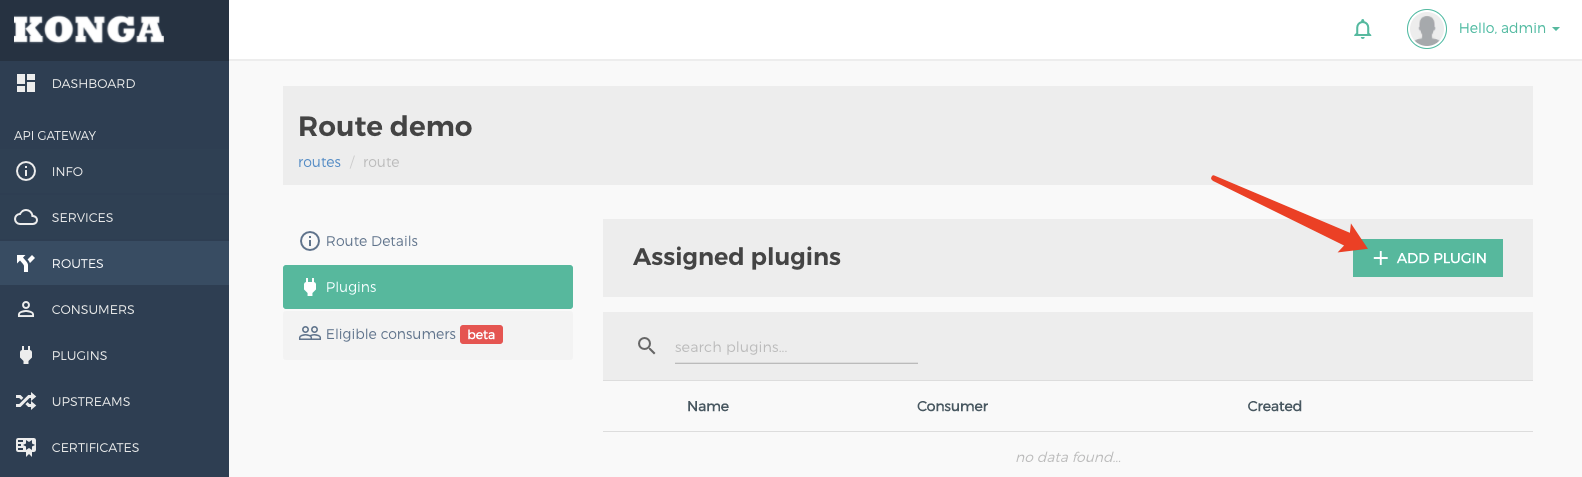
2. Log in to the Konga console, go to the details page of the route for which the Prometheus plugin needs to be added, click ADD PLUGIN, and select Prometheus under the Analytics & Monitoring group.
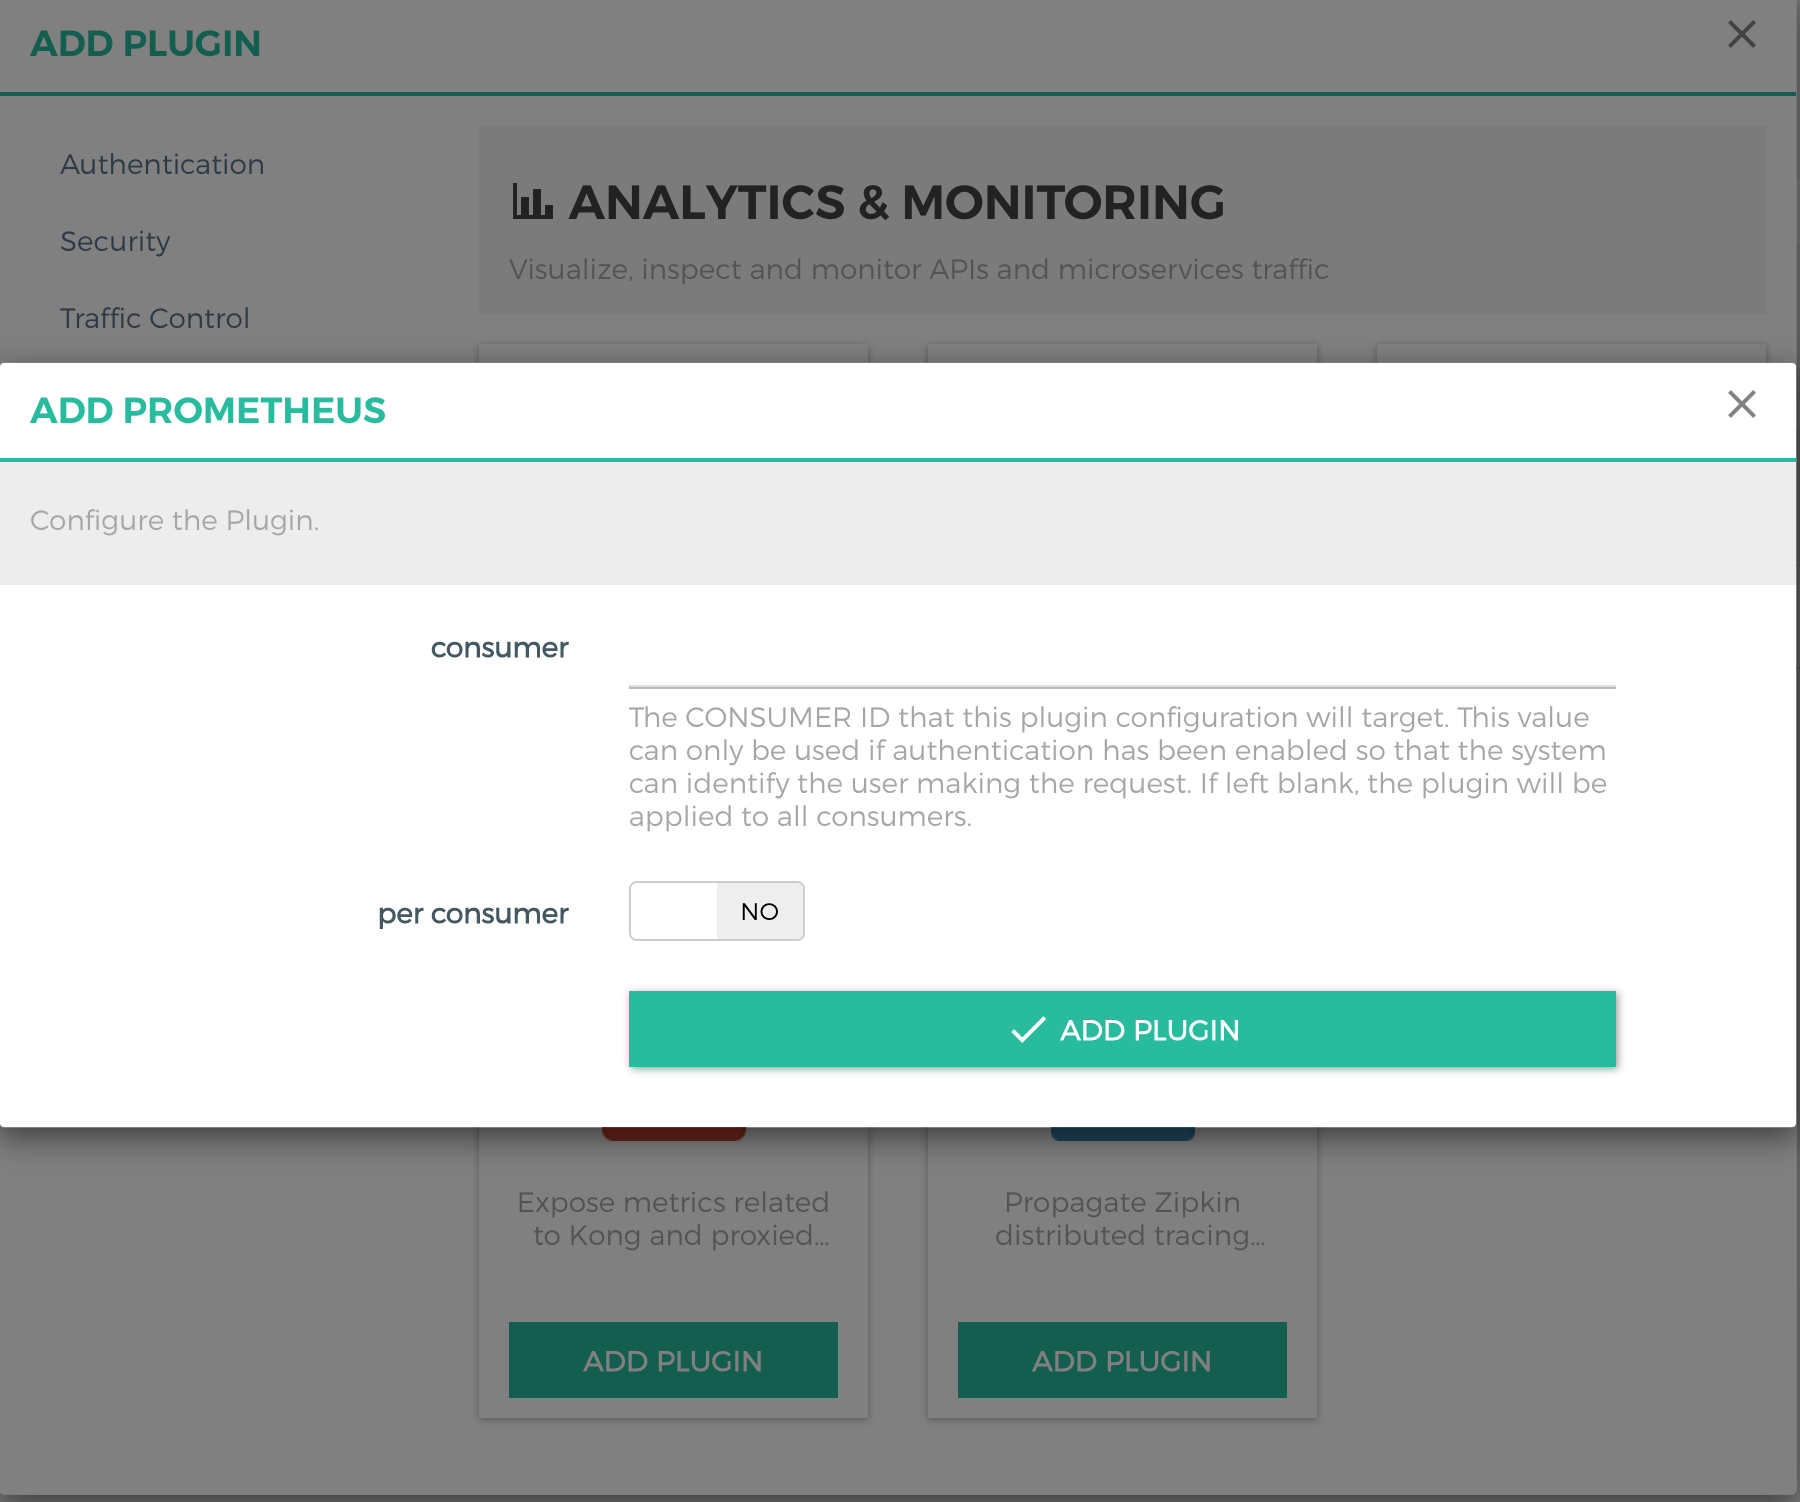
3. On the Prometheus plugin configuration page, retain the default settings if you do not need to collect metric data by consumers.
Scenario 2: Enabling the Prometheus Plugin Globally
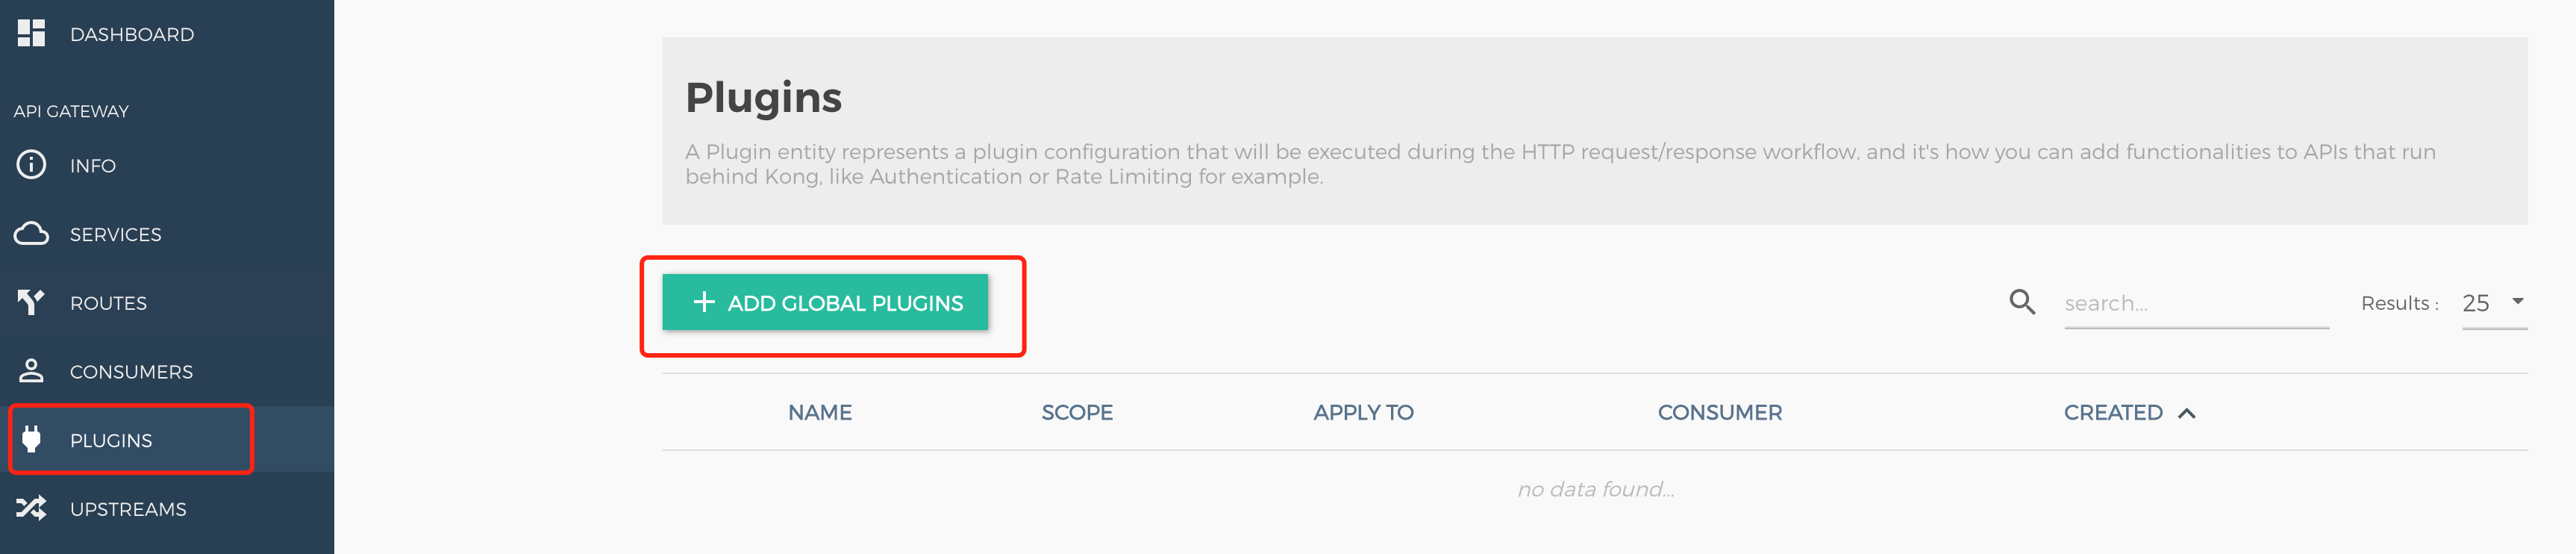
1. In the left sidebar, click PLUGINS, click ADD GLOBAL PLUGINS, and select Prometheus under the Analytics & Monitoring group.
2. Log in to the TSF console, go to the details page of the gateway instance for which the Prometheus plugin needs to be configured, and view and Konga console login method on the Konga Console tab page.
Step 2: Configuring the Data Pulling Address
1. Prepare a Tencent Cloud or self-managed Prometheus instance. The Prometheus instance in this step is used to pull monitoring data from the Cloud Native Gateway Kong.
Note:
For details on how to purchase Tencent Cloud Prometheus instances and activate mapping Grafana instances, see documents related to TencentCloud Managed Service for Prometheus.
2. Log in to the TSF console, click Cloud Native API Gateway, and click an instance ID to go to the instance details page. Choose Basic Information > Deployment Architecture, and view the private network node address of the gateway instance.
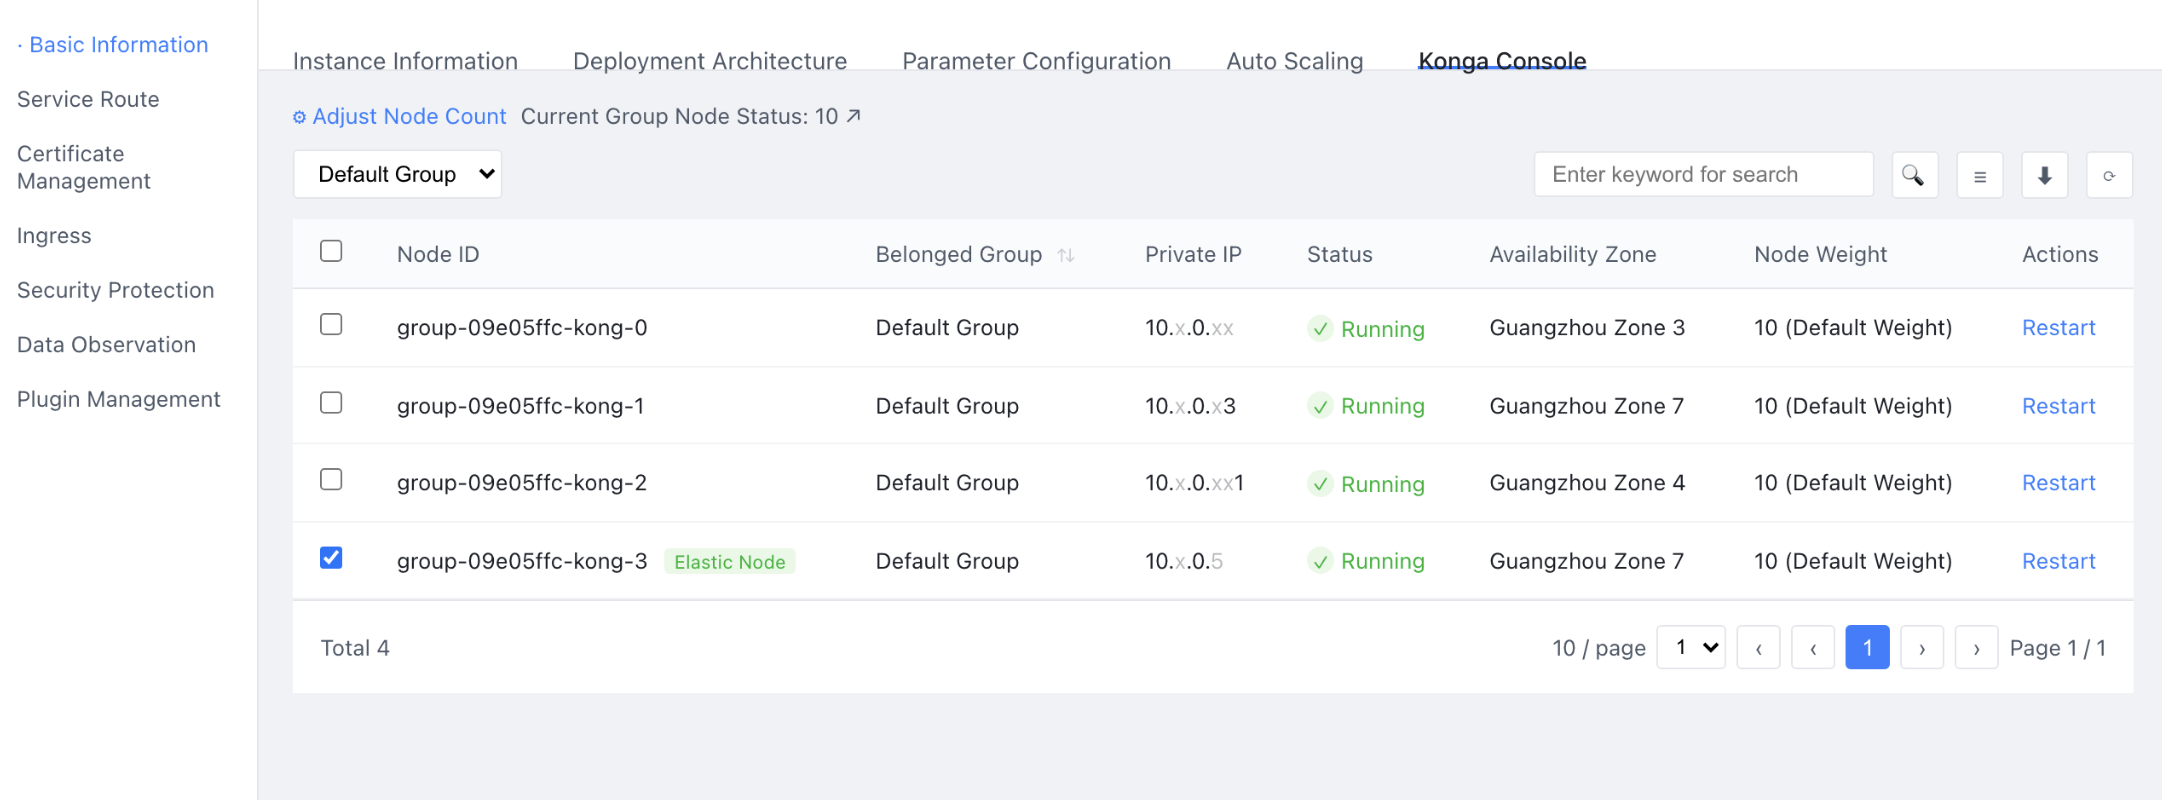
3. If you use the Prometheus agent, you can add a list of private network node addresses in scrape_configs.static_configs.targets in the prometheus.yml configuration file. Note that the port should be set to 2100. (For instances created before April 18, 2023, set the port to 8100). For example, for the private network address list shown in the preceding figure, configure the prometheus.yml configuration file based on the following parameters:
job_name: konghonor_timestamps: truemetrics_path: /metricsscheme: httpstatic_configs:- targets:- 172.27.0.35:2100- 172.27.0.133:2100- 172.27.0.79:2100labels:instance: gateway-f3bdaaa7relabel_configs:- source_labels: [__address__]target_label: node
Attention:
1. Configure relabel_configs to ensure metric reporting accuracy.
2. Ensure that the Prometheus agent and gateway instance are in the same VPC to maintain network connectivity.
3. Ensure that port 2100 is open in the security group of the Prometheus Agent Egress. (For instances created before April 18, 2023, open port 8100). This allows the gateway to collect data.
4. If you use a custom program for data collection, you can automatically obtain the node IP list through the DescribeCloudNativeAPINodes API of Cloud Native Gateway.
Step 3: Importing the Cloud Native API Gateway Dashboard Template on Grafana (Optional)
This step guides you on how to display the gateway monitoring data collected by Prometheus in the Grafana instance.
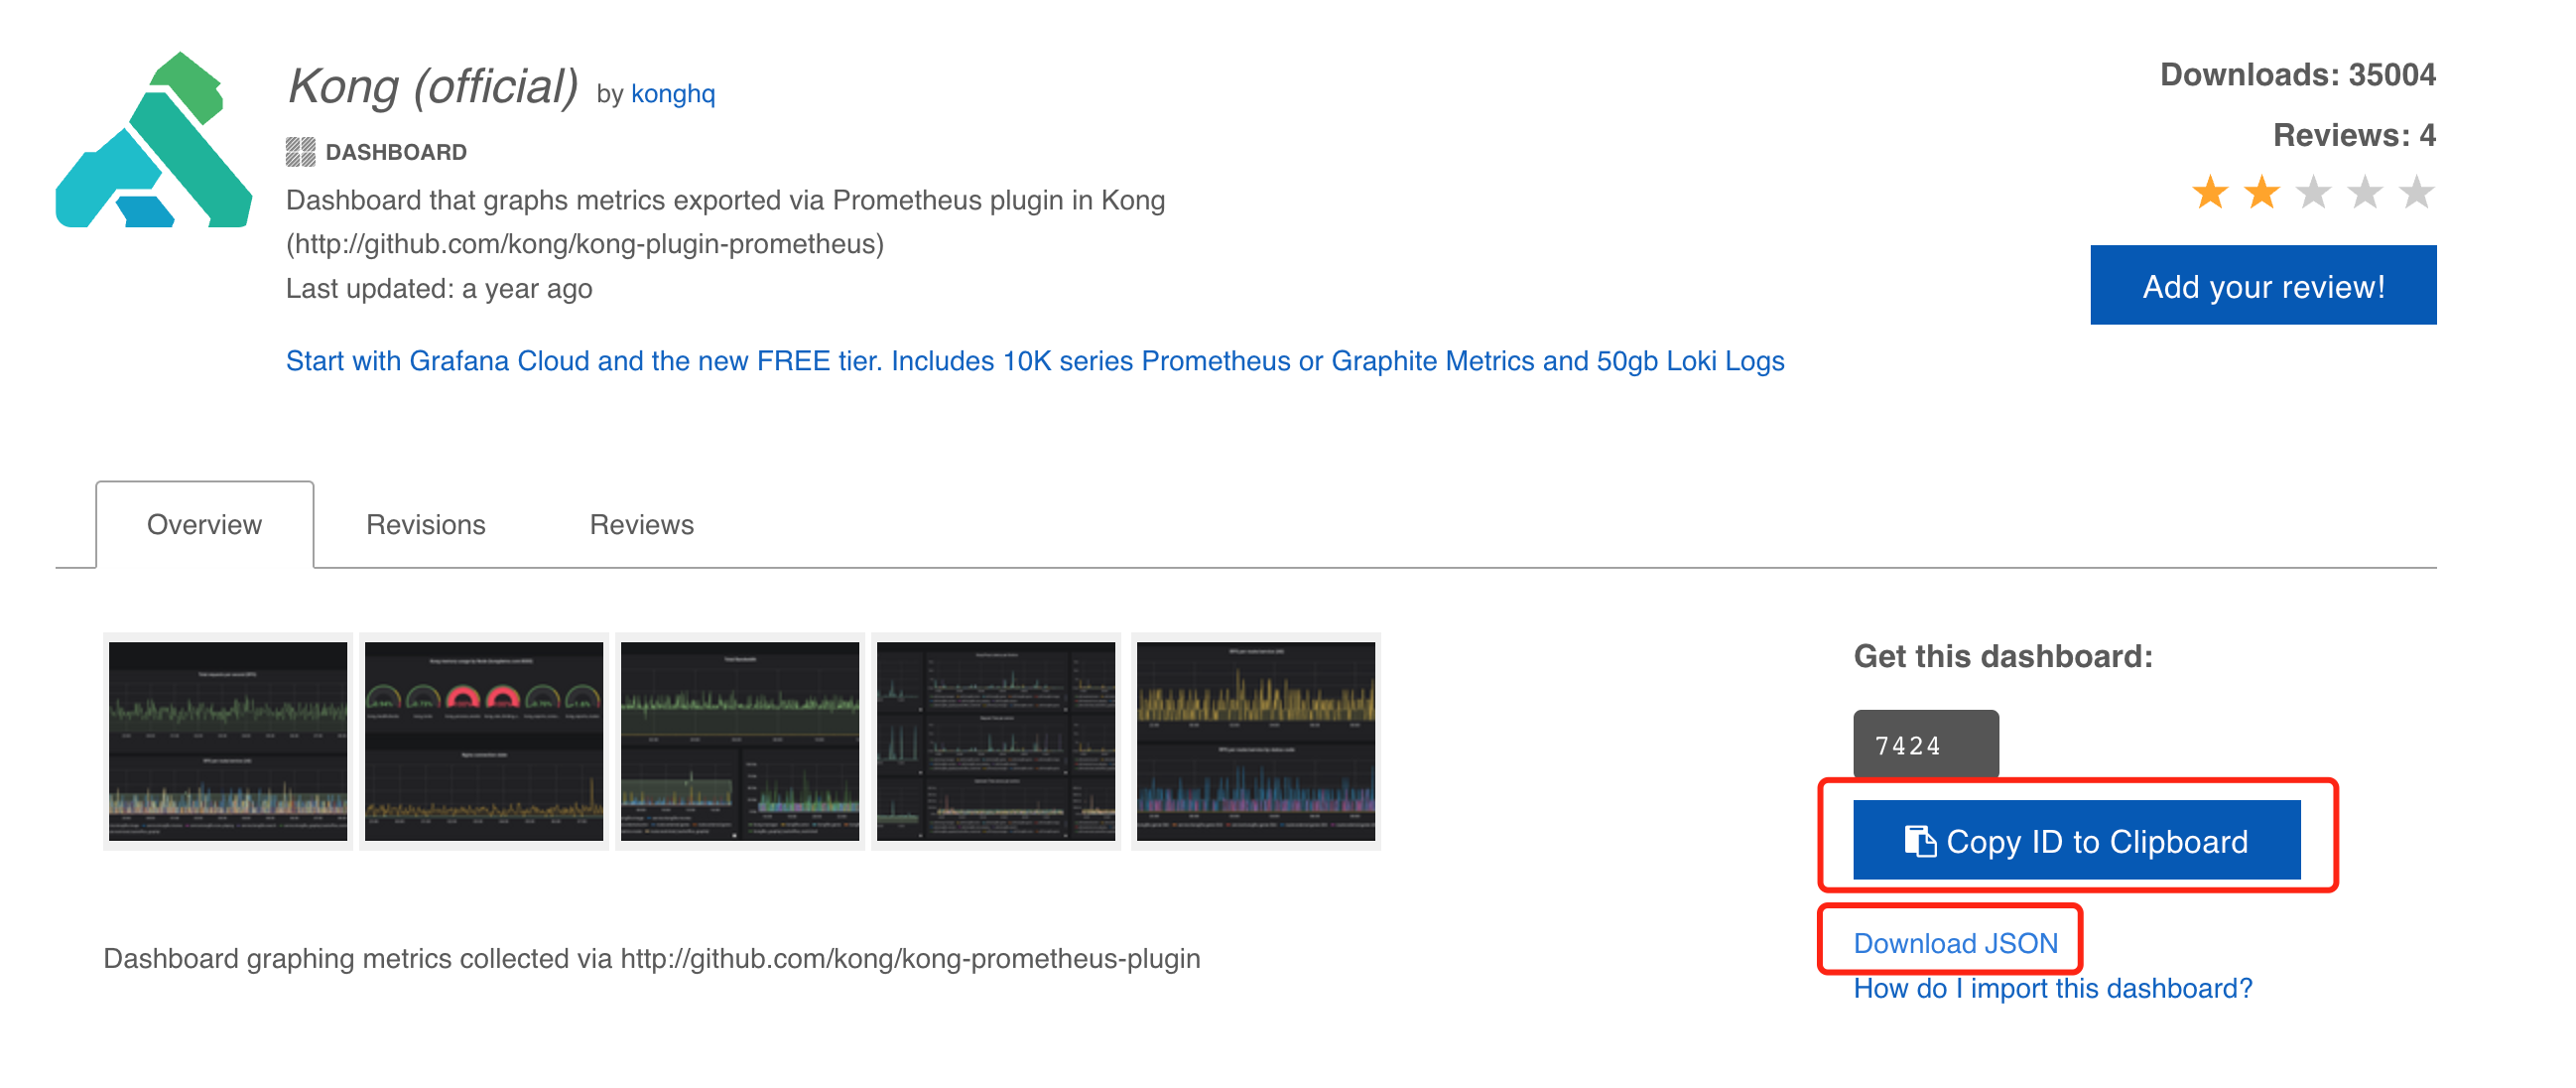
1. Go to the Grafana-Kong official website and download the dashboard configuration JSON file.
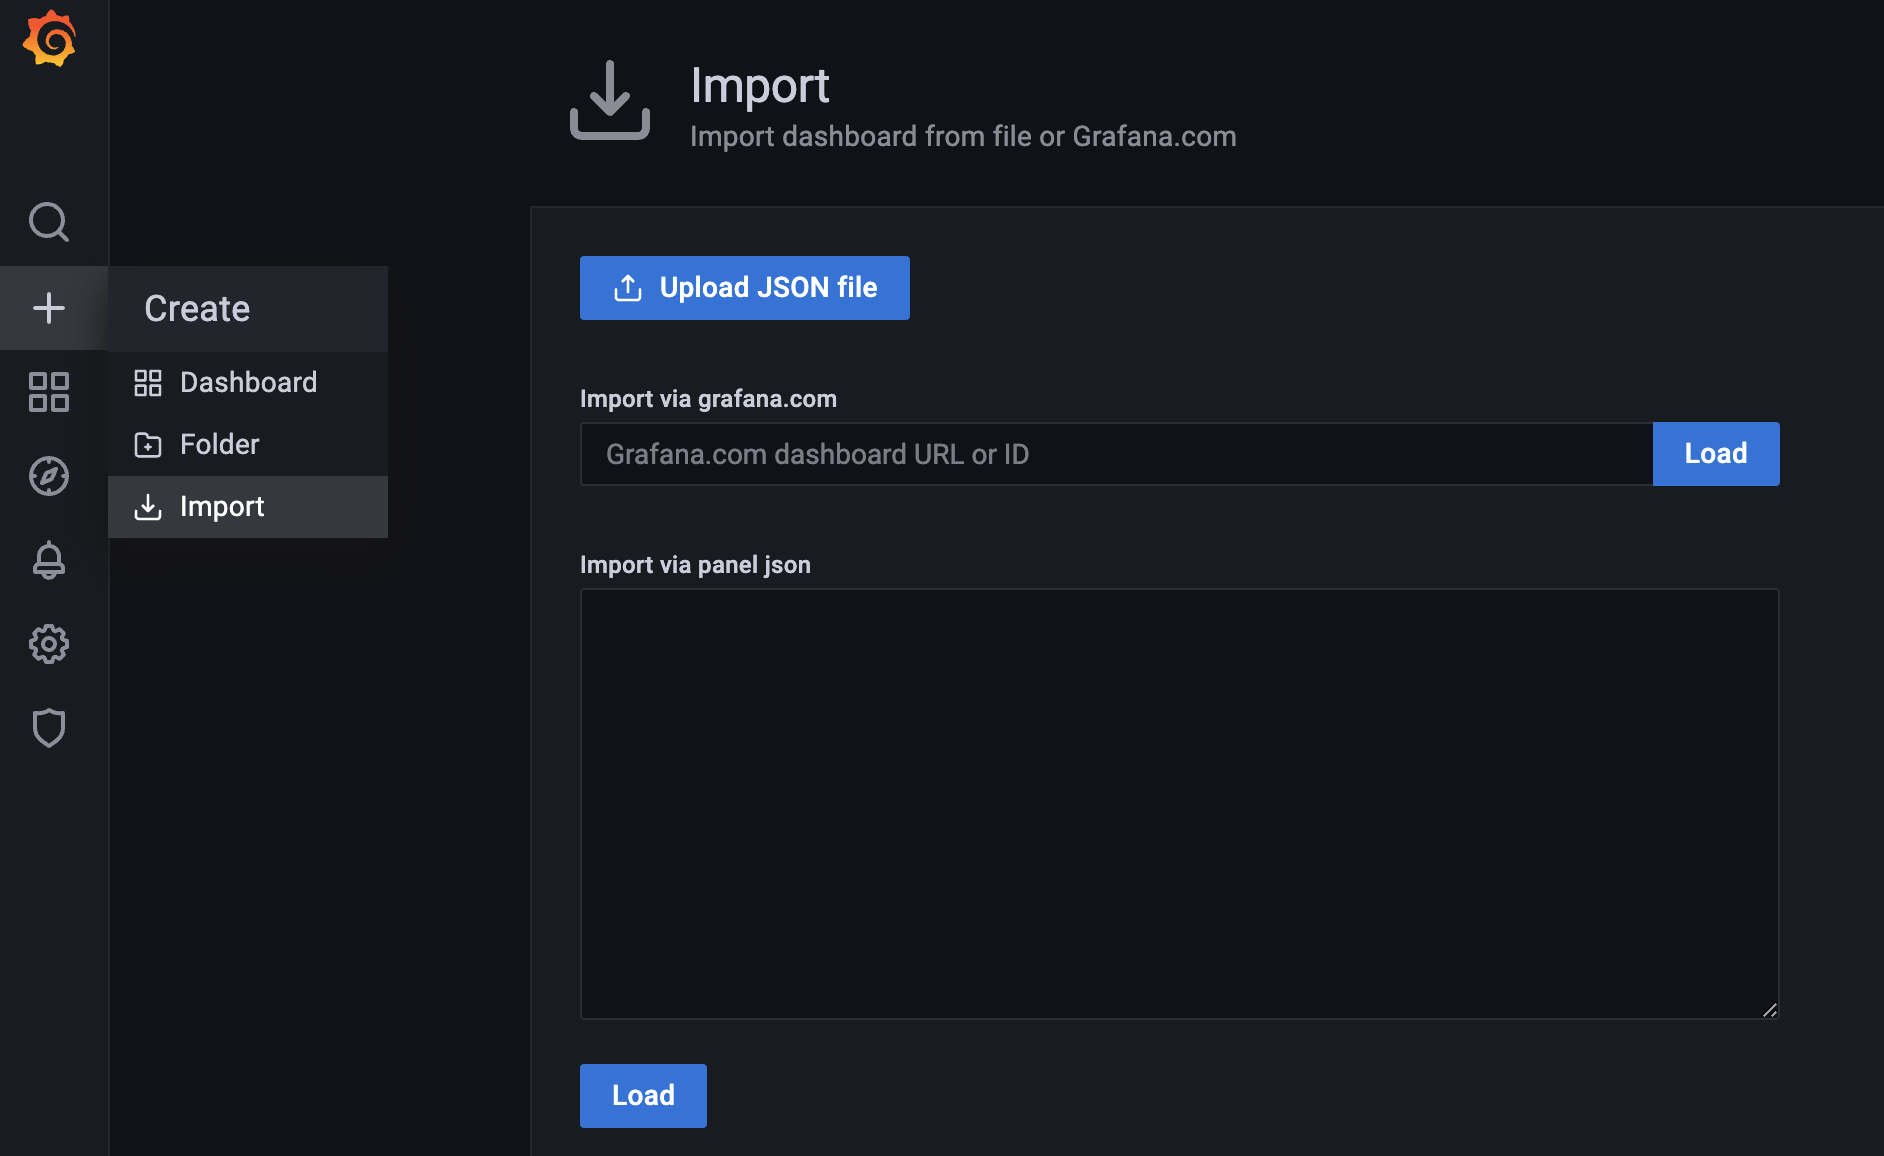
2. Import the dashboard template of Cloud Native API Gateway to your Grafana instance.
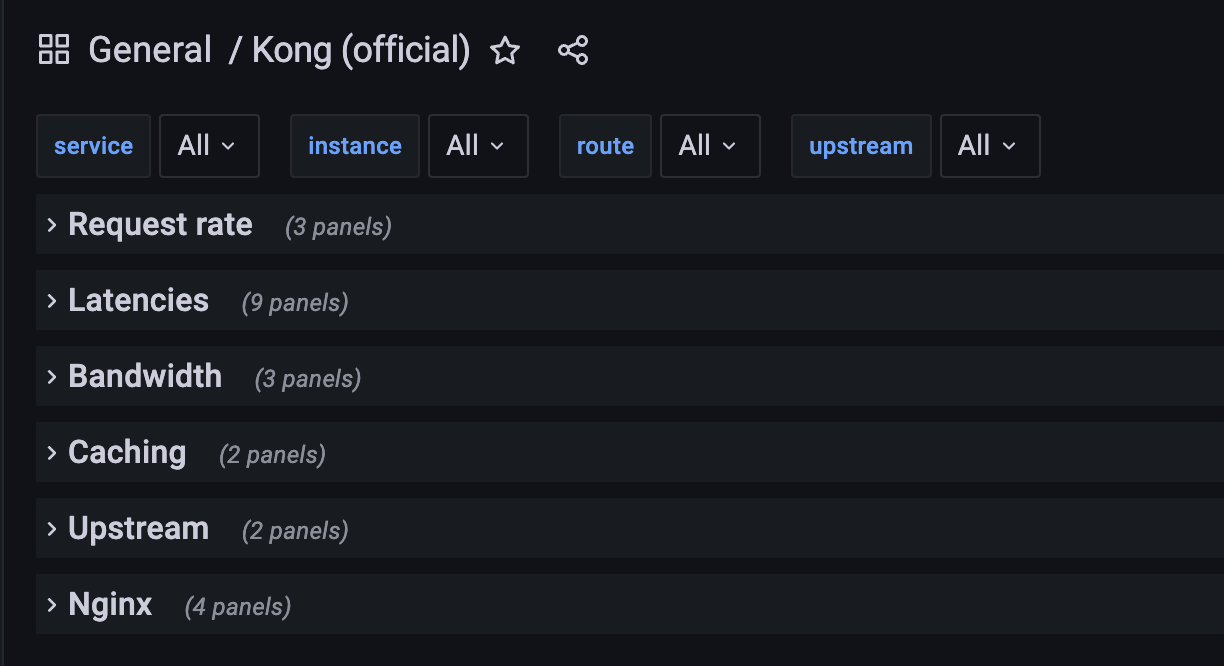
3. After the dashboard template of Cloud Native API Gateway is imported, Grafana displays views similar to the following figure if data is reported to Prometheus.
Must-Knows
Enabling the Prometheus plugin affects data stream performance of the gateway. You are advised to enable the Prometheus plugin only for specific APIs (routes) that require monitoring.
Purchasing Cloud Monitor Prometheus on Tencent Cloud will charge fees, which you should bear.
For simplicity, the operations above are demonstrated using the Konga console. You can also bind the Prometheus plugin by calling the Kong Admin API. For details, see Kong-Prometheus plugin documentation. For information on how to enable the Kong Admin API, see Enable Admin API and Configure Security Authentication.
References
Bantuan dan Dukungan
Apakah halaman ini membantu?
Anda juga dapat Menghubungi Penjualan atau Mengirimkan Tiket untuk meminta bantuan.
masukan