Encrypted Traffic Detection
Baixar
Modo Foco
Tamanho da Fonte
Overview
NDR now includes encrypted traffic detection. This feature supports parsing and detecting encrypted traffic (such as HTTPS/TLS) for CVM assets, container assets, and internet border traffic assets, comprehensively enhancing visibility and threat detection capabilities for all traffic. You can refer to this document to learn how to configure and use this feature.
Note:
Encrypted traffic detection requires that the asset's NDR switch is already in the "Enabled" state. If it is not enabled, the encrypted traffic detection switch in the corresponding row will be unavailable. Hovering the mouse over it will display the message: "Enable NDR collection first, then enable encrypted traffic detection." For details on enabling NDR traffic access, see Traffic Access.
This is currently a public beta version, which is only available to invited users. If you are not an invited user and want to try it, you can submit a ticket to apply.
Prerequisites
You need to configure security group rules to grant the probe permission to collect network traffic, meeting the data input requirements for NDR.
The target asset must have TAT or CWPP Agent installed and enabled, so that the system can automatically deploy the NDR Agent through available channels.
For the EIPs associated with Internet Border Traffic assets, you must first enable the Serial Mode of the Internet Firewall.
Note:
The system first attempts to deploy the endpoint probe through the TAT channel. If TAT is unavailable, it automatically falls back to the host channel to complete the installation. If both channels are unavailable, the page will display a banner notification, indicating that the current instance does not meet the Agent installation requirements.
Method 1: Configuration of the Enterprise Security Group
1. Log in to the Cloud Firewall console, choose Access Control > Enterprise Security Group (New).
2. On the Enterprise Security Group page, click IPv4 > Add Rule, and fill in the rule information according to the requirements in the table.
Configuration Item | Set Value |
Access source IP address | 0.0.0.0/0 |
Access destination IP address | 9.9.9.199 |
Destination port | 47891,47892,47893 |
Protocol | UDP |
Policy | Allow |
Description | NDR allow rule |
3. Click Save, and the rule will be deployed to associated instances.
Method 2: Configuration of the Single Instance
1. Log in to the CVM console, and choose Instances.
2. On the instance page, click the instance name that requires detection of encrypted traffic to be enabled.
3. On the instance details page, choose Security Group, and click the Security Group ID/Name that is already bound.
4. Click Add Rule, and fill in the rule information according to the requirements in the table.
Configuration Item | Set Value |
Type | Custom |
Target | 9.9.9.199 |
Protocol Port | UDP: 47891,47892,47893 |
Policy | Allow |
Remark | NDR allow rule |
5. Click OK, and the rule will be deployed to associated instances.
Specification Description
Specifications include the applicable scope and capabilities of encrypted traffic detection, as well as resource consumption.
Note:
For CVM assets and container assets, specifications primarily refer to host and cluster resources. For GAAP assets, specifications refer to the performance metrics of their acceleration instances. Under the internet border traffic scenario, resource occupancy is consistent with that of the underlying CVM.
Viewing Specifications
1. Log in to the CFW console, in the left sidebar, click Network Detection and Response.
2. On the NDR page, click View Applicable Scope and Capabilities, Resource Occupancy to view the detailed applicable scope and capabilities, and resource occupancy in the side panel.
Kernel Version Compatibility
Linux kernel version | Applicable | Not applicable |
Below 4.18 | Curl command Python version 3.8.15 and above | OpenSSL dynamic library Java program Golang program |
Greater than or equal to 4.18 | OpenSSL dynamic library Curl command Python version 3.8.15 and above GnuTLS dynamic library Golang program | Java programs |
Specific Decryption Capability
Protocol compatibility: HTTPS, SMTPS, FTPS.
Algorithm support: TLS 1.2 / 1.3 (RSA, ECDHE, DHE).
Length: The maximum length of a single encrypted traffic packet that can be decrypted is 64K.
Performance: 10 Gbps (supports dynamic scaling out).
Resource consumption
CVM and GAAP Encrypted Traffic Detection
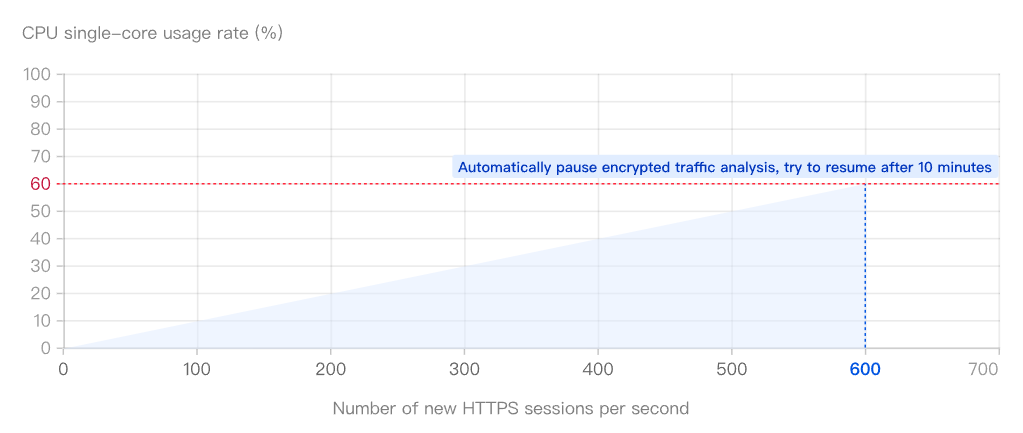
Resource occupancy: Under the traffic pressure of establishing 100 new HTTPS sessions per second, the resource utilization of the encrypted traffic detection Agent is as follows.
CPU occupancy: When continuously establishing new HTTPS sessions at a rate of 100 per second in the runtime environment, the single-core CPU utilization is approximately 10%. It supports up to 60% occupancy rate, corresponding to about 600 new HTTPS sessions per second.
Memory usage: Initialization occupies 100 MB, which increases as the number of new HTTPS sessions grows, with a maximum occupancy of 500 MB.
Exceeding Limits and Suspension:
Trigger condition: When CPU or memory usage exceeds the limit, the Agent automatically pauses the encrypted traffic analysis feature.
Scope of impact: Other basic features remain unaffected, and the Agent will not disrupt existing service connections. However, it will not generate new encrypted traffic analysis results.
Recovery mechanism: The system automatically attempts to resume analysis every 10 minutes. If the limit is still exceeded after resumption, the analysis will remain paused until resource usage falls back within the threshold.
Container Encrypted Traffic Detection
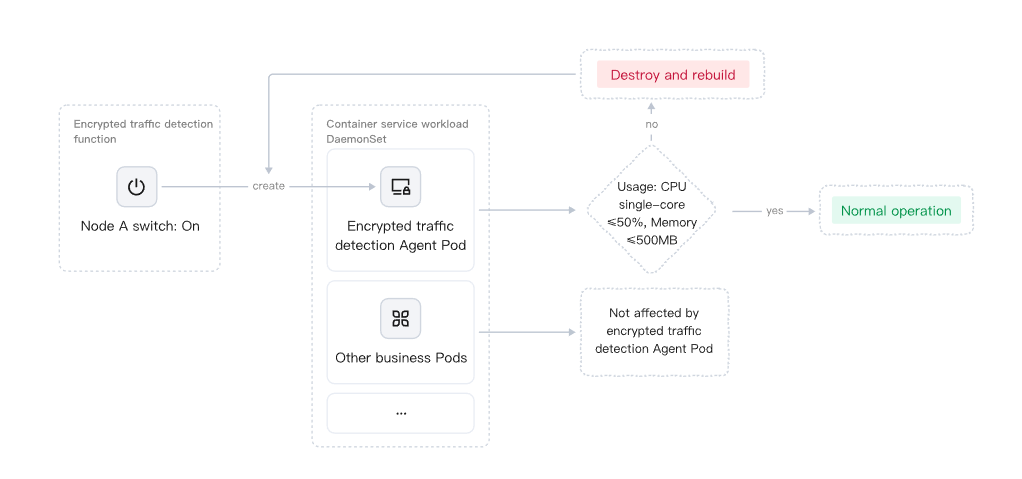
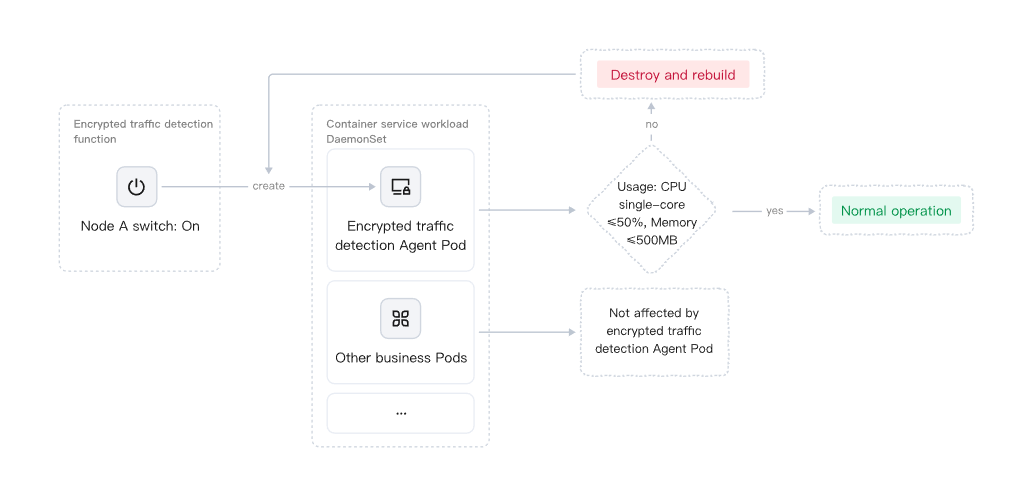
After you enable the container decryption feature, the system creates an Agent Pod for encrypted traffic detection in the Workload > DaemonSet of the corresponding TKE. Its resource usage limits are as follows:
Overall limit: A single Agent Pod can occupy up to 50% of a single-core CPU and 500 MB of memory.
CPU occupancy:
Each node with encrypted traffic detection enabled will independently create a corresponding Agent Pod. The functioning of this Pod will not affect the normal operation of other business Pods on the same node.
The TKE platform enforces mandatory limits on the CPU and memory usage of DaemonSet Pods. If a Pod's resource usage still exceeds the limit (for example, due to an anomaly breaking through the 50% CPU or 500 MB memory threshold), the platform automatically terminates that Pod and rebuilds a new instance. This process does not affect other business Pods on the same node.
Internet Boundary Traffic
Internet Border Traffic Scenario: The encrypted traffic detection Agent is still deployed on the underlying CVM, and its resource occupancy is consistent with that of CVM encrypted traffic detection. For GAAP assets, resource occupancy is based on the performance metrics of the acceleration instance. For NAT Gateway, encrypted traffic detection is offloaded to the CVM attached to it, and resource occupancy is calculated independently per CVM.
Enable Detection of Encrypted Traffic
Note:
You must enable the NDR switch before you can enable encrypted traffic detection. When the NDR switch is not enabled, hovering the mouse over the encrypted traffic detection switch will display the message: "Enable NDR collection first, then enable encrypted traffic detection." For details on enabling the NDR switch, see Traffic Access.
If the same CVM asset is managed by multiple tabs such as CVM and Internet Border Traffic, encrypted traffic detection operates independently under each tab, with separate billing and data collection. Please select the appropriate tab based on your business needs.
Pre-checks
Before enabling encrypted traffic detection, the system automatically fetches and validates prerequisites such as account, region, instance, network, quota, bandwidth, Agent, container permissions, and Border Firewall connection status. Based on the validation results, it categorizes assets into the following three states:
Can be enabled: All checks have passed, and encrypted traffic detection can be enabled normally.
Can be enabled - at risk: There are certain risks (such as insufficient bandwidth margin), but it can still be enabled. The system will display risk prompt information.
Cannot be enabled: There are blocking issues (such as unsupported region, incompatible operating system, insufficient quota, or not connected to the corresponding Border Firewall). You must resolve all issues according to the guidance before you can enable it.
The system performs checks from the following dimensions. If the pre-check fails, the encrypted traffic switch status of the asset will be displayed as Cannot be enable or Can be enabled - at risk. For details on specific exceptions and solutions, see Asset Status Description.
Check Dimension | Check Method | Check Content |
Region and Product Availability | Pre-check | Whether the region supports the traffic analysis service. |
Resource Existence and Basic Information | Pre-check / Triggered check | Valid subnet ID of the instance, and no conflicting image binding on the instance. |
Instance and OS Compatibility | Pre-check | Whether the instance type supports mirroring mode, and whether the operating system is on the supported list. |
Network and Bandwidth Health | Triggered check | Real-time bandwidth of the instance and the threshold; purchased bandwidth limit of the account. |
Quotas and Resource Limits | Pre-check | Upper limit on the number of enabled instances. |
Container Scenarios and Permissions | Pre-check | Access permissions for the container cluster KubeConfig; DaemonSet status and Pod health. |
Account and Allowlist | Pre-check | Whether the VPC traffic mirroring allowlist has been enabled. |
Instance TAT / Agent Status | Pre-check | Whether TAT has been installed. |
Border Firewall Access Status | Pre-check / Triggered check | Whether the EIP associated with the asset has enabled the internet boundary serial firewall in the internet boundary scenario. |
Note:
Pre-check: The system automatically checks every 5 minutes whether the assets meet the enabling conditions.
Triggered Check: The system triggers verification when a user selects an asset and enables the NDR toggle or the encrypted traffic detection toggle. After the verification is complete, the system synchronously updates the pre-check status.
CVM Asset
On the Network Detection and Response > Traffic Access > CVM page, select the corresponding operation based on the access granularity:
Individual Switch: In the operation column of the target asset's row, click Enable Encrypted Traffic to enable the encrypted traffic detection feature. Click it again to stop the encrypted traffic detection feature.
All Switches: Click More actions at the top of the page and select Detect all encrypted traffic or Do not detect any encrypted traffic to enable or disable the encrypted traffic detection switch for all CVM assets.
Note:
When all are enabled, the system performs a pre-check on each asset. Assets whose pre-check status is "Cannot be enabled" are skipped, and the system prompts the reason for skipping.
Batch Switch: If you only need to operate on some assets:
1.1 Select the CVM assets that require configuration. (Only assets with a status of Can be enabled or Can be enabled - at risk can be selected).
1.2 Click More actions and select Detect selected encrypted traffic or Do not detect selected encrypted traffic.
If you need to automatically enable encrypted traffic detection for new assets, see Traffic Access for details.
Container Cluster Assets
On the Network Detection and Response > Traffic Access> Container Cluster page, select the corresponding operation based on the access granularity:
Individual Switch: In the operation column of the target node's row, click Enable Encrypted Traffic to enable the encrypted traffic detection feature. Click it again to stop the encrypted traffic detection feature.
All Switches: Click More actions at the top of the page and select Detect all encrypted traffic or Do not detect any encrypted traffic to enable or disable the encrypted traffic detection switch for all container cluster assets.
Note:
When all are enabled, the system performs a pre-check on each asset. Assets whose pre-check status is "Cannot be enabled" are skipped, and the system prompts the reason for skipping.
Batch Switch: If you only need to operate on some assets:
1.1 Select the required target cluster or node.
1.2 Click More actions and select Detect selected encrypted traffic or Do not detect selected encrypted traffic.
If you need to automatically enable encrypted traffic detection for new assets, see Traffic Access for details.
Internet Boundary Traffic Assets
On the Network Detection and Response > Traffic Access > Internet Boundary Traffic page, select the corresponding operation based on the access granularity:
Note:
Assets accessed through the Internet Firewall serial mode are displayed by EIP. For GAAP/CVM, you can directly toggle the switch in the row. For NAT Gateway, you need to expand the secondary menu to manage it at the CVM granularity. CLB does not currently support encrypted traffic detection.
For Internet Border Traffic assets, you must first enable the Internet Border Serial Firewall for the corresponding EIP in the CFW console. If it is not enabled, the encrypted traffic detection switch will be unavailable. Hover the mouse over it and click Enable to jump to the configuration.
Individual Switch: In the operation column of the target asset's row, click Enable Encrypted Traffic to enable the encrypted traffic detection feature. Click it again to stop the encrypted traffic detection feature.
All Switches: Click More actions at the top of the page and select Detect all encrypted traffic or Do not detect any encrypted traffic to enable or disable the encrypted traffic detection switch for all internet boundary traffic assets.
Note:
When all are enabled, the system performs a pre-check on each asset. Assets whose pre-check status is "Cannot be enabled" are skipped, and the system prompts the reason for skipping.
Batch Switch: If you only need to operate on some assets:
1.1 Select the target assets.
1.2 Click More actions and select Detect selected encrypted traffic or Do not detect selected encrypted traffic.
Asset Status Description
On the asset list of each tab, the system displays the real-time operational status of assets in the Encrypted Traffic Detection Status column:
Status Column | Possible Values | Description |
Encrypted Traffic Detection Status | Enabled, Disabled, Automatically disabled, Disabling, Enabling, Enable failed, Enableable - with risk, Not enableable, Endpoint Agent loading abnormal, Endpoint Agent abnormal | Displays the enabled status and abnormal conditions of encrypted traffic detection. |
When the status is abnormal (for example, enabling fails, cannot be enabled, or the terminal Agent is abnormal), the page displays a red warning icon and exception information, indicating that the current detection is unavailable. Hover over the status to view the specific cause and operation instructions. The exception information and instructions include:
Failure Reason Categories | Solution |
The instance does not have the Terminal Automation Tool (TAT) installed. | The instance does not have Endpoint TAT installed. Please see TAT Deployment Guide and retry after completing the installation. |
Automatic NDR-Agent installation not supported on the current instance. | The TAT channel and host channel of the current instance are unavailable, preventing automatic installation of NDR-Agent. Confirm that the instance has TAT Agent or CWPP Agent installed and enabled, then retry. If installation still fails, submit a ticket to contact technical support. |
The current operating system type is not supported. | The current operating system is not supported. Please visit the NDR-Technical Solution to confirm compatibility. |
The server is temporarily unavailable. Please try again later. | Temporary unavailability of the server has been detected. Please wait 5 minutes and try again. If the issue persists, please submit a ticket to contact technical support. |
Permission exception when container cluster access is obtained | An exception occurred while obtaining container cluster permissions and creating the Agent DaemonSet Pod. Please submit a ticket to apply. |
Terminal Agent abnormal | 1. The Agent network may be abnormal. Please check whether security groups allow access. 2. Operation of the Agent process may be abnormal. Please verify the operating system status. 3. If no abnormalities are detected, submit a ticket to contact technical support. |
Terminal Agent loading exception | A loading exception occurred during the Agent deployment process. Please try again later. If the exception persists, please submit a ticket to contact technical support. |
Region not supported | The current region does not support the traffic analysis service. Please submit a ticket to apply for enabling the service or view the list of supported regions. |
Instance with conflicting traffic mirror binding. | The current instance already has a traffic mirroring binding. Go to Traffic Mirroring Console to unbind it and retry. |
Instance type not supported | The current instance model does not support mirroring mode. See the list of supported models or submit a ticket to request adaptation. |
Number of enabled instances exceeds the limit. | |
VPC traffic mirroring allowlist not enabled. | The current account has not been added to the allowlist for VPC traffic mirroring. Please submit a ticket to apply for enabling the service. Provide the VPCID and region information. |
Status Monitoring
The Status Monitoring module provides a dedicated statistics panel for encrypted traffic, helping you gain real-time visibility into the operational status and overall scale of current encrypted traffic detection. Core monitoring metrics include:
scanned encrypted traffic: Total volume of encrypted traffic that has been detected.
Encrypted detection asset instance: The number of asset instances for which encrypted traffic detection is currently enabled, covering all assets in CVM, container node, and internet boundary traffic scenarios.
Number of exception alerts/Number of file detections: The number of exception alarms and detected files, with support for switching among the 24 hours, 7 days, and 30 days time ranges.
Encrypted traffic trend chart: Displays the dynamic change trend of encrypted traffic analysis volume, with support for switching between 24 hours, 7 days, and 30 days time ranges.
Encrypted Protocol Traffic Log
On the Log Auditing > Network Detection and Response Logs > Traffic Analysis Logs or Traffic Alarm Logs page, for traffic logs of encrypted protocols such as HTTPS, SMTPS, and FTPS, the system first restores the plaintext content (such as request headers, response bodies, and other fields) and marks it with Decryption Detection. You can also quickly filter and view all logs related to encrypted traffic detection by selecting the Show Only Decryption Detection option.
Ajuda e Suporte
Esta página foi útil?
Você também pode entrar em contato com a Equipe de vendas ou Enviar um tíquete em caso de ajuda.
comentários