Cloud Log Service (Cloud Log Service, CLS) connects with Grafana, supporting log topic and metric topic data display through Grafana and alarm policy configuration. This document uses the CentOS operating system as an example to guide you in Grafana installation and configurations.
Overview of unused way to use CLS without logging in to Tencent Cloud account
Usage
Supported Features
Whether Log in Without a Tencent Cloud Account Is Supported
To view log topic data, Grafana requires version 8.0 and above. If needed, see Grafana upgrade guide for edition upgrade. No such limitation applies to metric topic data.
Operation Steps
Step 1: Install CLS Plugin to Grafana (Optional)
Note:
To view log topic data in Grafana, install this plugin. No need to install the plugin when viewing metric topic data only, so you can skip this step.
Server Environment
Container Environment
Tencent Cloud Observability Platform Grafana Service
1. Confirm the plugin directory location of Grafana. Install plugin in the plugin directory /var/lib/Grafana/plugins/ of Centos.
Metric topics are compatible with the Prometheus data model and API, and can directly serve as a Prometheus data source in Grafana, equivalent to each metric topic being a Prometheus instance.
1. Obtain configuration information.
1.1 Log in to the CLS service console, click metric topic in the left sidebar.
1.2 In the metric topic management page, click the metric topic name to be added and enter the subject basic information page.
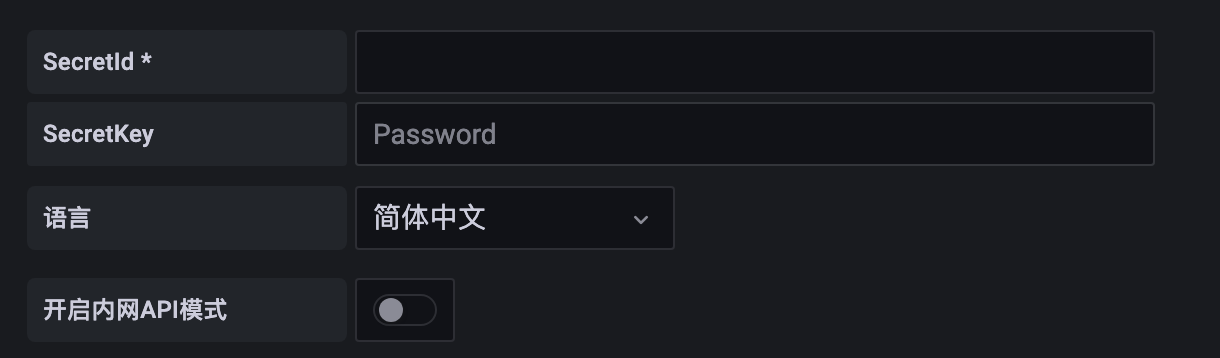
1.3 On the page, the access method > data query contains the URL and authentication method required for adding a data source in Grafana. The SecretId and SecretKey in the authentication method need to navigate to the CAM page to obtain. It is recommended to create a separate sub-account and use its SecretId and SecretKey. The permission policy can use the recommended permission policy configuration.
2. On the Data Sources page, click Add data source.
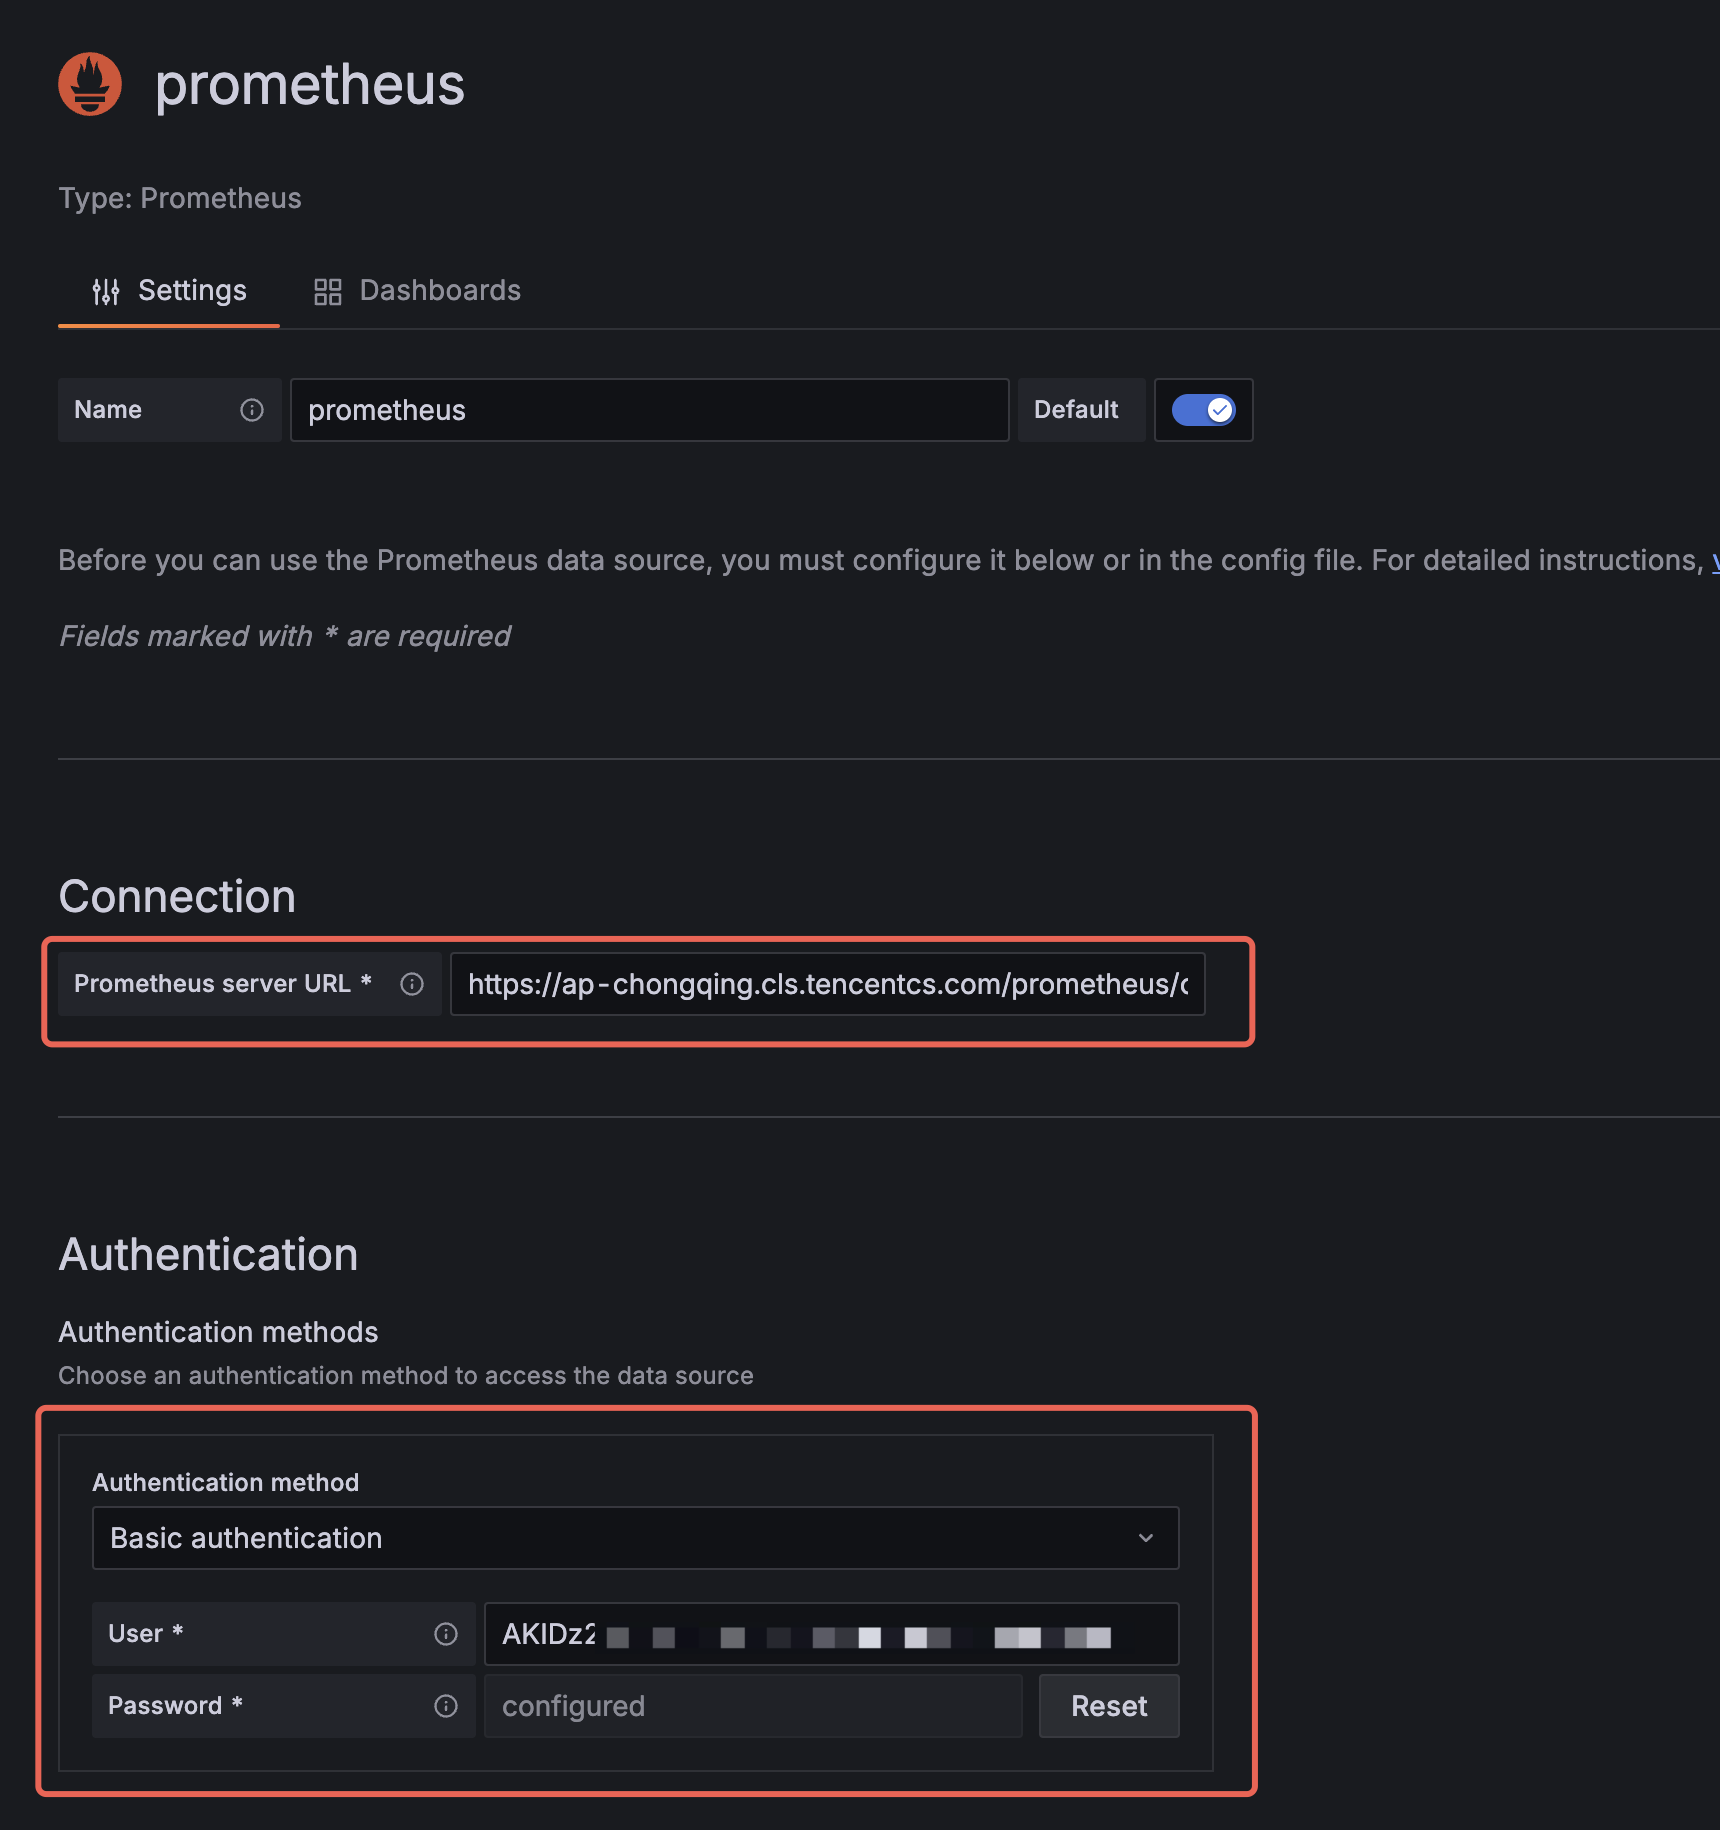
3. Select Prometheus, and configure the following information in the form:
Prometheus server URL: the URL obtained in step 1. When Grafana is deployed in Tencent Cloud Intranet (such as in CVM or TKE), use the intranet address. In other cases, use the public network address.
Authentication method: Basic Authentication. Use SecretId as the username and SecretKey as the Password.
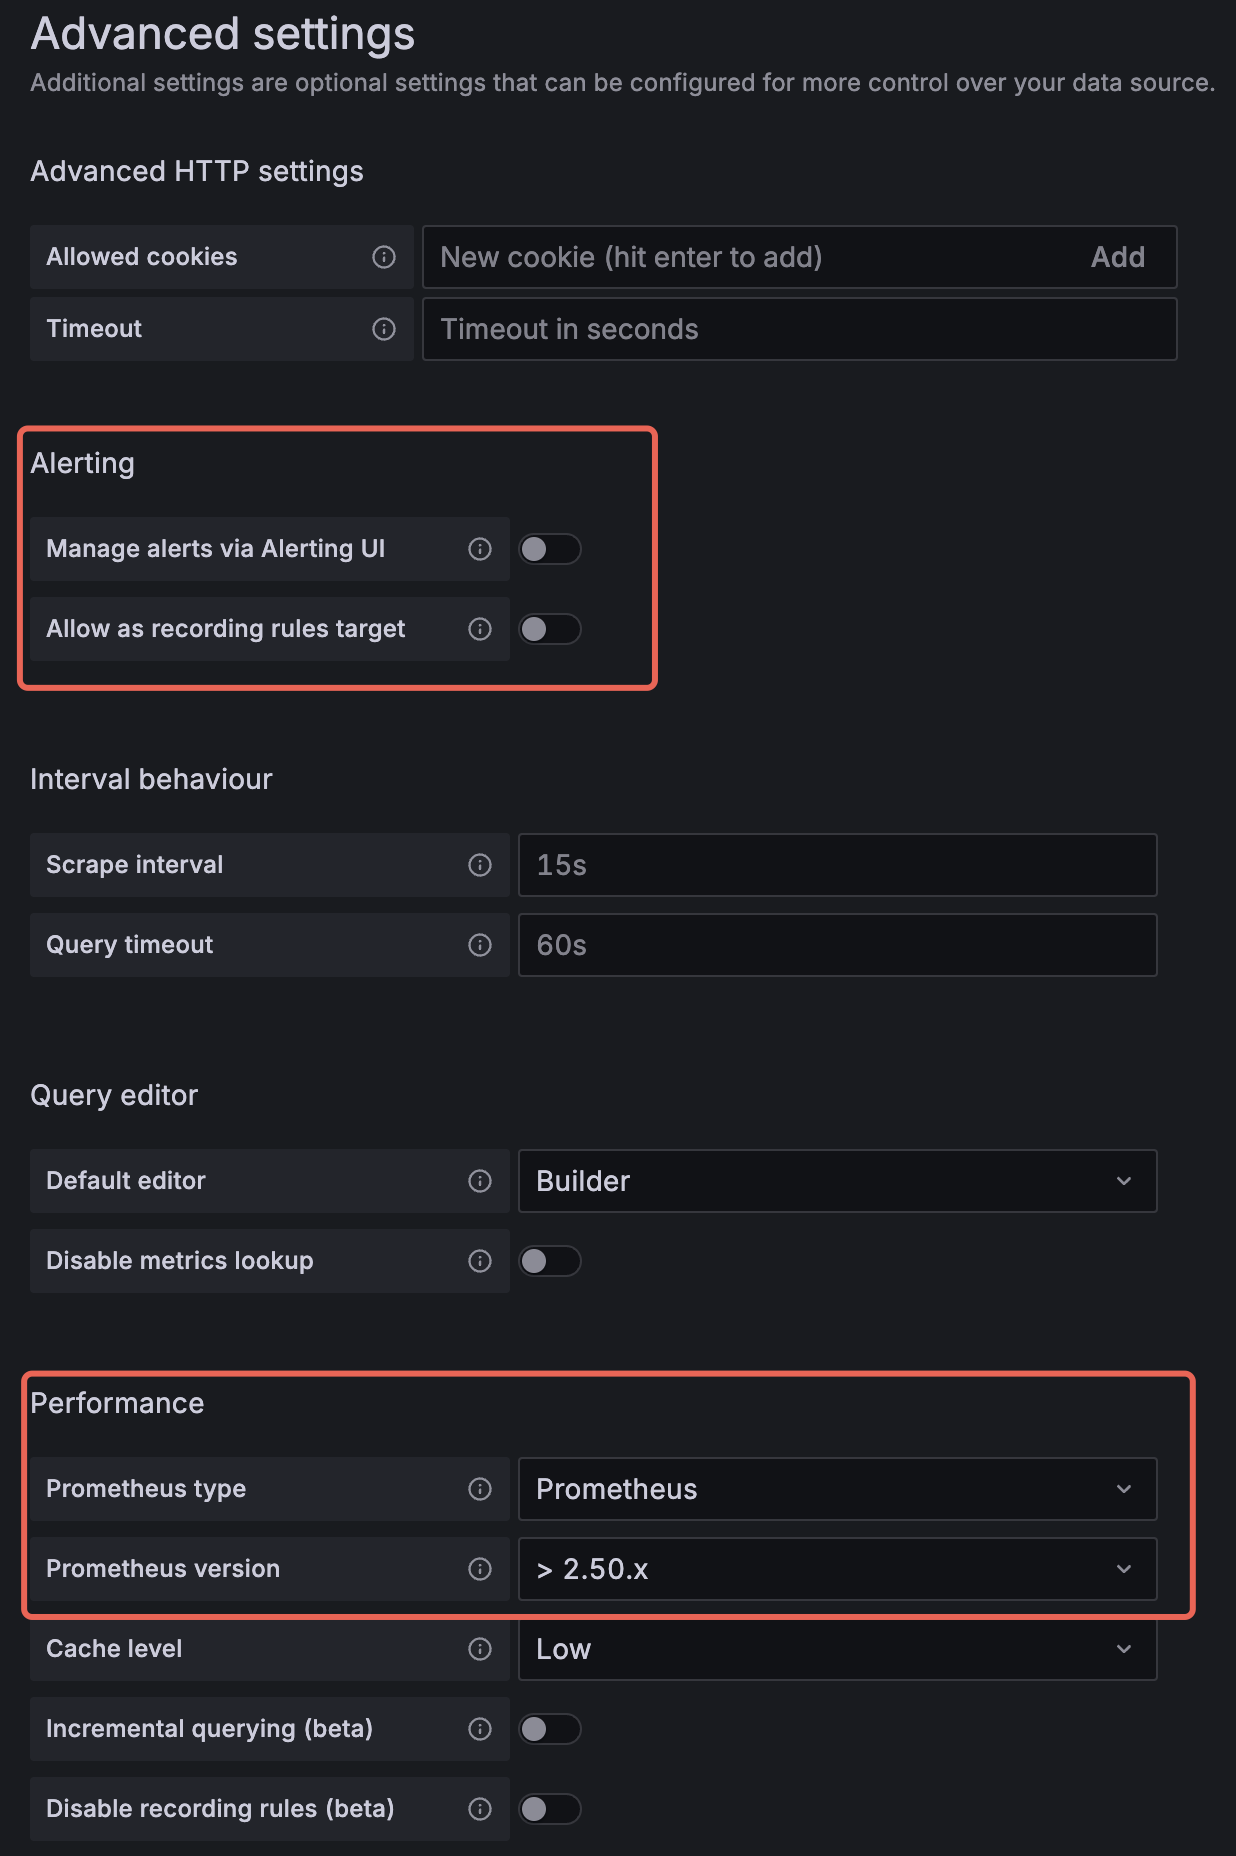
Alerting: Turn off the switches, including Manage alerts via Alerting UI and Allow as recording rules target (earlier versions of Grafana may not have this configuration item, can be ignored).
Prometheus type: Select Prometheus.
Prometheus version: > 2.50.x (Earlier versions of Grafana may not have this configuration item and can be ignored, but large data volumes may affect query performance. At this point, recommend upgrade to Grafana).
4. Click Save & Test at the bottom to test whether the configuration is correct and to save the settings.
Step 3: View Data on Grafana
Log Topic
Metric Topic
View raw logs in Grafana Explore
1. Enter Grafana-Explore, select Tencent CLS Datasource plug-in as the data source.
2. Select CLS as the plug-in type, choose the region and log topic name where the target log topic resides.
3. Enter the query statement, click Run query in the upper right corner to view the log retrieval results.
View raw logs in Grafana Dashboard
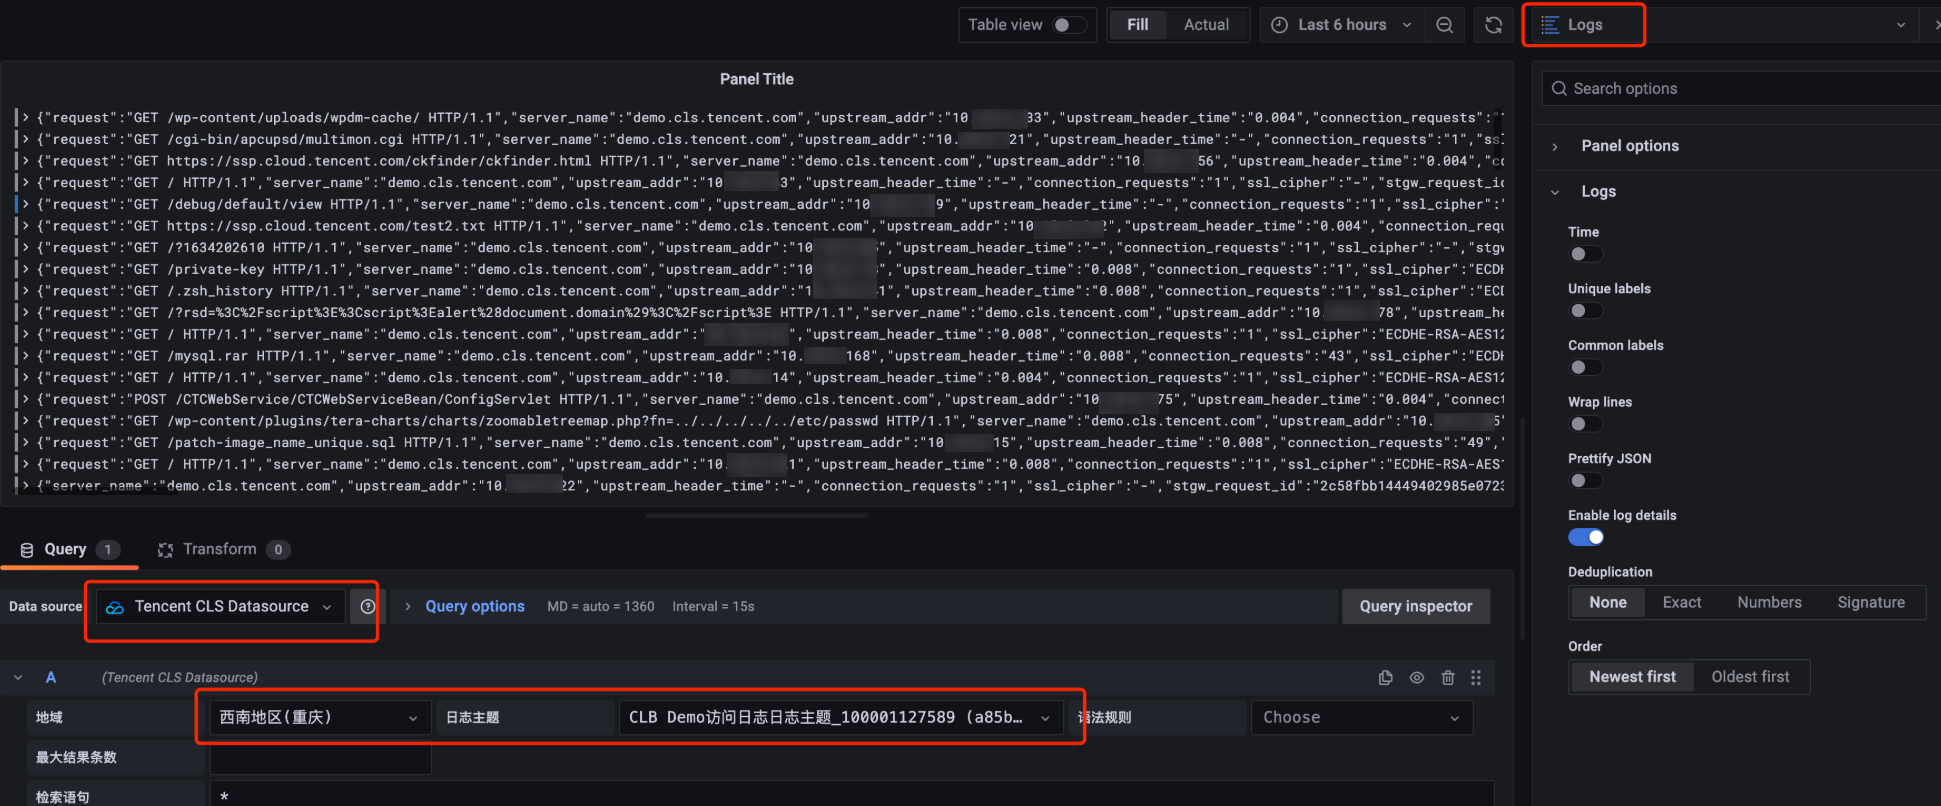
1. Enter Grafana-Dashboard, click add chart.
2. On the chart editing page, select Logs as the chart type. Choose Tencent CLS Datasource as the data source, then select the region and log topic name where the target log topic resides.
3. Enter the query statement, click the Refresh button in the upper right corner to view the log retrieval results.
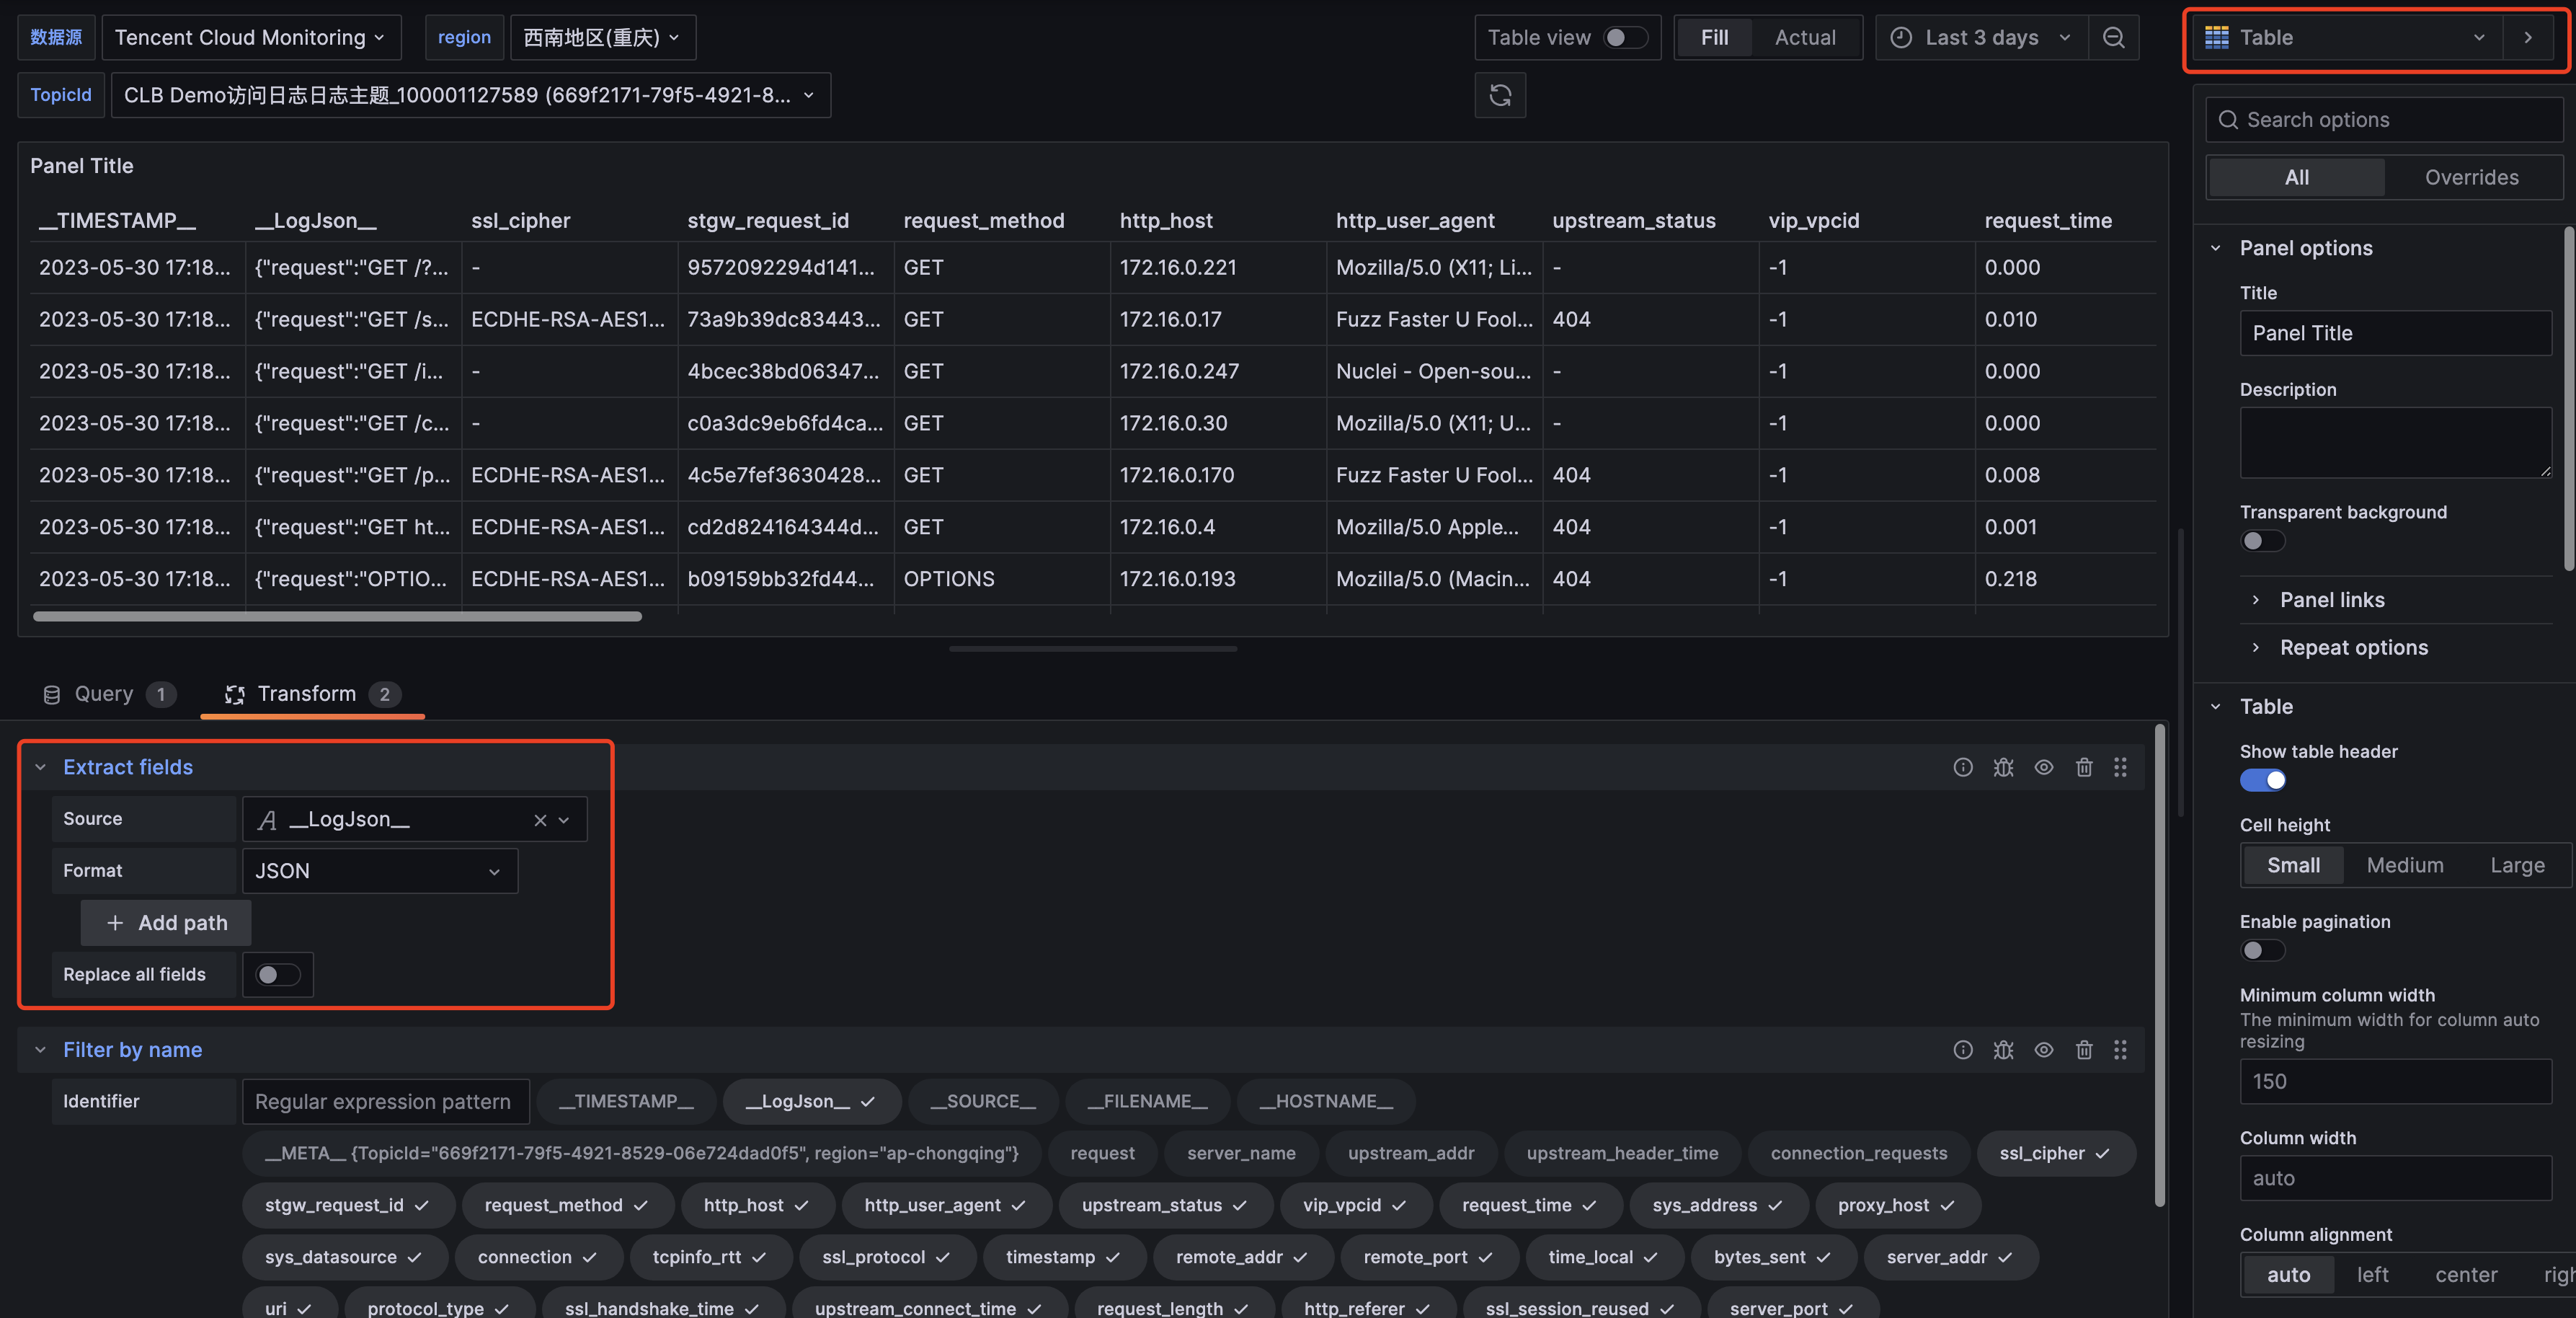
For Grafana v8.3 and later version users, you can also use the Extract fields feature in the Transform function to perform field extraction on the retrieved return content and view logs in the Table.
Configure statistical charts in Grafana
1. Enter Grafana-Dashboard, click add chart.
2. On the chart editing page, select the target chart type. Choose Tencent CLS Datasource as the data source, then select the region and log topic name of the target log topic.
3. Enter the SQL statement in the query statement, click Refresh in the upper right corner to view the statistical chart results.
Statement example for drawing a time sequence diagram
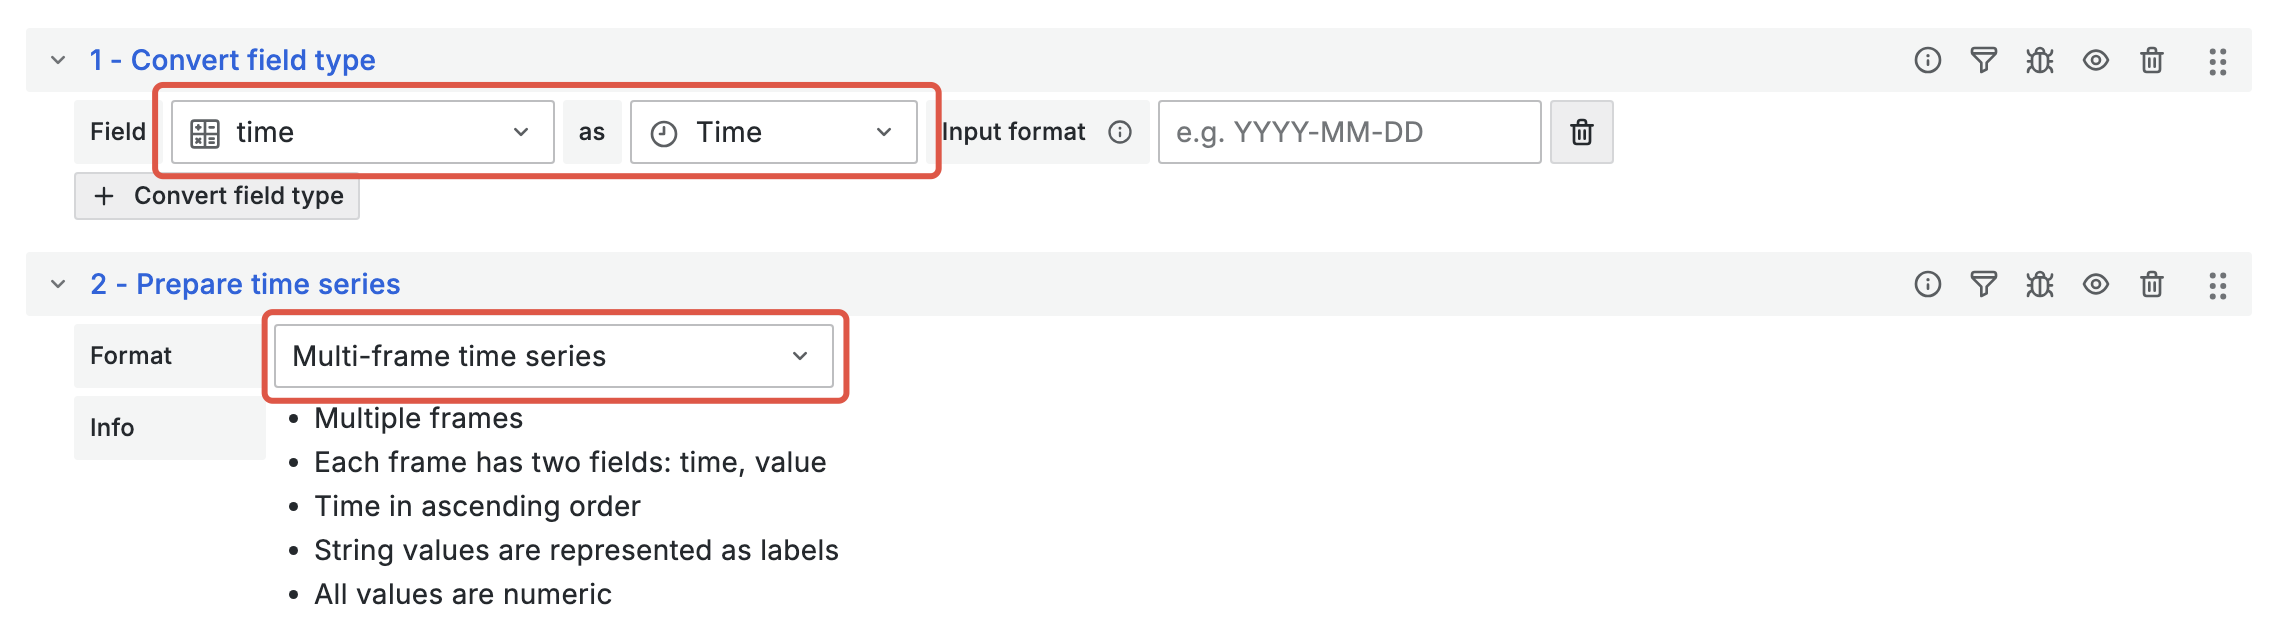
The PromQL statement needs to be used with the Transform feature to draw a time sequence diagram. Add Convert field type and Prepare time series configuration as follows:
Statement example for drawing a pie chart
Note the chart configuration item on the right Value Options - show and select All values:
*|select try_cast(statusasvarchar)asstatus,count(*)as log_count groupby statu
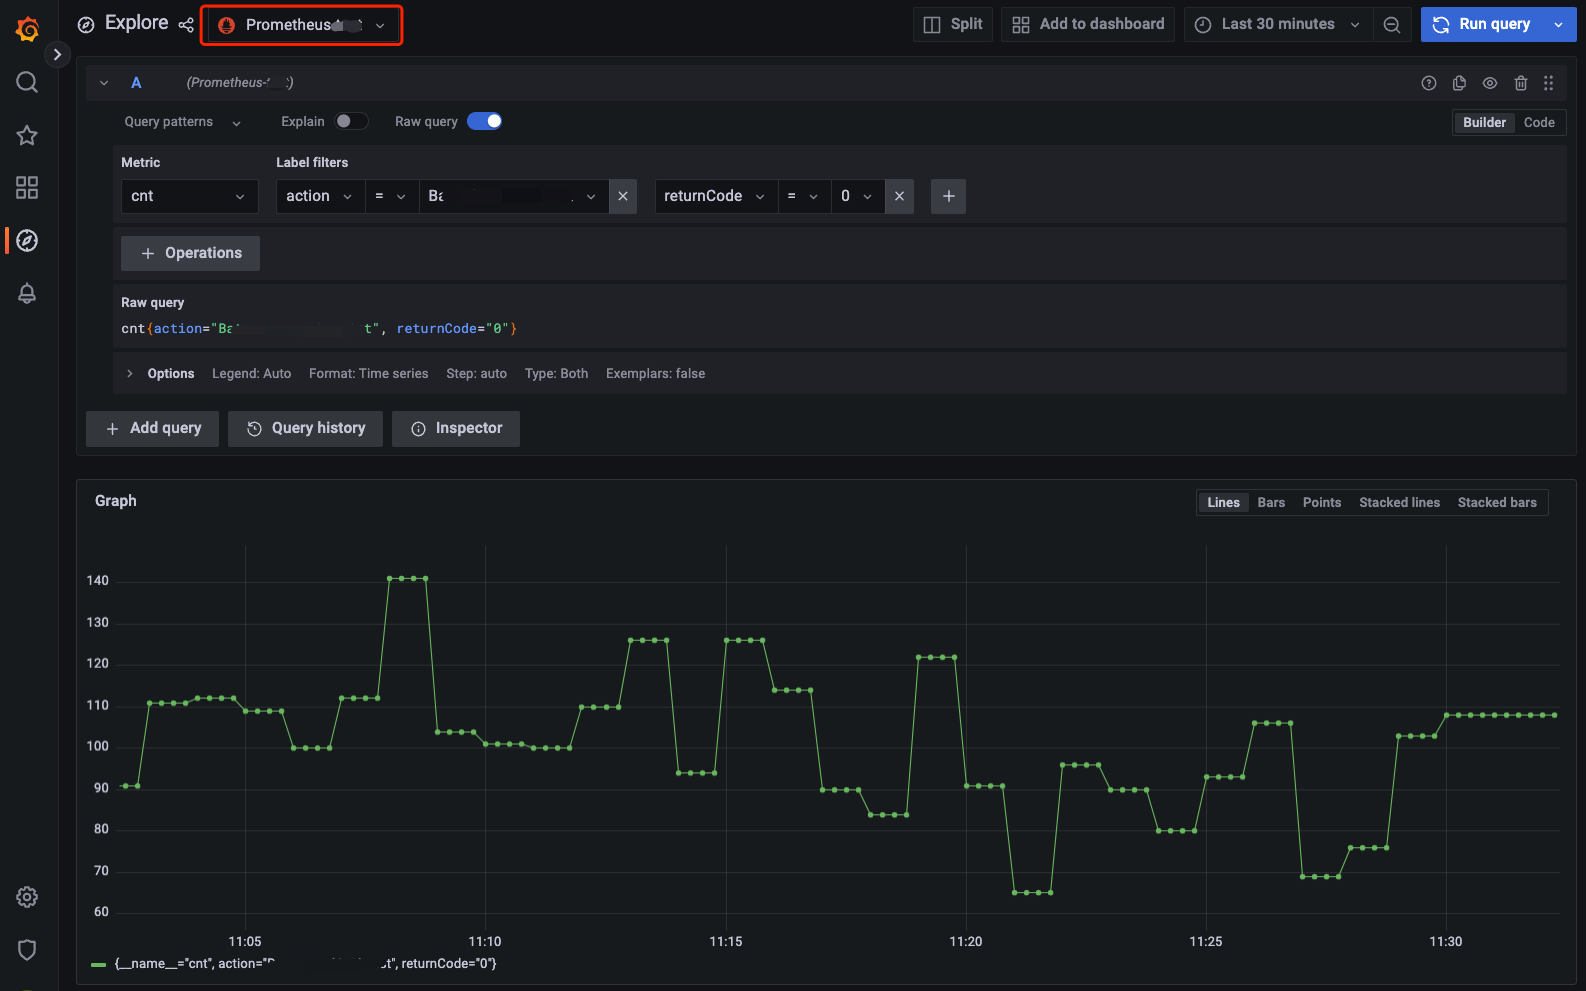
1. Enter Grafana-Explore, select the Prometheus data source added in procedure 2.
2. Enter the query statement, click Run query in the upper right corner to view the metric data.
Step 4: Configure Monitoring and Alerts on Grafana
Log Topic
Metric Topic
1. Enter Grafana-Alert rules, click create alarm rule.
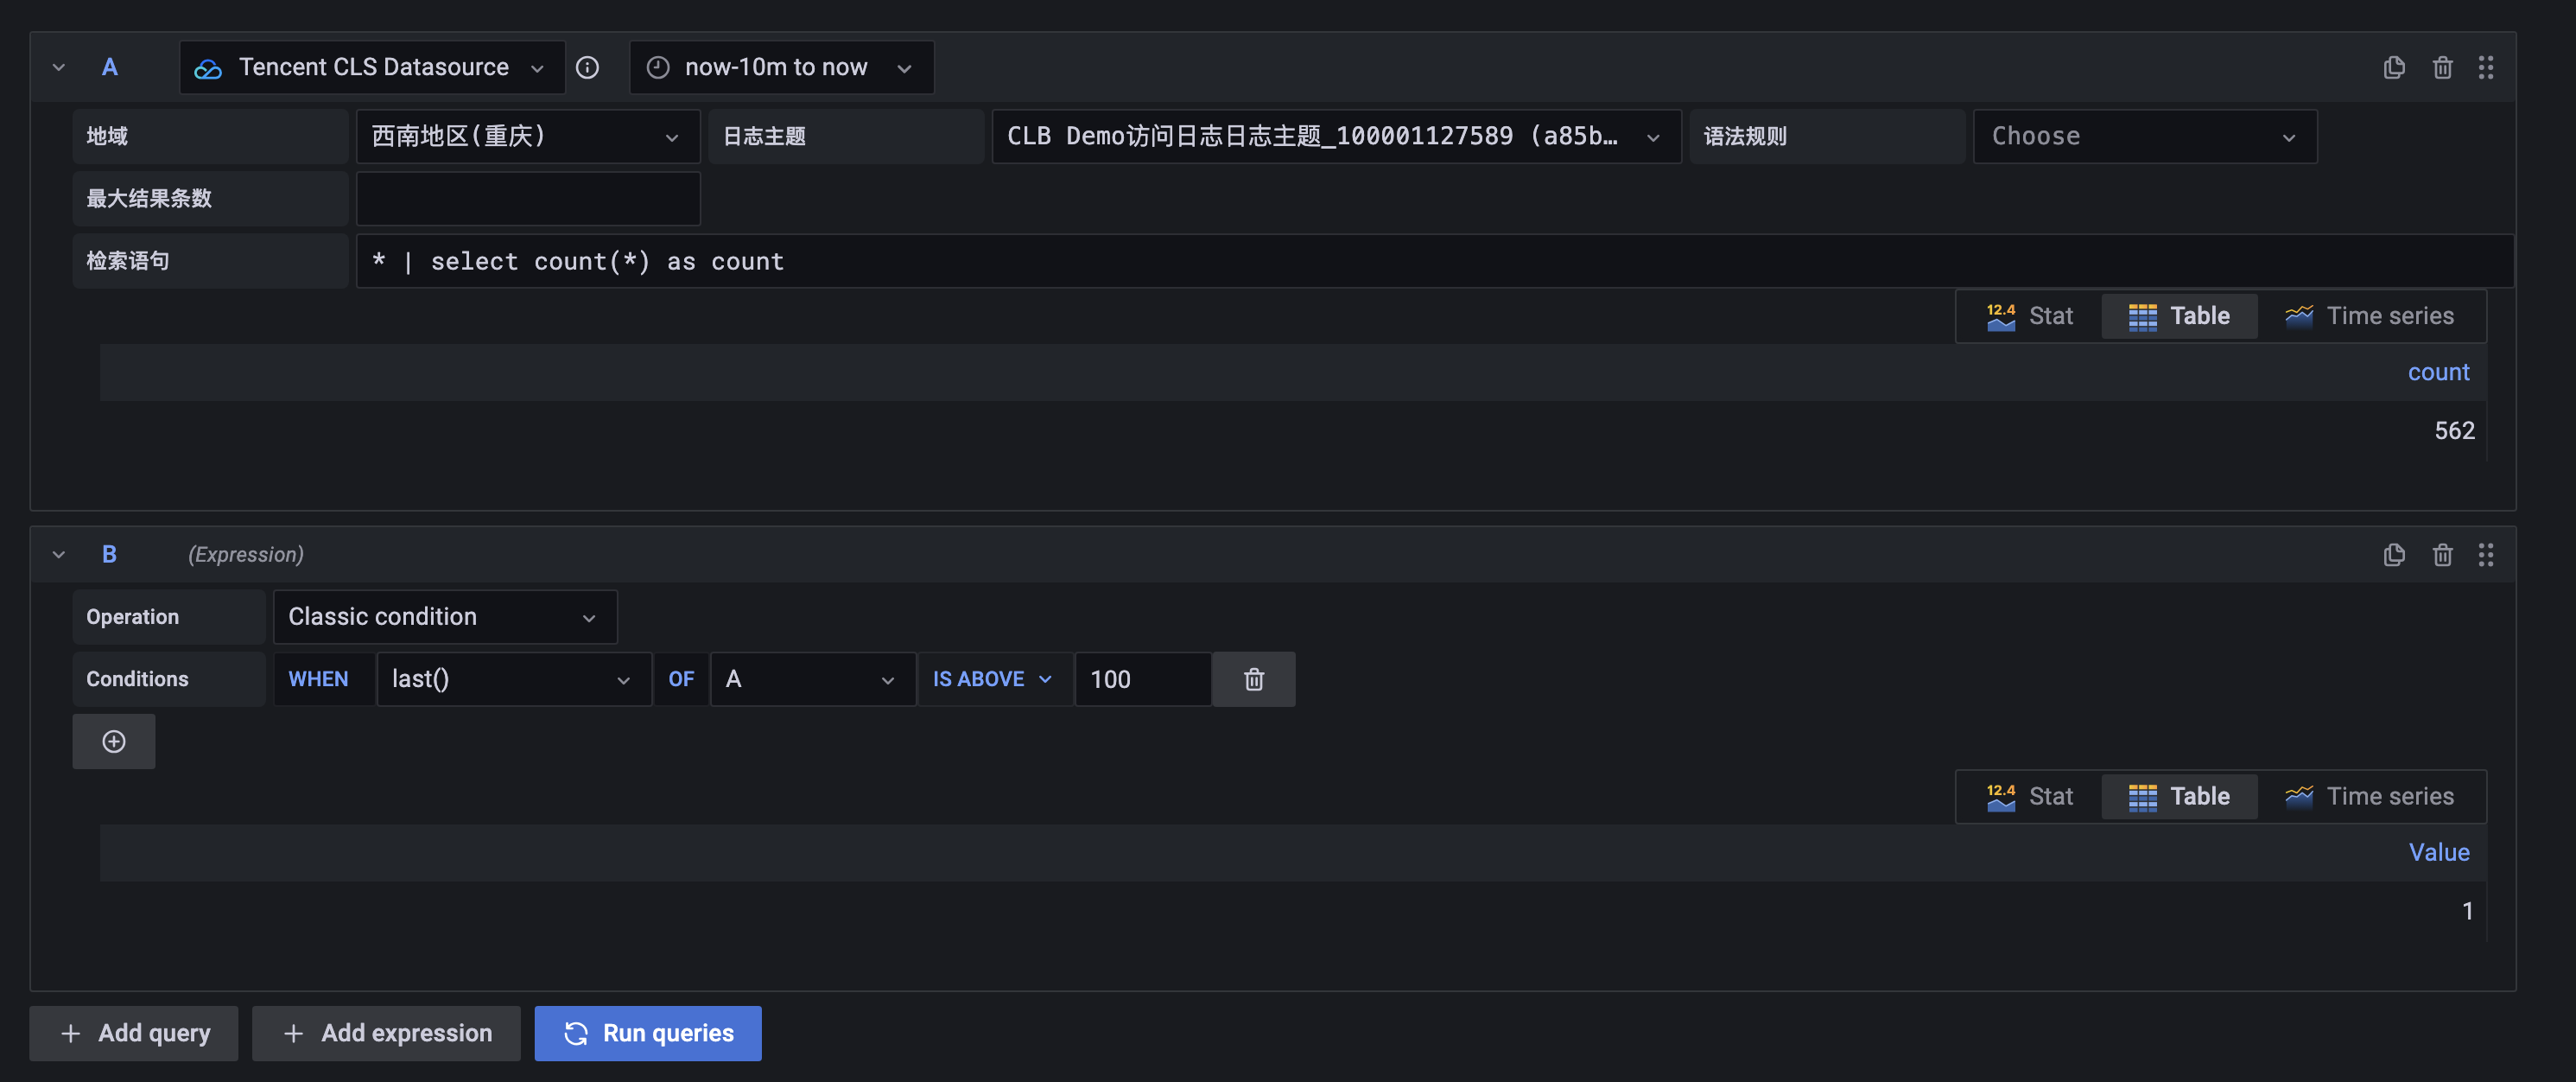
2. Enter the Alarm Rule Editing Page, select the Tencent CLS Datasource plug-in in A, and choose the statistical time range for monitoring alarms as needed.
3. In A, select the region and log topic name of the target log topic.
4. In A, input SQL statement in the query statement, and use the result as monitoring and alerting indicators.
5. In B, select the alarm metric value from A, taking the latest value in the example.
6. In C, configure the alarm trigger condition for the alarm metric value. For example, set it to trigger an alarm when the value exceeds 100.
7. Click Preview to preview the alert results. Fill in the alarm notification configuration and click Save.
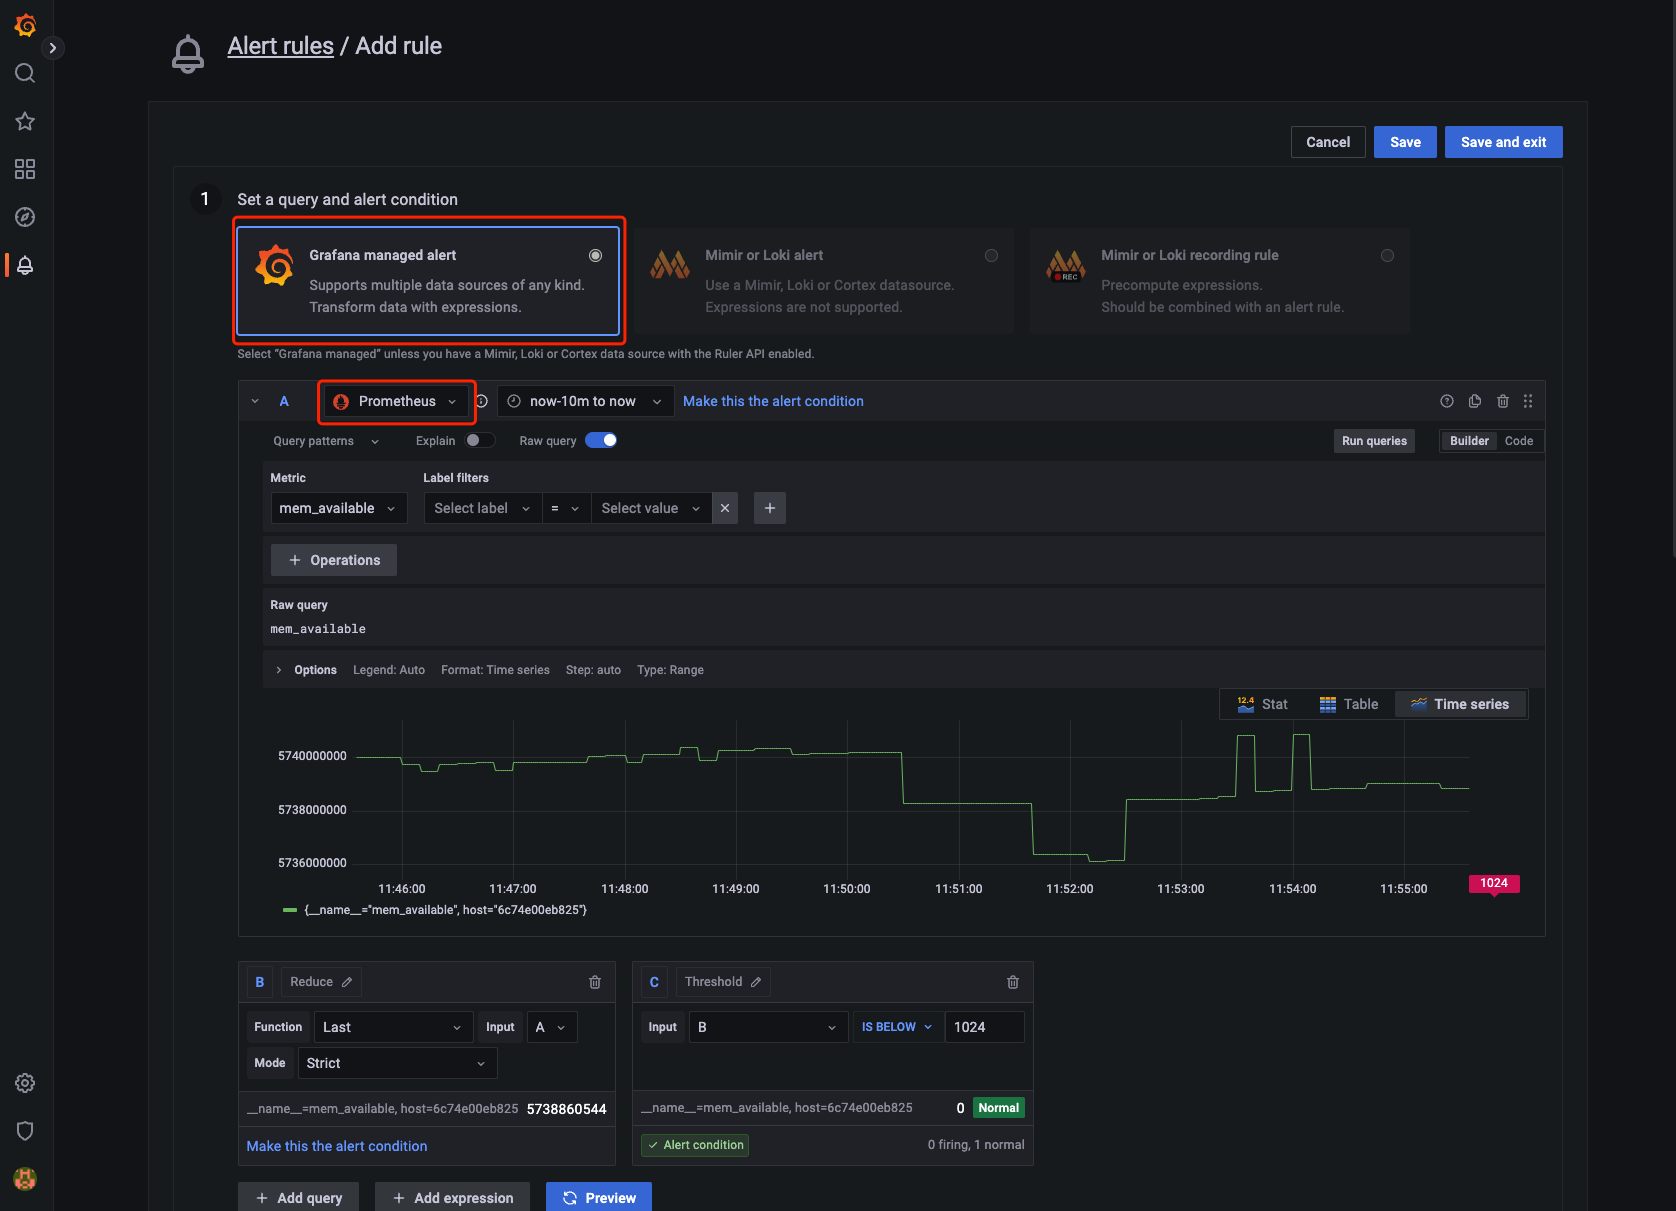
1. Enter Grafana-Alert rules, click create alarm rule. Since the metric topic is incompatible with Prometheus Alert relevant APIs, please use Grafana managed alert.
2. Enter the Alarm Rule Editing Page. In A, select the Prometheus data source added in procedure 2 for data source selection.
3. In A, fill in the metric query statement.
4. In B, select the alarm metric value from A, taking the latest value in the example.
5. In C, configure the alarm trigger condition for the metric value. For example, set it to trigger an alarm when the value is less than 1024.
6. Click Preview to preview the alert results. Fill in the alarm notification configuration and click Save.
Grafana Common Issues
How to Fix Timeout Error in Grafana Charts
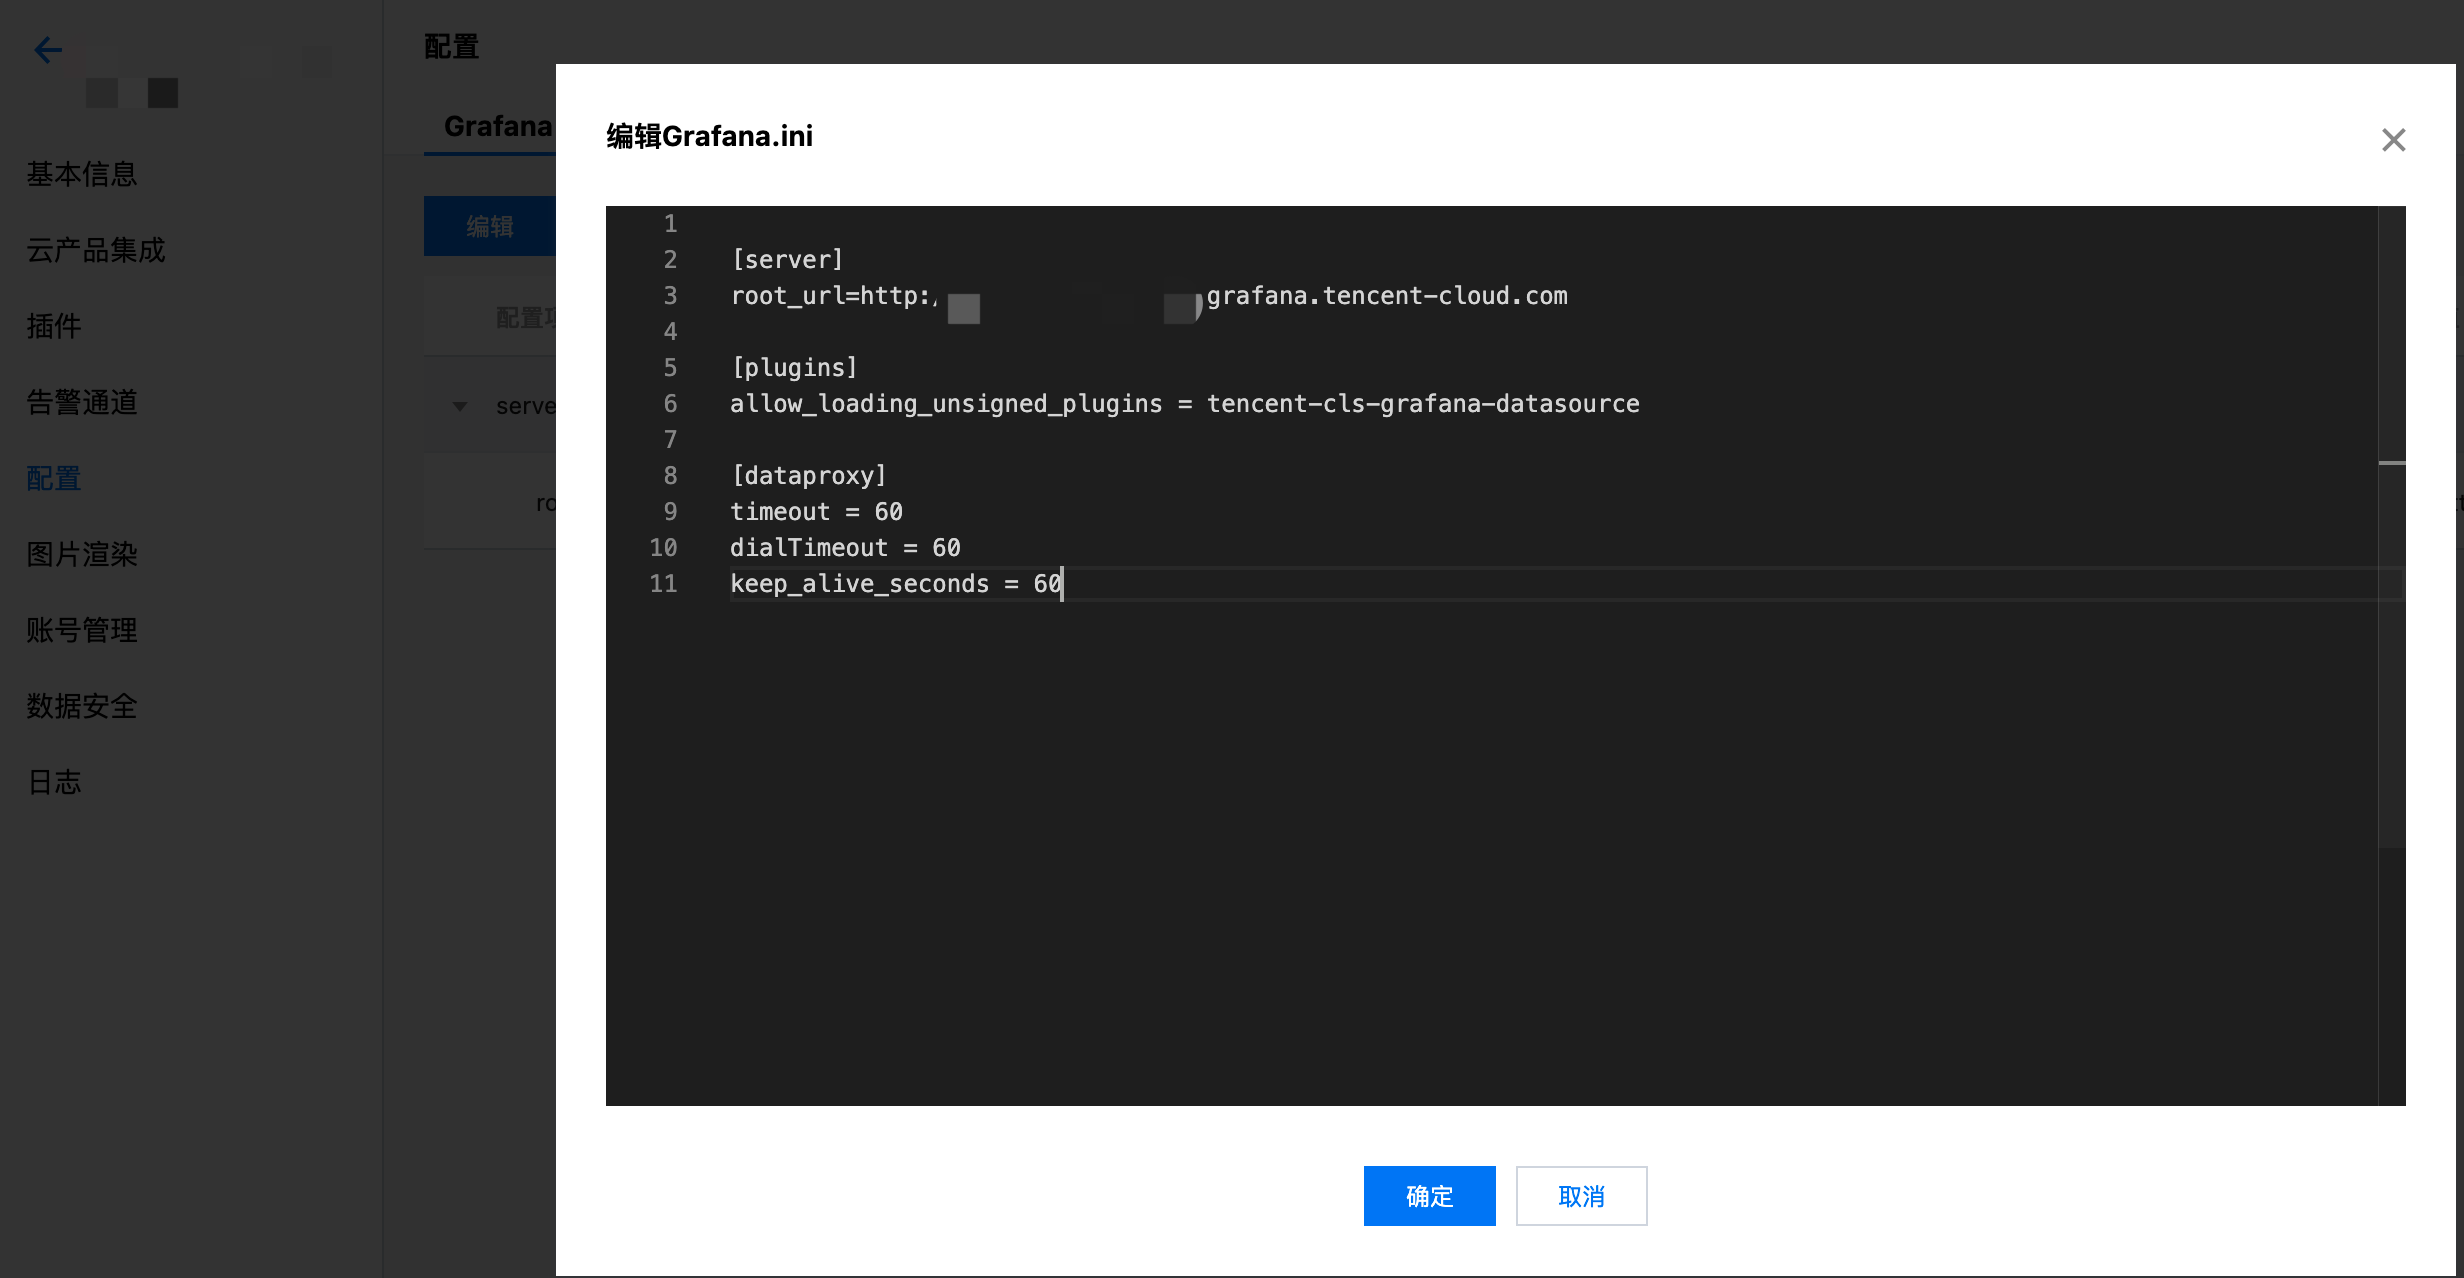
after installation, it is recommended to modify the [dataproxy] configuration in the grafana ini file. grafana's default timeout duration is 30s. During retrieval of large data volume, this may cause timeout issues. For details, see grafana proxy queries timeout after 30s with dataproxy. It is suggested to increase it to 60s to enhance the logging service ability. Modify the configuration as follows:
[dataproxy]
timeout = 60
dialTimeout = 60
keep_alive_seconds = 60
How to Install More Visual Charts in Grafana
To install more visual charts (such as pie charts, trend overview charts), execute the corresponding command to install the Grafana plugin.
For example, to install the pie panel, run the following command:
How to Configure Variables for Region and Log Topic in Grafana
Configure region and Log Topic variables in Grafana and refer to them in charts. You can replace the region and Log Topic in dashboard charts. The configuration process is as follows:
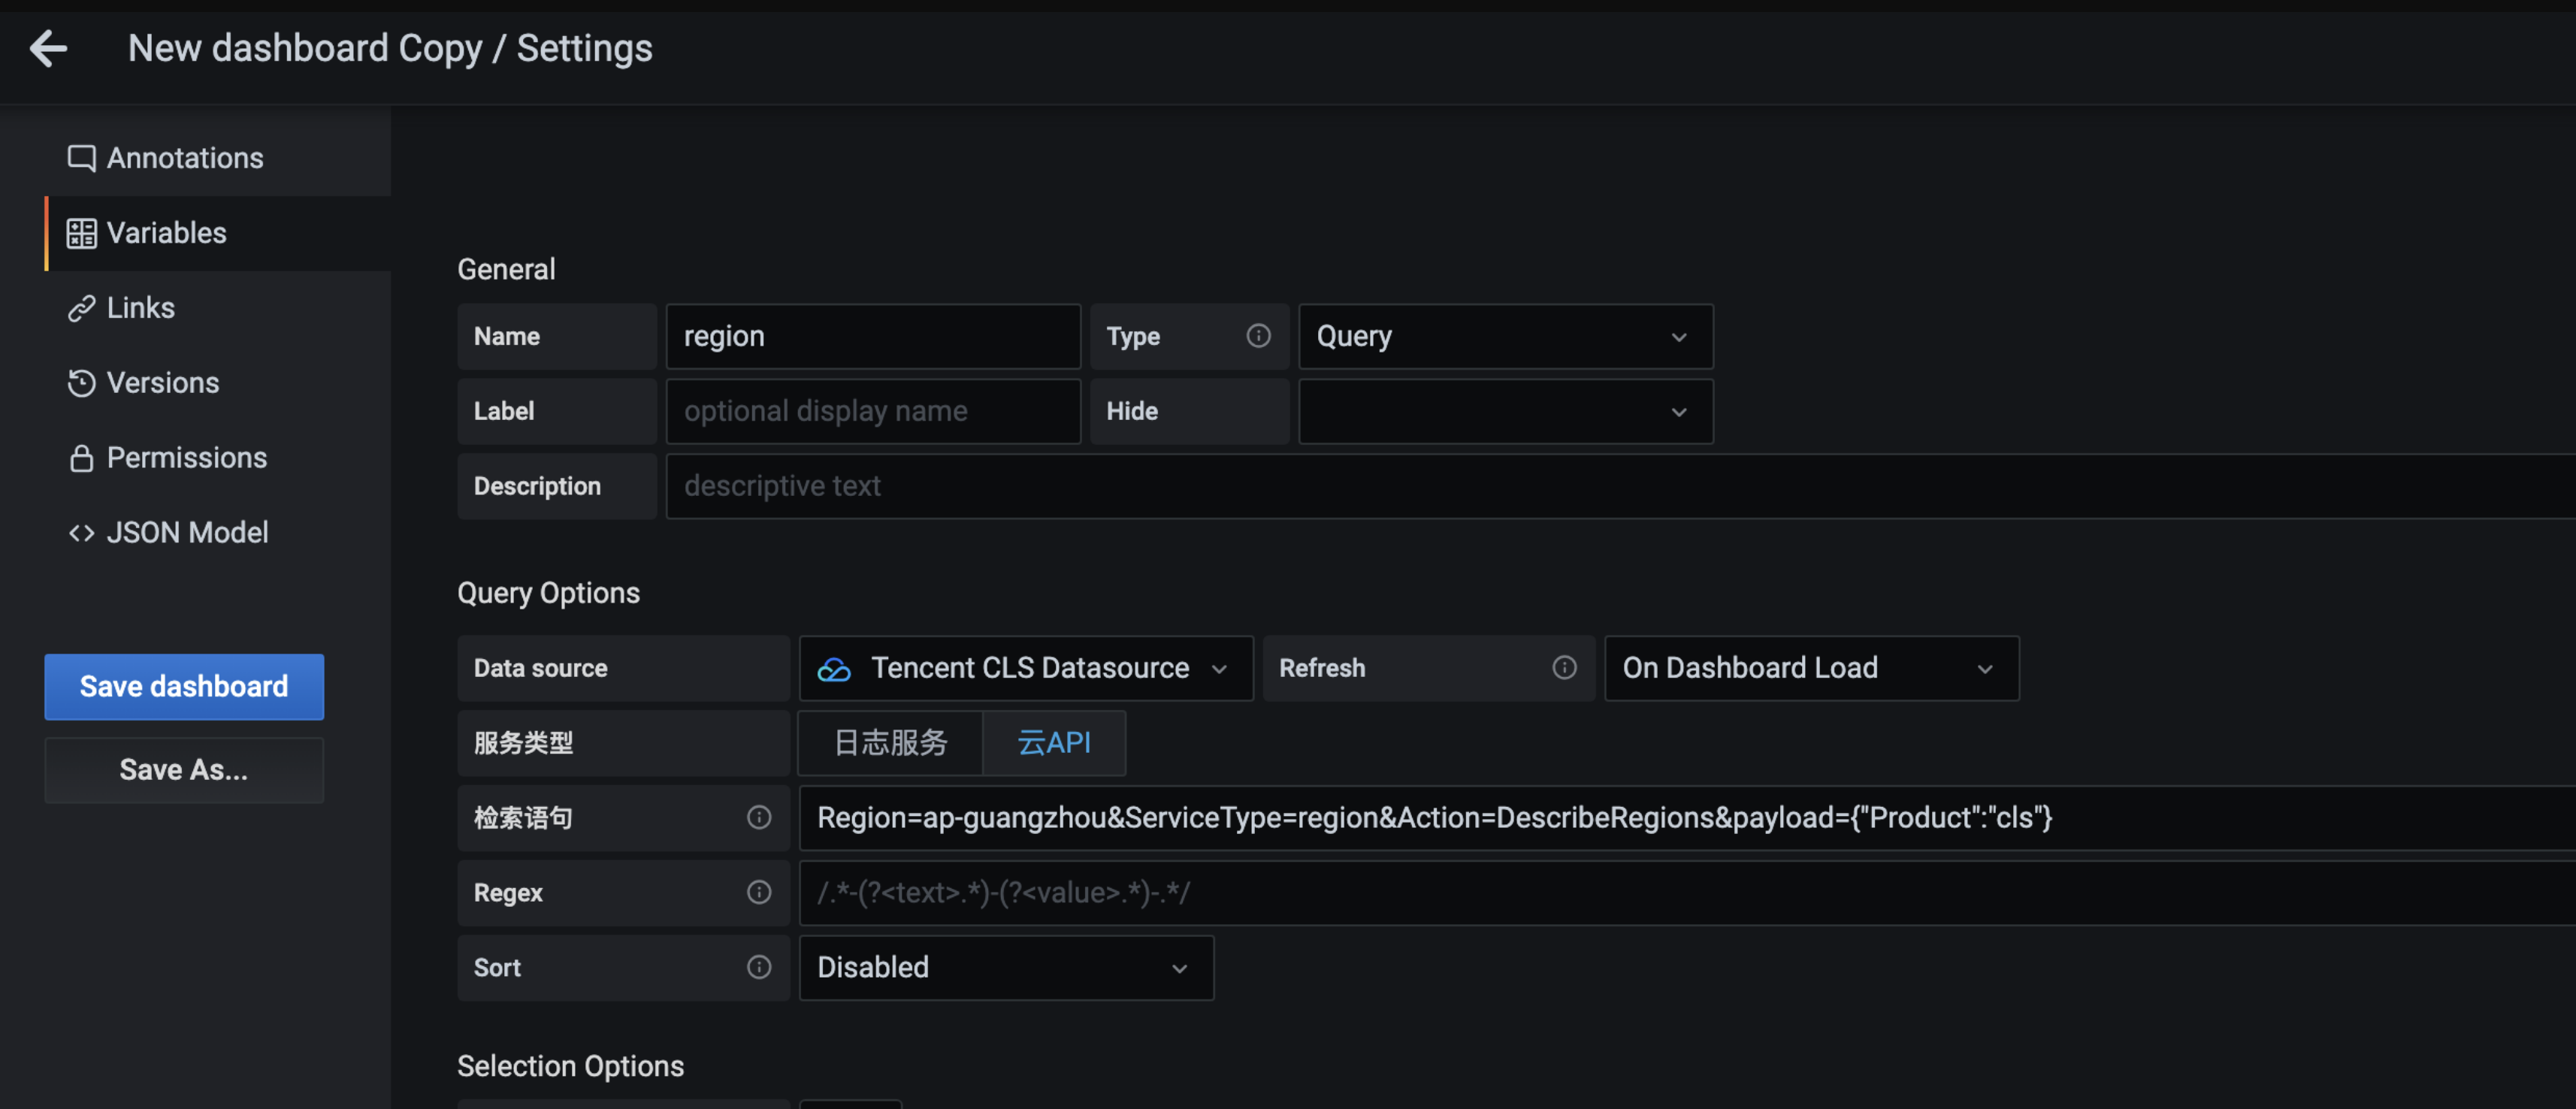
1. Enter the Grafana dashboard configuration-Variables menu, select create Variables. Configure the region variable first, then reconfigure the log topic variable.
2. Variables type select Query.
3. Query options, select the Tencent CLS Datasource plug-in in DataSource.
4. Query service type selection TencentCloud API, the query statement is as follows:
5. After the configuration is completed, click Save.
How to Use Variables to Filter Log Data in Grafana
Configure variables in Grafana and insert them into the chart query statement. By selecting different variable values, you can filter the chart data. Here is an example of configuring a user IP filter:
1. Enter the Grafana dashboard configuration-Variables menu, select create Variables.
2. Variables type select Query.
3. Query options, select the Tencent CLS Datasource plug-in in DataSource.
4. Query service type select CLS, the query statement is as follows (take remote_addr as an example, replace with target field in actual usage):
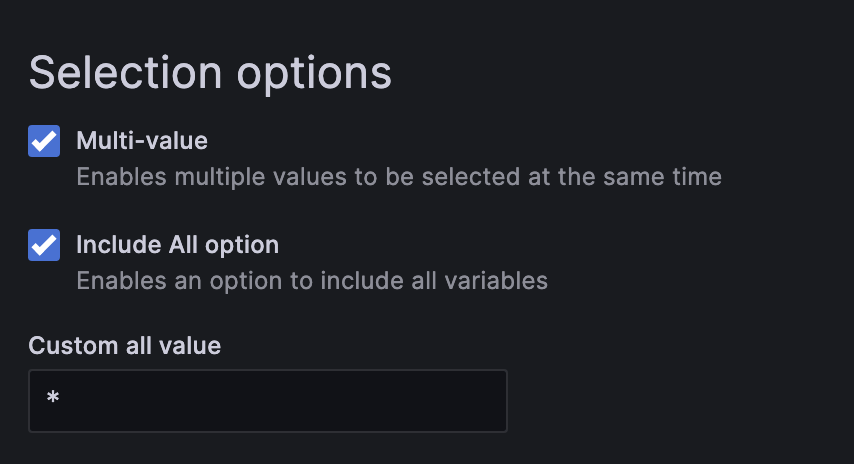
5. (Optional) Selection options check multiple selection and select all operations. The default value for select all is: *.
6. Insert variable ${IP:raw} in statements to complete configuration (Among them :raw is the suffix of the variable, specifying the variable format to avoid special characters being escaped).
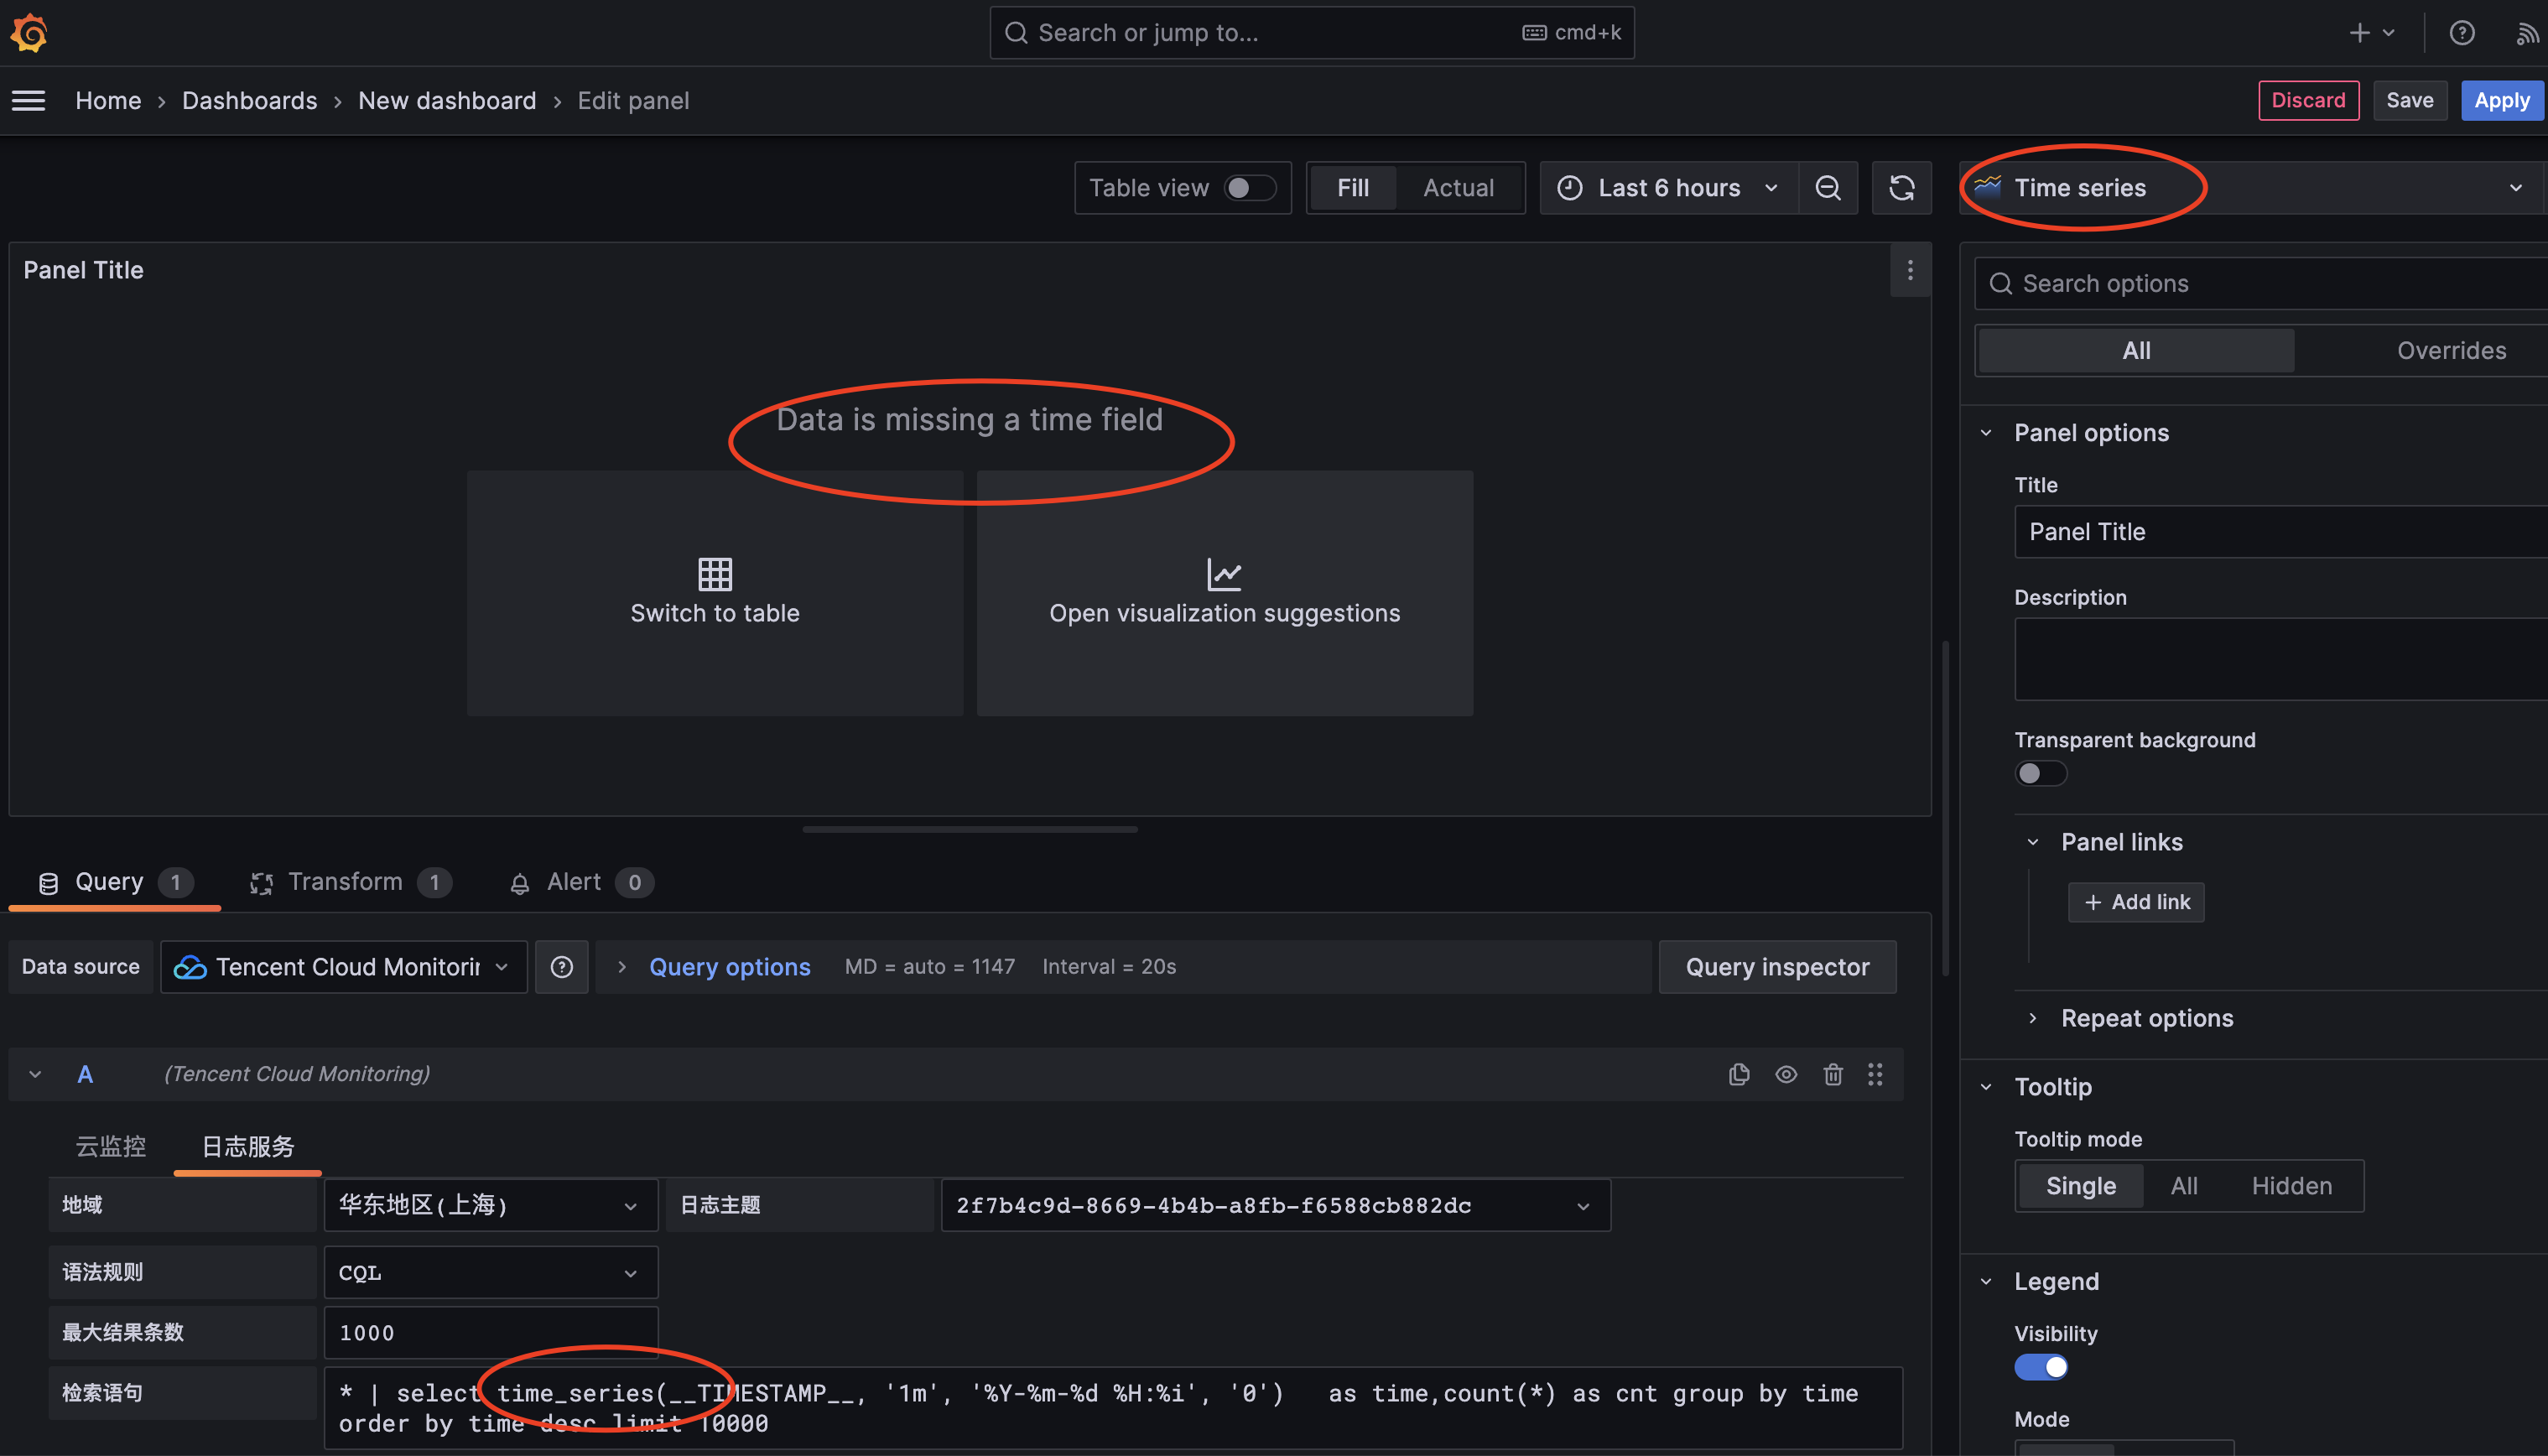
How to Handle "Data Is Missing a Time Field" Notification in Grafana Time Sequence Diagram
Solution:
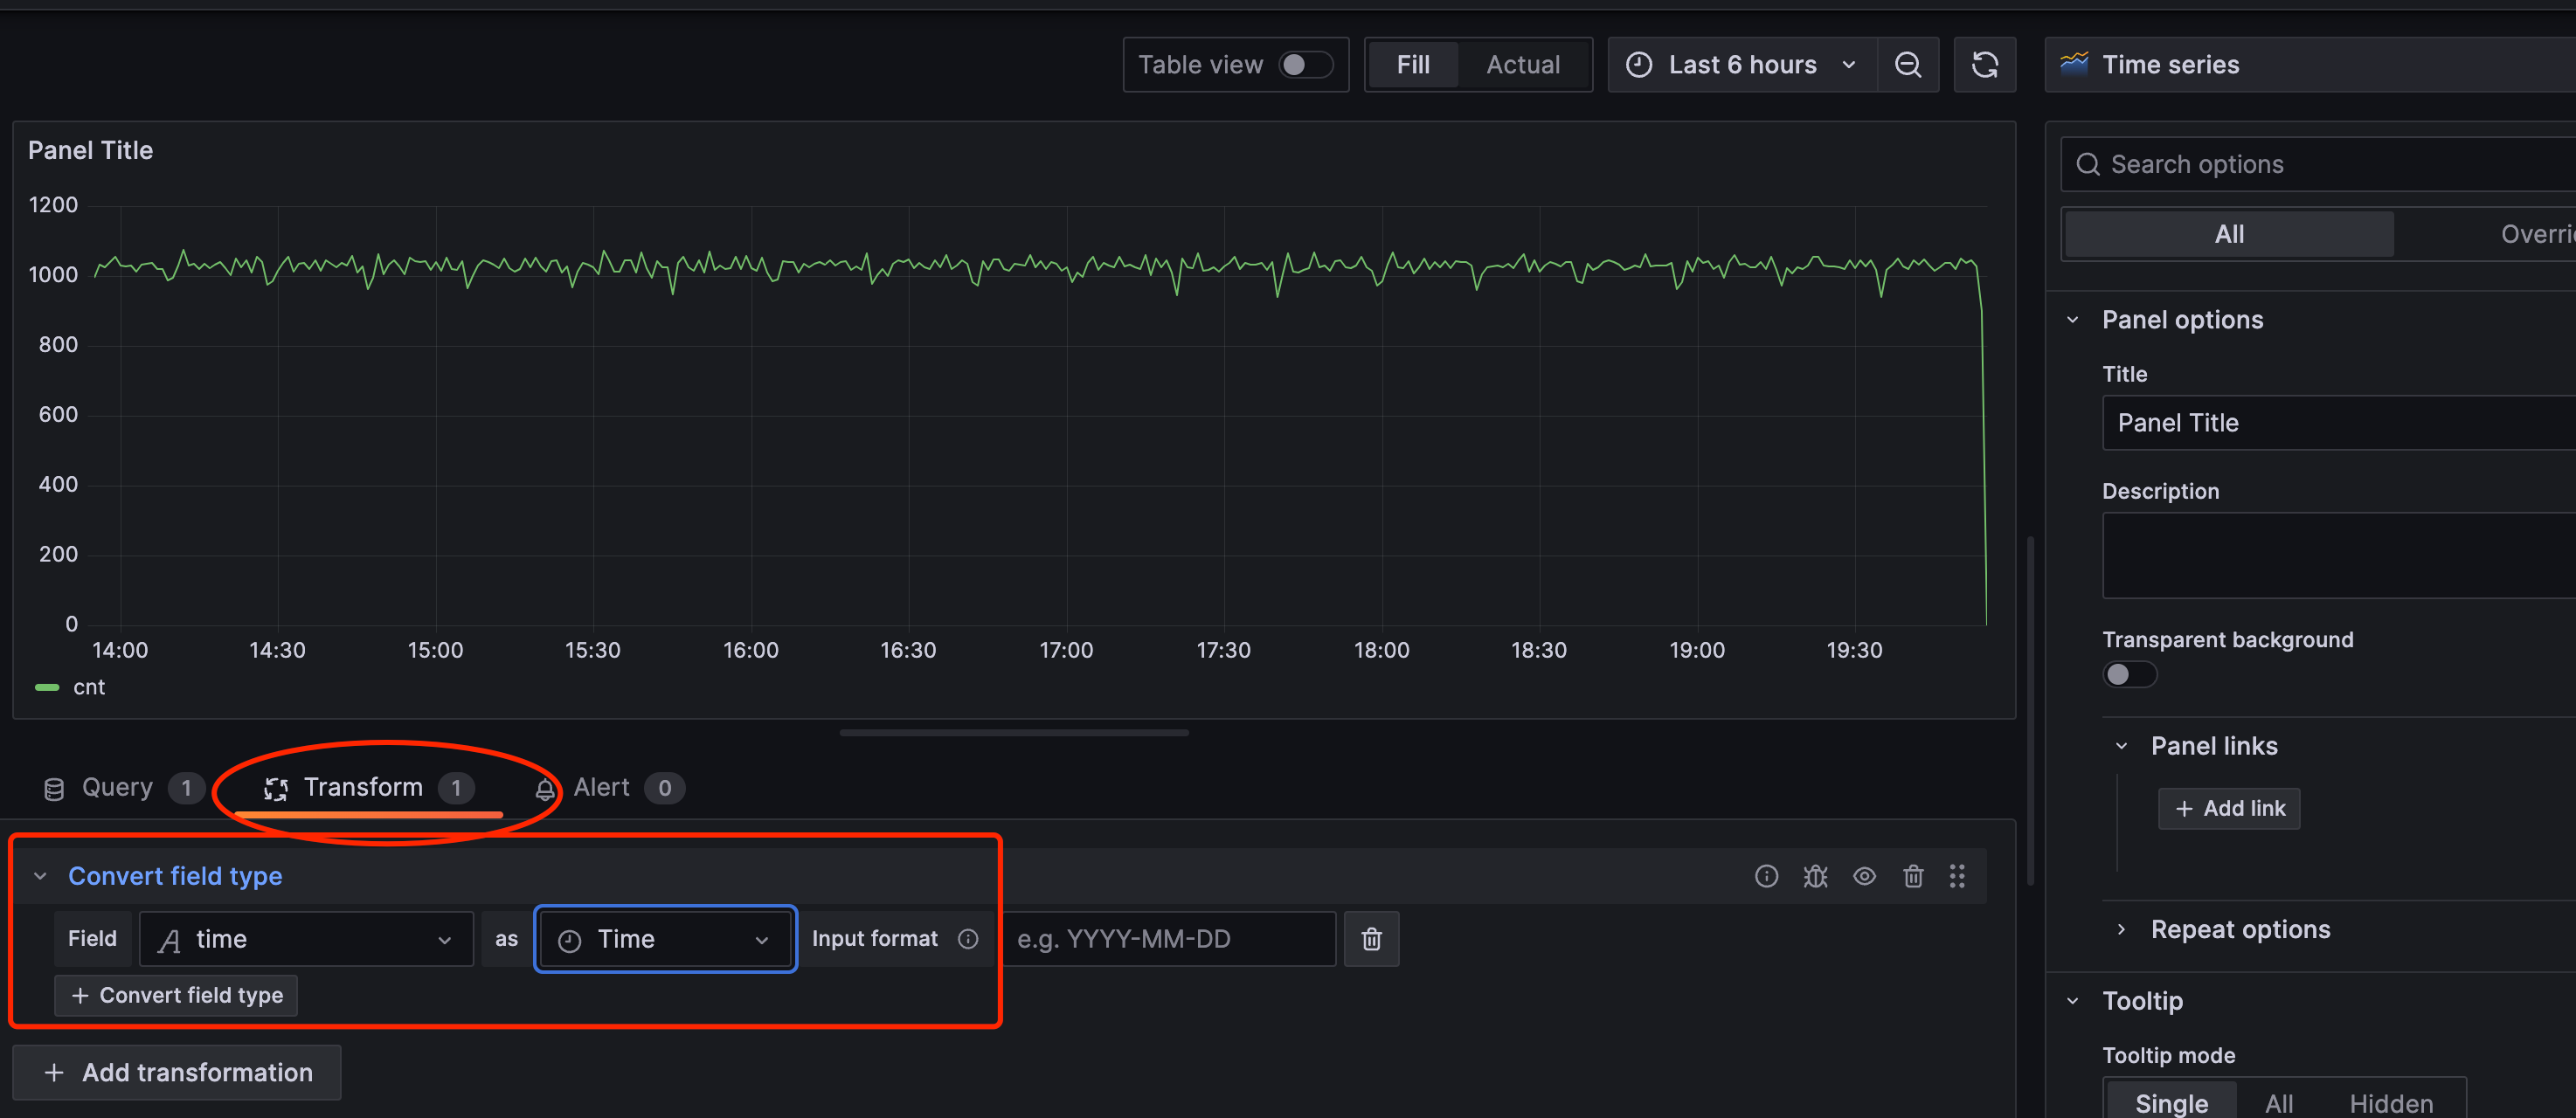
1. Click to switch to the Transform Tab page and add Convert field type.
2. Configure Convert field type, select the time field in SQL for Field, and set as to Time Type.