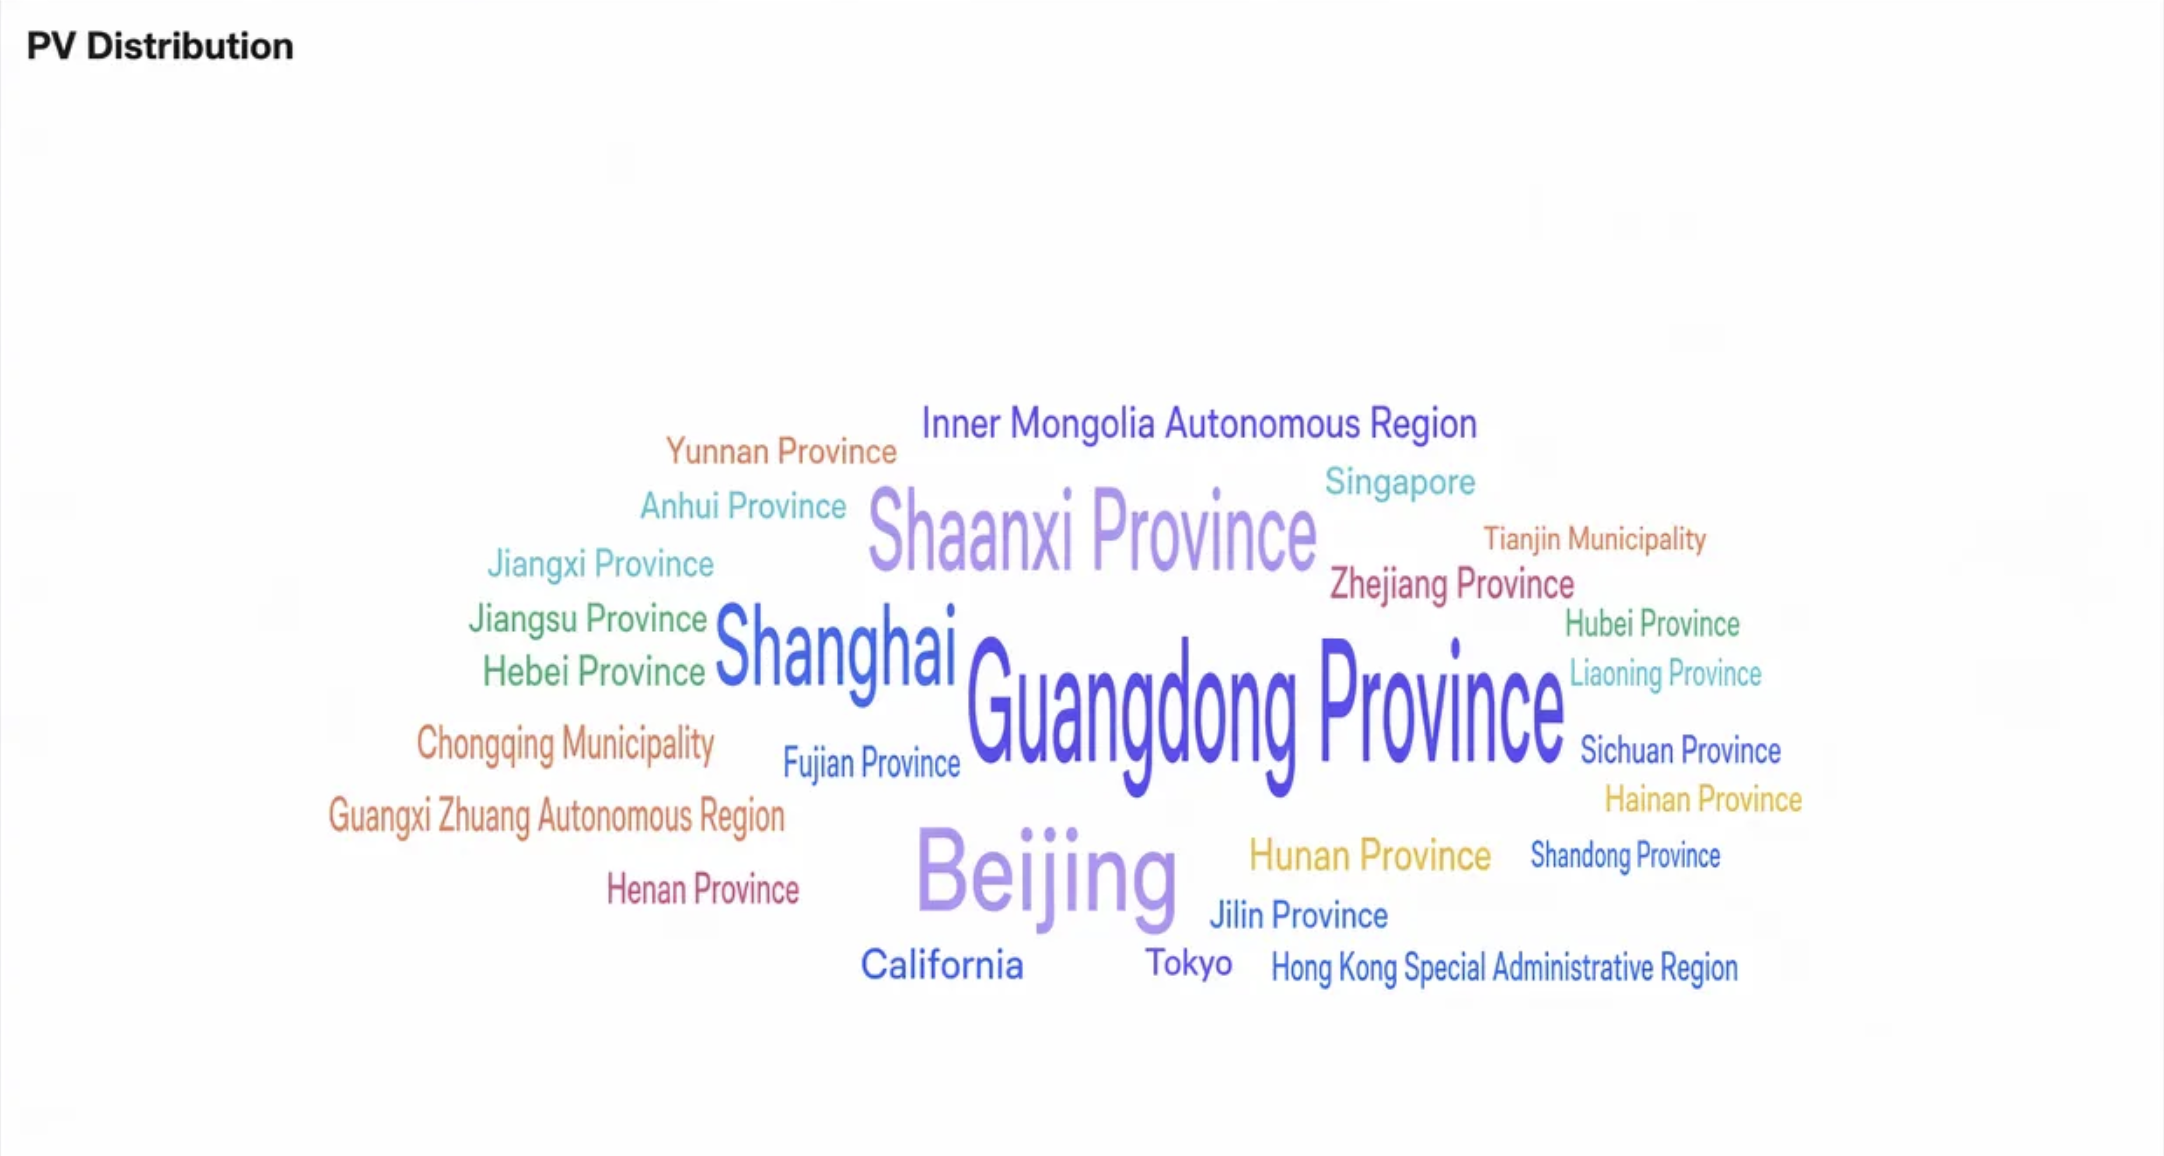
A word cloud is a visual representation of the frequency of words. It is suitable for audit statistics scenarios, such as high-frequency operations.
Operation Steps
1. Log in to the CLS console, choose Dashboard > Dashboard List, and then select the dashboard you want to view.
2. Select the target dashboard to go to its view page, click Edit, and then enter the edit page.
3. Click Add Chart to create a new chart, select Custom Chart or Quick Chart, and then set the chart type to Word Cloud.
4. Configure the chart as needed.
General configuration
Configuration Item
Description
Basic information
Chart Name: Set the display name of the chart, which can be left empty.
Description: Set the description of the chart.
Chart Style
Maximum Number of Displayed Entries: Control the maximum number of words to be displayed, i.e., top N words. Up to III words can be displayed.
Font Size: Control the font size range of words in the word cloud.
Numeric Format
Set the unit of all metric-type fields in the chart. For more information, see Unit Configuration.
Statistical Analysis Fields
For a word cloud chart, you must select a word field and a metric field. If data mismatches occur, manually select the statistical analysis field.
Configuration Item
Description
Phrase Field
A field whose values are displayed as entries. By default, a field of the string data type is selected. If no such field is available, you must manually specify a field.
Metric field
Numerical field. By default, fields with the number data type are selected. If no number field exists, you must manually specify a field.
Word Cloud Chart Example:
Statement Example
Collect statistics of the top provinces for user visits:
*|select ip_to_province(client_ip)as province ,count(*)as"number_of_visits"groupby province orderby"number_of_visits"desclimit30