- Tutorial
- Release Notes and Announcements
- Release Notes
- Public Image Release Notes
- Announcements
- Updating Some Image Pip Package Management Tools for CentOS 7
- CentOS 8 End of Maintenance
- Discontinuation of Support for SUSE Commercial Images
- Price Reduction in Selected Availability Zones
- OrcaTerm Proxy IP Addresses Updates
- Pay-as-you-go Price Adjustments for Standard S3 CVMs in the Silicon Valley Region
- Vulnerability repairing for Linux images
- Stopping supporting for Ubuntu 10.04 images
- Solution to Tomcat Start Failure on Ubuntu14.04
- Upgrading Virtio network card drive for Windows CVMs
- About Configuration of Security Group Port 53
- Windows Server 2003 System Images End of Support Announcement
- End of Support for Windows Server 2008 R2 Enterprise Edition SP1 64-bit System Images
- Product Introduction
- Purchase Guide
- Getting Started
- Operation Guide
- Operation Guide Overview
- Use Limits
- Convenience Features
- Instances
- Creating Instances
- Managing Instance Launch Template
- Batch Sequential Naming or Pattern String-Based Naming
- Logging In to Linux Instances
- Logging in to Windows instance
- Adjusting Configuration
- View Instance Details
- Renaming Instances
- Resetting Instance Password
- Managing Instance IPs
- Changing Instance Subnet
- Changing Security Group
- Conversion from Pay-As-You-Go to Monthly Subscription
- Searching for Instances
- Exporting Instance List
- Renewing Instances
- Starting Up Instances
- Shutting Down Instances
- Restarting Instances
- Reinstalling System
- Using Tencent Cloud Automation Tools to execute commands
- Terminating/Returning Instances
- Enabling Instance Termination Protection
- Instance Repossession or Recovering
- Spot Instances
- Querying the Repossession Status of a Spot Instance
- No Charges When Shut Down for Pay-as-You-Go Instances
- Managing Roles
- Enabling and Disabling Hyper-Threading
- Reserved Instances
- Images
- Migrating Servers
- Maintenance Tasks
- Cloud Disks
- Networking
- Security
- Security Groups
- Protection of Sensitive Operations
- Managing Login Password
- Managing SSH Keys
- Spread Placement Group
- Unblocking Port 25
- Tags
- Monitoring and Alarms
- Sample Console Configuration
- Best Practice
- Best Practices
- Choosing the CVM Model
- Setting up a Website
- Building an Environment
- Building a Website
- Building an Application
- Building a Visual GUI
- Data Backup
- Uploading Local Files to CVM
- Copying Local Files to CVMs
- Uploading Files from Windows to a Windows CVM via MSTSC
- Uploading Files from MacOS to Windows CVM Using MRD
- Uploading Files from Linux to Windows CVM using RDP
- Uploading files via WinSCP to a Linux CVM from Windows
- Uploading Files from Linux or MacOS to Linux CVM via SCP
- Uploading Files from Linux to a CVM Using FTP
- Uploading Files from Windows to a CVM Using FTP
- Other CVM Operations
- CVM Access to COS via a Private Network
- Best Practices for Boot Mode Legacy BIOS and UEFI
- Recovering Data on Linux CVMs
- Managing Disk Space on Windows CVMs
- Changing Kernel of a Linux Instance Manually
- Setting Up Windows-based AD Domain on a CVM
- Network Performance Test
- High-throughput Network Performance Test
- Using USB/IP to Share USB Devices in Linux
- Using RemoteFx to Redirect USB Devices in Windows
- Using AVX-512 Instructions to Accelerate AI Applications on CVM
- Building Tencent SGX Confidential Computing Environment
- Configuring Persistent Memory in M6p Instances
- Calling Cloud APIs via Python to Share Custom Images in Batches
- Operations Guide
- Initializing Data Disks
- Environment Configurations
- Installing Software
- User Data
- Work with Operating Systems
- System Activation
- System Updates
- System Shutdown
- Configuring High-performance Power Management
- Windows Recovery Mode
- Updating the Virtio ENI Driver
- Modifying SID
- Modifying VNC Resolution
- Ensuring Unique SIDs for CVMs Using Sysprep
- Use of the atop Monitoring Tools by Linux Instances
- Introduction to Linux Kernel Parameters
- Others
- Troubleshooting
- Instance-Related Failures
- CVM Login Failures
- Windows Instance Login Failures
- Windows Instance Login Failures
- An authentication error occurred when you tried to log in to a Windows instance remotely
- Failed to Reset the CVM Password or the CVM Password Is Invalid
- Connection to a Windows CVM through Remote Desktop was denied
- Requires network-level identity verification
- Problems occurred when you tried to log in to a Windows CVM remotely on Mac
- Failed to log in to a Windows CVM due to high CPU and memory usage
- Failed to connect to a remote computer through Remote Desktop
- Credentials Not Work
- Windows instance: no remote Desktop license server can provide license
- Remote Login Failure Due To Port Issues
- Linux Instance Login Failures
- Linux Instance Login Failures
- Unable to Log in to a Linux Instance via SSH Key
- Failing to log in to a Linux CVM due to high CPU and memory usage
- Remote Login Failure due to Port Issues
- VNC Login Error (Module is Unknown)
- VNC Login Error (Account Locked due to XXX Failed Logins)
- VNC Login Error (Login Failed with Correct Password)
- VNC or SSH Login Error (Permission Denied)
- Login Failure Due to /etc/fstab Configuration Errors
- sshd Configuration File Permissions
- Infinite Loop Call in /etc/profile
- Login Failure Due to Server Isolation
- Login Failure Due to High Bandwidth Occupation
- Remote Connect Failure Due to Security Group Settings
- Troubleshooting Linux Instance Issues via VNC and Rescue Mode
- Failed to shut down or restart a CVM
- Network Namespace Creation Failure
- Kernel and IO Issues
- Missing System bin or lib Soft Link
- Suspected Infection with Virus
- "no space left on device" Error During File Creation
- Linux CVM Memory Issues
- Network Related Failures
- Instance-Related Failures
- API Documentation
- History
- Introduction
- API Category
- Making API Requests
- Region APIs
- Instance APIs
- DescribeInstances
- DescribeInstanceFamilyConfigs
- DescribeZoneInstanceConfigInfos
- DescribeInstanceTypeConfigs
- DescribeInstancesOperationLimit
- DescribeInstanceVncUrl
- InquiryPriceRunInstances
- InquiryPriceResetInstance
- InquiryPriceResetInstancesType
- InquiryPriceResizeInstanceDisks
- RunInstances
- StartInstances
- RebootInstances
- StopInstances
- ResetInstance
- TerminateInstances
- ResetInstancesType
- ResizeInstanceDisks
- ResetInstancesPassword
- ModifyInstancesAttribute
- ModifyInstancesProject
- InquirePricePurchaseReservedInstancesOffering
- DescribeReservedInstancesConfigInfos
- DescribeInstancesStatus
- PurchaseReservedInstancesOffering
- Cloud Hosting Cluster APIs
- Placement Group APIs
- Image APIs
- Key APIs
- Security Group APIs
- Network APIs
- Instance Launch Template APIs
- Data Types
- Error Codes
- FAQs
- Related Agreement
- Glossary
Problem Description
When you access the CVM from a local machine or access other network resources from the CVM, network stutters. Packet loss or high latency is found when you execute the
ping command.Problem Analysis
Packet loss or high latency may be caused by backbone network congestion, network node failure, high load or system configuration. You can use MTR for further diagnosis after ruling out CVM problems.
MTR is a network diagnostic tool and provides reports that help you locate networking problems.
Solution
This document uses Linux and Windows CVM instances as an example to describe how to use MTR and analyze the report.
Note:
If ping is disabled on the local server or in the CVM instance, MTR will not generate any result.
Please see the MTR introduction and instructions corresponding to the host operating system.
WinMTR is a free network diagnostic tool for Windows integrated with Ping and tracert features. Its graphical interface allows you to intuitively see the response time and packet loss of each node.
Installing WinMTR
1. Log in to the Windows CVM.
2. On the operating system interface, visit the official website (or other valid channels) through the browser to download the WinMTR installer package corresponding to your operating system.
3. Unzip the WinMTR installer package.
Using WinMTR
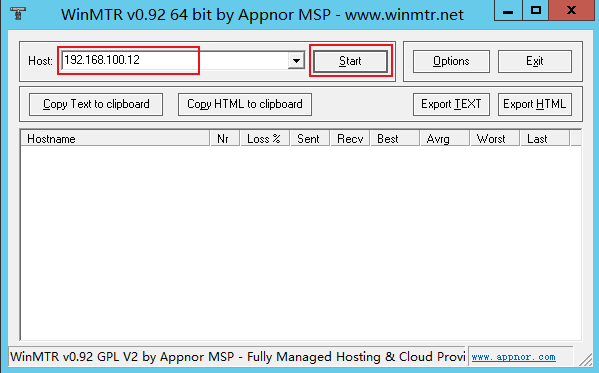
1. Double-click WinMTR.exe to open WinMTR tool.
2. Enter the IP or domain name of the host in the Host field. Then click Start as shown below:
3. Wait for WinMTR to run for a while and click Stop to stop the test as shown below:
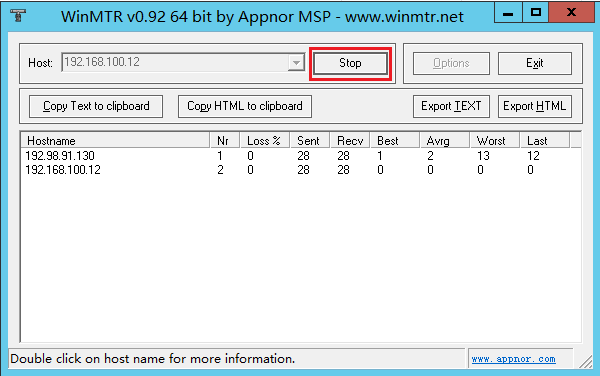
Hostname: IP or name of each host passed through on the path to the destination server.
Nr: Number of nodes that have been passed through.
Loss%: Packet loss of each node.
Sent: Number of data packets sent.
Recv: Number of responses received.
Best: Shortest response time.
Avrg: Average response time.
Worst: Longest response time.
Last: Last response time.
MTR is a network diagnostic tool for Linux integrated with Ping, traceroute and nslookup features. ICMP packets are used by default to test the network connection between two nodes.
Installing MTR Installation
Currently, all released versions of Linux have MTR preinstalled. If not, you can install MTR using the following command:
CentOS:
yum install mtr
Ubuntu:
sudo apt-get install mtr
MTR Parameters
-h/--help: Displays help menu.
-v/--version: Displays MTR version information.
-r/--report: Outputs the result in a report.
-p/--split: Different from --report, -p/--split lists the result of each trace separately.
-c/--report-cycles: Sets the number of data packets sent per second. Default is 10.
-s/--psize: Sets the size of each data packet.
-n/--no-dns: Disables domain name resolution for IP address.
-a/--address: Sets the IP address from which data packets are sent. It is mainly used for scenarios with a single host and multiple IP addresses.
-4: IPv4
-6: IPv6
Sample code
Take a local machine to server (IP: 119.28.98.39) as an example.
Execute the following command to output the diagnostic result of MTR in a report.
mtr 119.28.98.39 --report
Information similar to the following is returned:
[root@VM_103_80_centos ~]# mtr 119.28.98.39 --reportStart: Mon Feb 5 11:33:34 2019HOST:VM_103_80_centos Loss% Snt Last Avg Best Wrst StDev1.|-- 100.119.162.130 0.0% 10 6.5 8.4 4.6 13.7 2.92.|-- 100.119.170.58 0.0% 10 0.8 8.4 0.6 1.1 0.03.|-- 10.200.135.213 0.0% 10 0.4 8.4 0.4 2.5 0.64.|-- 10.200.16.173 0.0% 10 1.6 8.4 1.4 1.6 0.05.|-- 14.18.199.58 0.0% 10 1.0 8.4 1.0 4.1 0.96.|-- 14.18.199.25 0.0% 10 4.1 8.4 3.3 10.2 1.97.|-- 113.96.7.214 0.0% 10 5.8 8.4 3.1 10.1 2.18.|-- 113.96.0.106 0.0% 10 3.9 8.4 3.9 11.0 2.59.|-- 202.97.90.206 30.0% 10 2.4 8.4 2.4 2.5 0.010.|-- 202.97.94.77 0.0% 10 3.5 4.6 3.5 7.0 1.211.|-- 202.97.51.142 0.0% 10 164.7 8.4 161.3 165.3 1.212.|-- 202.97.49.106 0.0% 10 162.3 8.4 161.7 167.8 2.013.|-- ix-xe-10-2-6-0.tcore2.LVW 10.0% 10 168.4 8.4 161.5 168.9 2.314.|-- 180.87.15.25 10.0% 10 348.1 8.4 347.7 350.2 0.715.|-- 180.87.96.21 0.0% 10 345.0 8.4 343.4 345.0 0.316.|-- 180.87.96.142 0.0% 10 187.4 8.4 187.3 187.6 0.017.|-- ??? 100.0% 10 0.0 8.4 0.0 0.0 0.018.|-- 100.78.119.231 0.0% 10 187.7 8.4 187.3 194.0 2.519.|-- 119.28.98.39 0.0% 10 186.5 8.4 186.4 186.5 0.0
The main output information is as follows
Host: IP address or domain name of a node.
Loss%: Packet loss.
Snt: Number of data packets sent per second.
Last: Last response time.
Avg: Average response time.
Best: Shortest response time.
Wrst: Longest response time.
StDev: Standard deviation. A higher standard deviation indicates a larger difference in the response time of data packets at this node.
Report analysis and troubleshooting
Note:
Due to network asymmetry, we recommend you collect two-way MTR data (from the local server to the destination server and from the destination server to the local server) if any network error occurs.
1. According to the report, check whether there is packet loss on the destination IP.
If there is no packet loss on the destination IP, network conditions are normal.
If there is packet loss on the destination IP, perform Step 2.
2. Check the result to locate the node where the first packet loss occurred.
If packet loss occurred at the destination server, it may be caused by incorrect network configuration of the destination server. Please check its firewall configuration.
If packet loss occurred at the first three hops, it may be caused by network problems of the local machine’s ISP. If the problem also happens when you access other addresses, report it to your ISP.
If packet losses frequently occur and the network is considered unstable, submit a ticket for assistance and attach the test screenshots to help the engineer locate the problem.

 Yes
Yes
 No
No
Was this page helpful?