When using MongoDB, you need to monitor its running status to know whether it runs normally and troubleshoot its faults. TMP provides an exporter to monitor MongoDB and offers an out-of-the-box Grafana monitoring dashboard for it. This document describes how to deploy the MongoDB exporter and integrate it with the alert feature.
Note:
For easier export installation and management, we recommend you use TKE for unified management.
Prerequisites
You have created a TKE cluster in the region and VPC of your TMP instance.
You have located and integrated the target TKE cluster in the Integrate with TKE section of the target TMP instance in the TMP console. For more information, please see Agent Management.
1. On the left sidebar, select Workload > Deployment to enter the Deployment page.
2. In the top-right corner of the page, click Create via YAML to create a YAML configuration as detailed below:
You can use Kubernetes Secrets to manage and encrypt passwords. When starting the MongoDB exporter, you can directly use the Secret key but need to adjust the corresponding URI. Below is a sample YAML configuration:
apiVersion: v1
kind: Secret
metadata:
name: mongodb-secret-test
namespace: mongodb-test
type: Opaque
stringData:
datasource:"mongodb://{user}:{passwd}@{host1}:{port1},{host2}:{port2},{host3}:{port3}/admin"# Corresponding connection URI
Deploying MongoDB exporter
On the Deployment management page, click Create and select the target namespace to deploy the service. You can create in the console. Here, YAML is used to deploy the exporter. Below is a sample YAML configuration:
apiVersion: apps/v1
kind: Deployment
metadata:
labels:
k8s-app: mongodb-exporter # Rename the exporter based on the business needs. We recommend you add the MongoDB instance information
name: mongodb-exporter # Rename the exporter based on the business needs. We recommend you add the MongoDB instance information
namespace: mongodb-test
spec:
replicas:1
selector:
matchLabels:
k8s-app: mongodb-exporter # Rename the exporter based on the business needs. We recommend you add the MongoDB instance information
template:
metadata:
labels:
k8s-app: mongodb-exporter # Rename the exporter based on the business needs. We recommend you add the MongoDB instance information
spec:
containers:
-args:
---collect.database # Enable the collection of `Database` metrics
---collect.collection # Enable the collection of `Collection` metrics
---collect.topmetrics # Enable the collection of `table top` metrics
---collect.indexusage # Enable the collection of `per index usage stats`
---collect.connpoolstats # Enable the collection of `MongoDB connpoolstats`
env:
-name: MONGODB_URI
valueFrom:
secretKeyRef:
name: mongodb-secret-test
key: datasource
image: ssheehy/mongodb-exporter
imagePullPolicy: IfNotPresent
name: mongodb-exporter
ports:
-containerPort:9216
name: metric-port # This name is required during scrape task configuration
1. Click the newly created Deployment on the Deployment page to enter the Deployment management page.
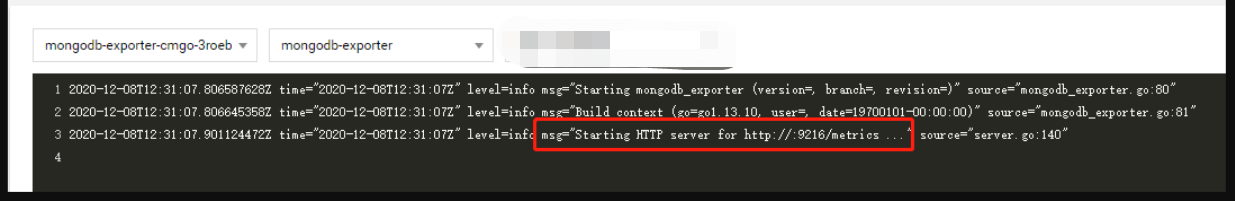
2. Click the Log tab, and you can see that the exporter is successfully started and its address is exposed as shown below:
3. Click the Pod Management tab to enter the Pod page.
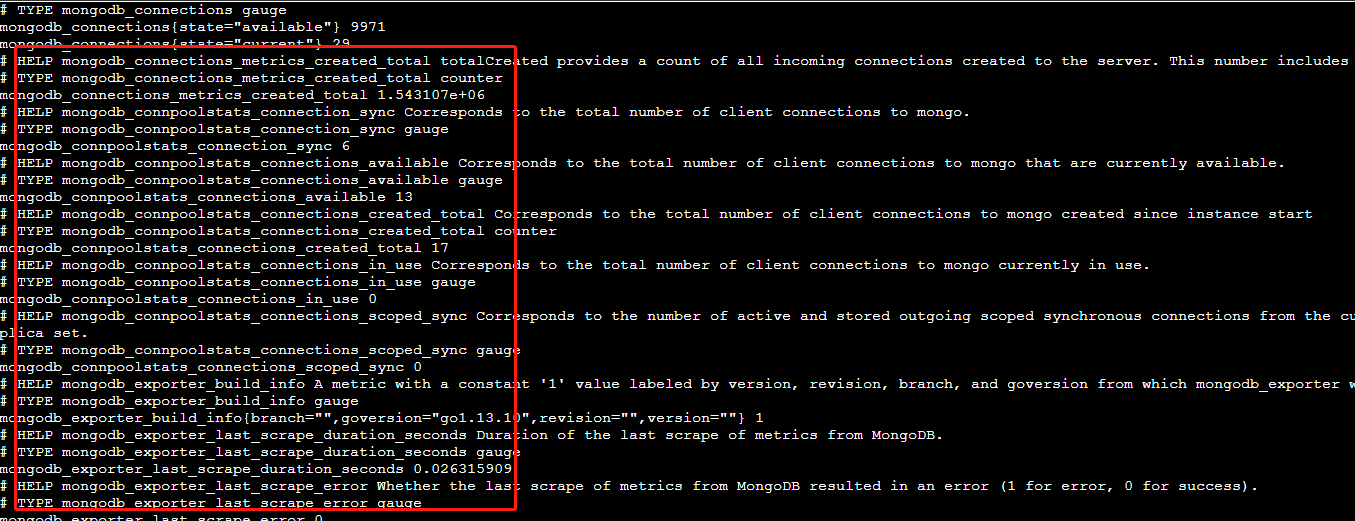
4. In the Operations column on the right, click Remote Login to log in to the Pod. Run the following wget command with the address exposed by the exporter on the command line, and you can get the corresponding MongoDB metrics normally. If no corresponding data is returned, please check whether the connection URI is correct as shown below:
wget127.0.0.1:9216/metrics
cat metrics
The command execution result is as shown below:
Adding scrape task
1. Log in to the TMP console and select the target TMP instance to enter the management page.
2. Click a cluster ID in the TKE cluster list to enter the Integrate with TKE page.
3. In Scrape Configuration, add Pod Monitor to define a Prometheus scrape task. Below is a sample YAML configuration:
apiVersion: monitoring.coreos.com/v1
kind: PodMonitor
metadata:
name: mongodb-exporter # Enter a unique name
namespace: cm-prometheus # The namespace is fixed. Do not change it
spec:
podMetricsEndpoints:
-interval: 30s
port: metric-port # Enter the name of the corresponding port of the Prometheus exporter in the Pod YAML configuration file
path: /metrics # Enter the value of the corresponding path of the Prometheus exporter. If it is not specified, it will be `/metrics` by default
relabelings:
-action: replace
sourceLabels:
- instance
regex: (.*)
targetLabel: instance
replacement:'cmgo-xxxxxxxx'# Change it to the corresponding MongoDB instance ID
namespaceSelector:# Select the namespace where the Pod to be monitored resides
matchNames:
- mongodb-test
selector:# Enter the label value of the Pod to be monitored to locate the target Pod
matchLabels:
k8s-app: mongodb-exporter
Note:
As the exporter and MongoDB are deployed on different servers, we recommend you use the Prometheus relabeling mechanism to add the MongoDB instance information to the monitoring metrics so as to locate problems more easily.
Viewing monitoring information
1. Log in to the TMP console and select the target TMP instance to enter the management page.
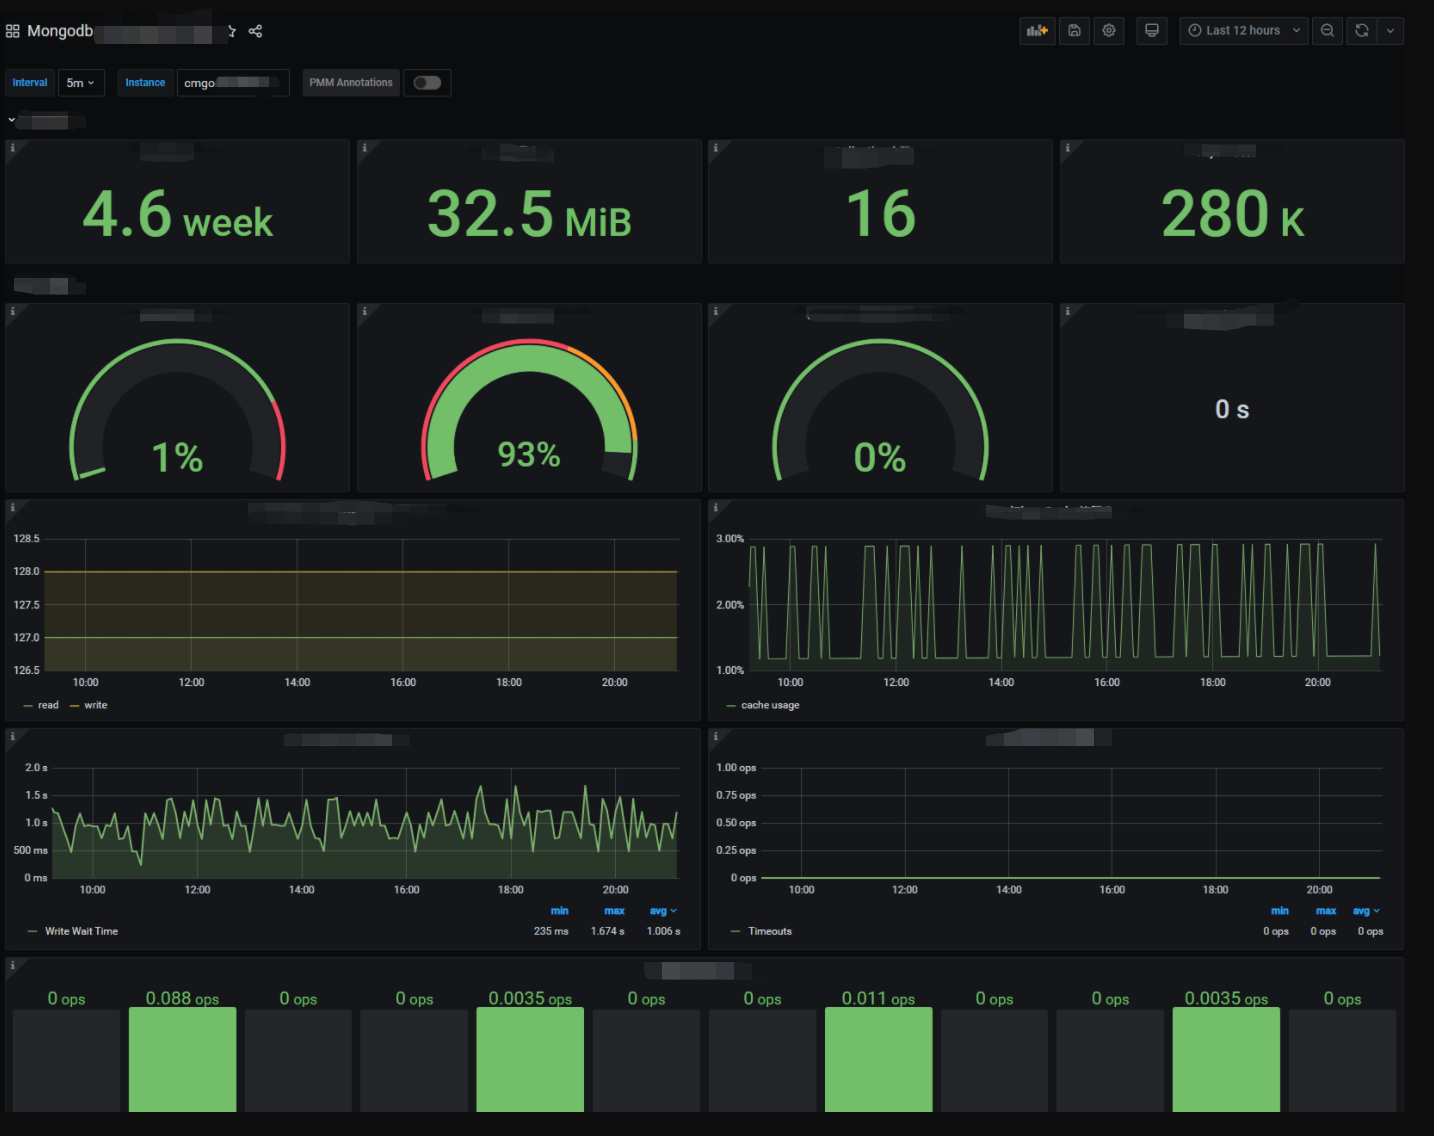
2. Click Integration Center to enter the Integration Center page. Find MongoDB monitoring, install the corresponding Grafana dashboard, and then you can enable the MongoDB monitoring dashboard to view instance monitoring data as shown below:
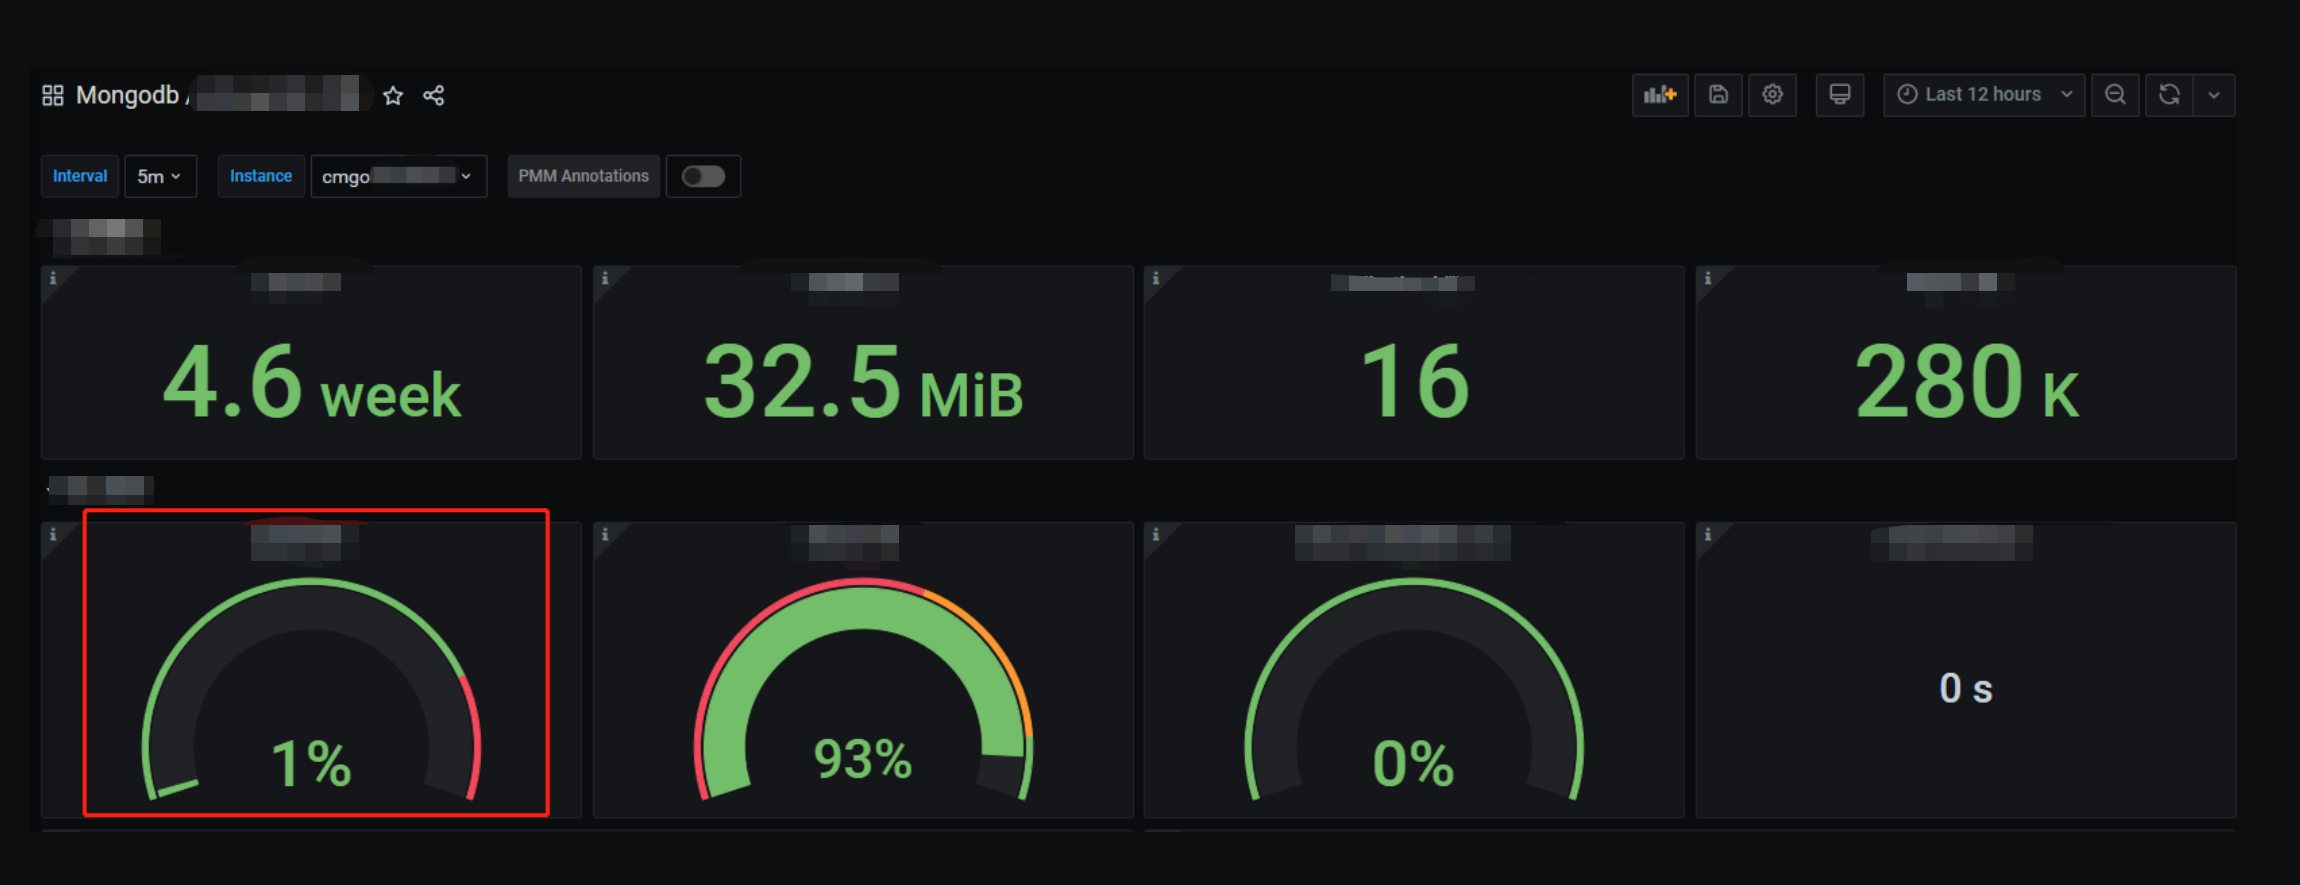
MongoDB Overview: you can view the status of each instance, such as number of documents, connection utilization, and read/write time. You can click an instance to view its details.
MongoDB Details: you can view the detailed status of an instance, such as metadata overview, core metrics, command operations, request traffic, and top reads/writes.
Note:
You can click ! on the left of each chart to view the description.
Integrating with alert feature
1. Log in to the TMP console and select the target TMP instance to enter the management page.
2. Click Alerting Rule and add the corresponding alerting rules. For more information, please see Creating Alerting Rule.
FAQs
The client reported an error "client checkout connect timeout". What should I do?
This is probably because that the connection pool utilization has reached 100%, resulting in a connection creation failure. You can check the Connection Utilization metric in MongoDB Details > Core Metrics on the Grafana dashboard for troubleshooting.
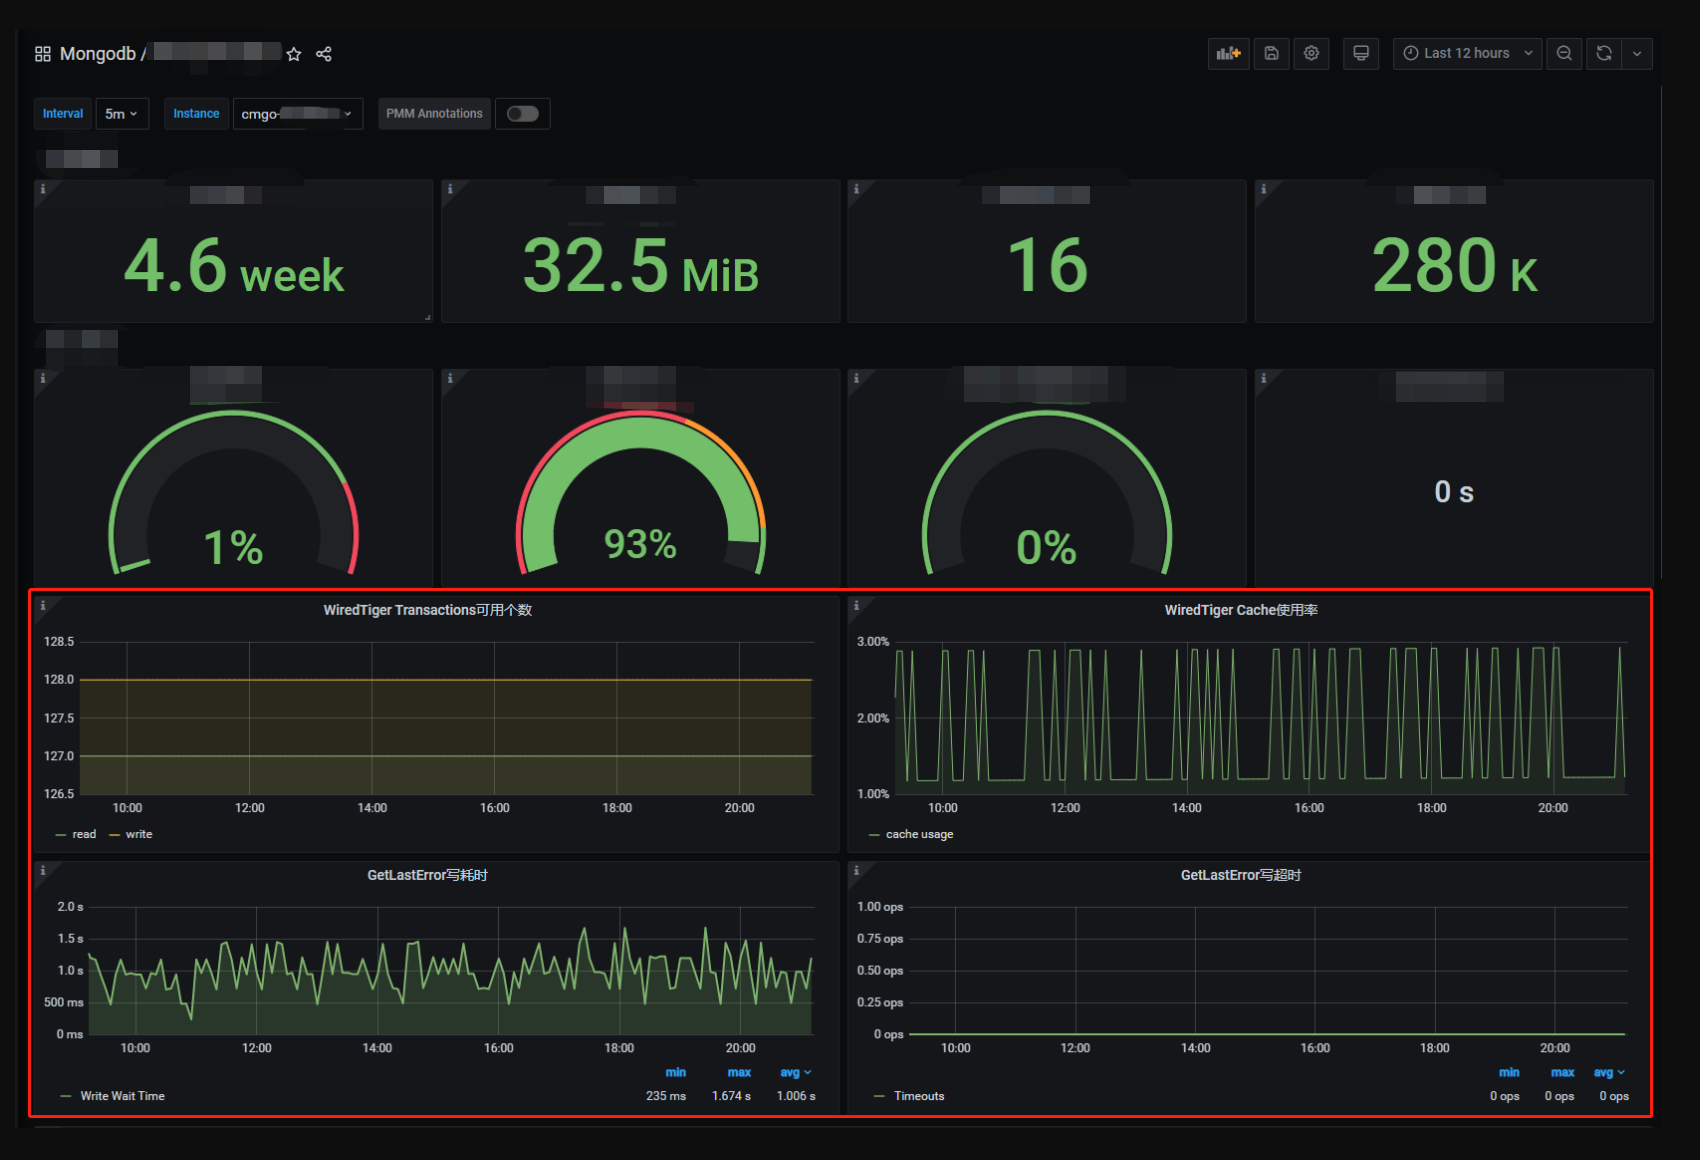
Write keeps timing out. What should I do?
Check whether the cache utilization is excessive and whether the number of available transactions is 0. You can check the Available WiredTiger Transactions, WiredTiger Cache Utilization, and GetLastError Write Time metrics in MongoDB Details > Core Metrics on the Grafana dashboard for troubleshooting.