Kafka Exporter Integration
Download
Focus Mode
Font Size
Scenarios
When using Kafka, you need to monitor its running status, such as cluster status and message heap. TMP provides an exporter to monitor Kafka and offers an out-of-the-box Grafana monitoring dashboard for it. This document describes how to deploy the Kafka exporter and integrate it with the alert feature.
Note:
Note: If the Kafka to be monitored is Tencent Cloud TDMQ for CKafka, it is recommended to use the Cloud Monitor integration in the integration center, which supports one-click collection of cloud product metrics.
Access Method
Method 1: One-Click Installation (Recommended)
Prerequisites
The Prometheus instance resides in a VPC that has network connectivity with Kafka.
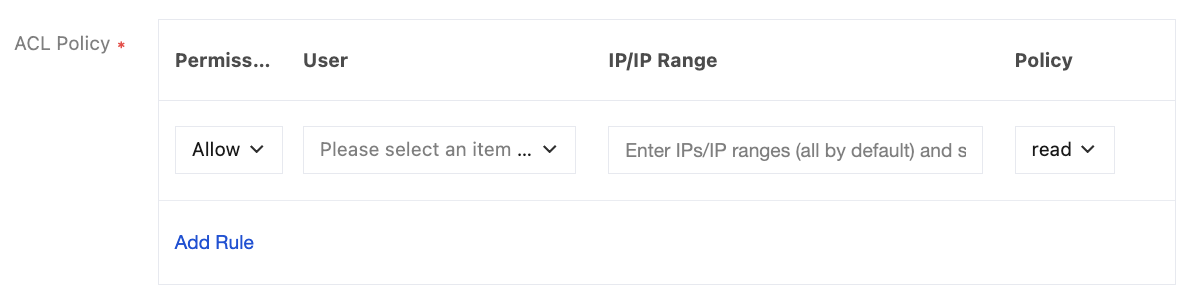
Allow read permission for Prometheus IPv4 addresses in Kafka. For detailed steps, see configure ACL policy.
Operation Steps
1. Log in to the TMP console.
2. Select the corresponding Prometheus instance from the instance list.
3. Go to the instance details page, and select Data Collection > Integration Center.
4. In the Integration Center, locate and click Kafka to open an installation window. On the installation page, enter details such as the metric collection name and address, then click save.
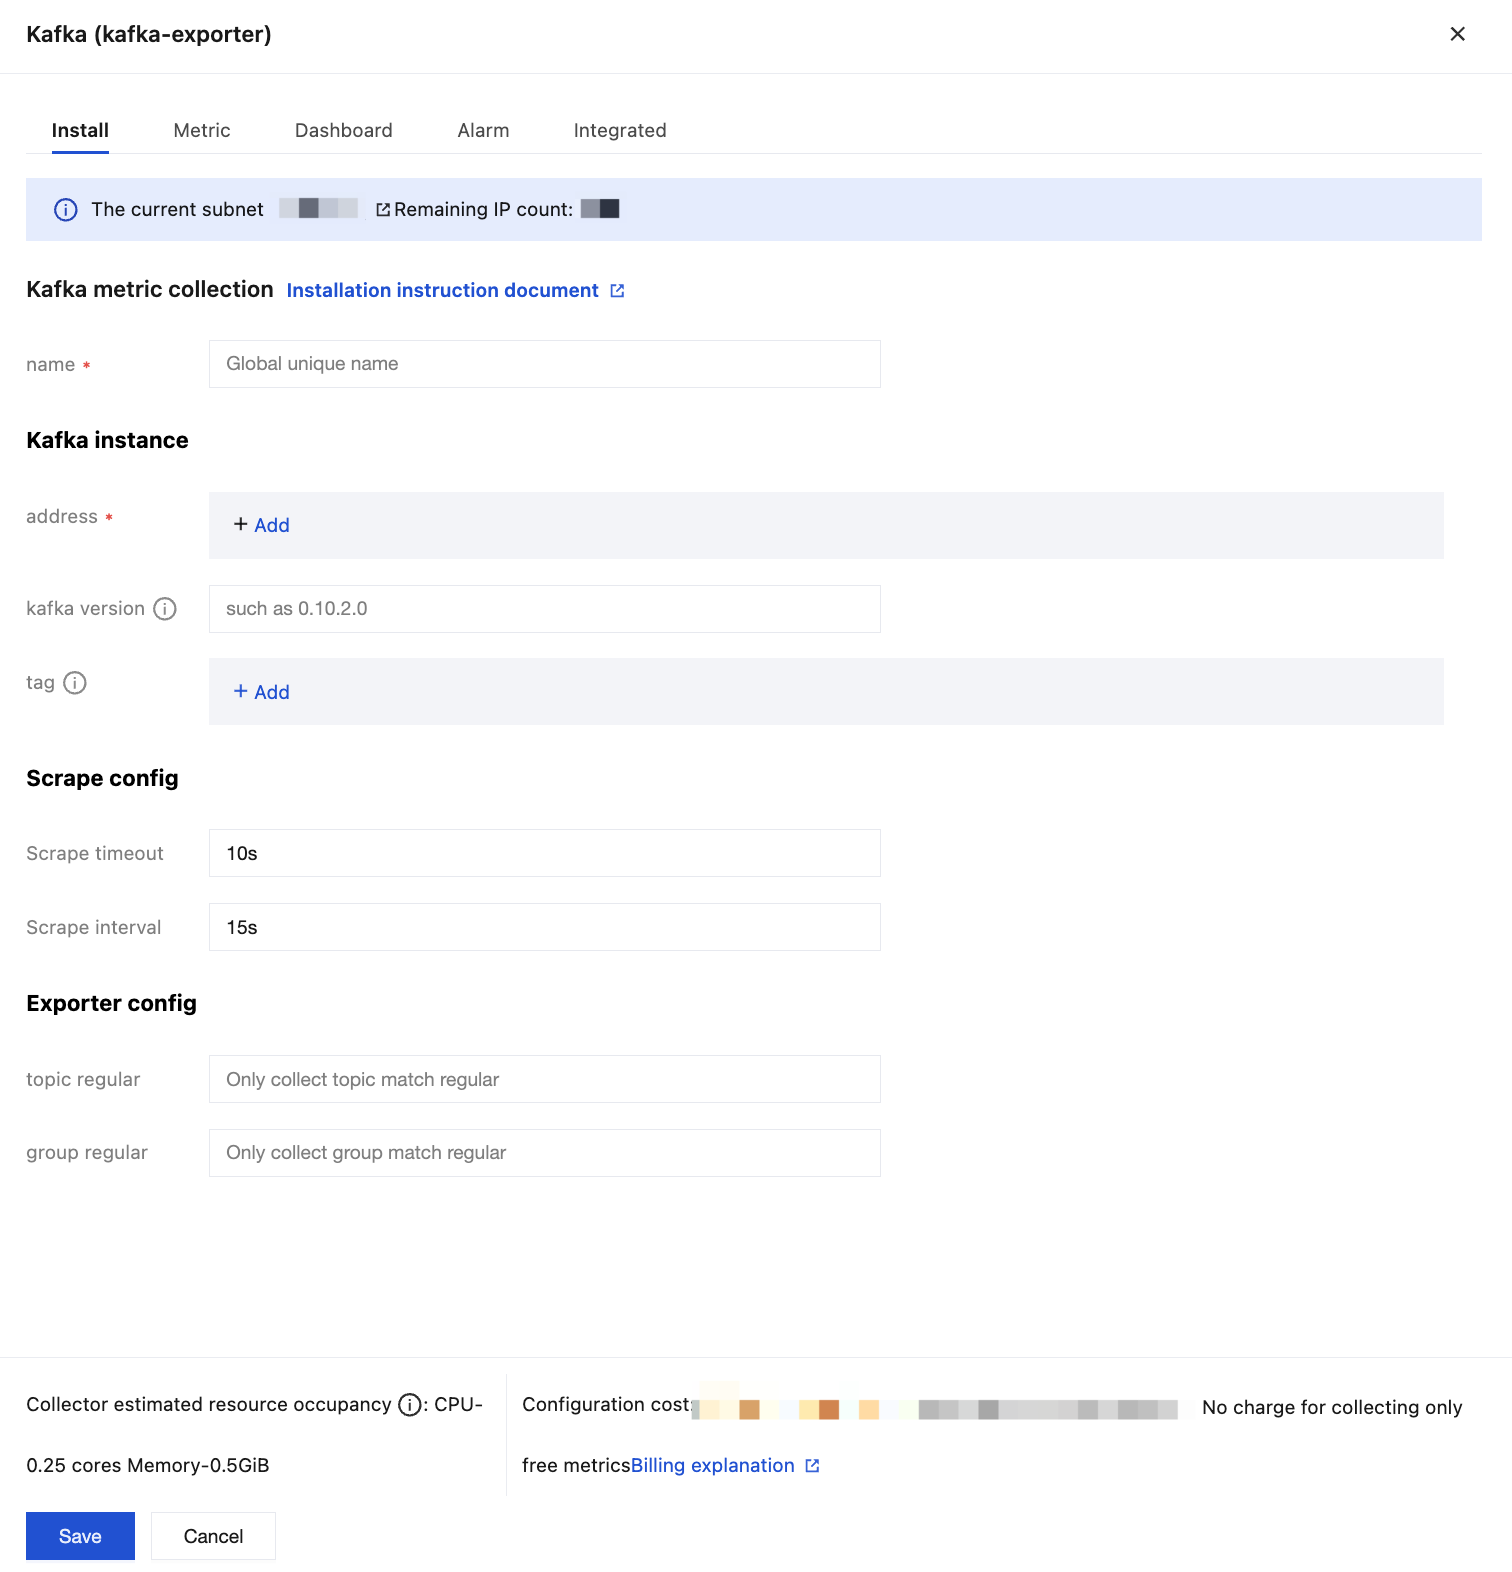
Configuration Description
Parameter | Description |
name | Exporter name, which should meet the following requirements: The name should be unique. The name should conform to the following regular expression: '^[a-z0-9]([-a-z0-9]*[a-z0-9])?(\\.[a-z0-9]([-a-z0-9]*[a-z0-9])?)*$'. |
address | Fill in the Kafka Broker connection address. |
kafka version | Optional, partial specified versions are required, such as 0.10.2.0. |
tag | Custom labels for metrics. |
Scrape interval | Data scrape interval, fill example: 60s, 1m30s, 5m, 1h30m. |
Scrape timeout | The scrape timeout must be less than or equal to the scrape interval. Enter the same way as the scrape interval. |
topic regular | Optional. Collects all topics by default if left blank. After filling in, only topics that meet the regular expression will be collected. |
group regular | Optional. Collects all groups by default if left blank. After filling in, only groups that meet the regular expression will be collected. |
Method 2: Custom Installation
Note:
Prerequisites
Create a Tencent Cloud container service in the region and VPC of the Prometheus instance, and set up a namespace for cluster creation.
In the TMP console, select the corresponding Prometheus instance > Data Collection > Integrate with TKE to locate the corresponding container cluster and complete the cluster association. For more information, see Associating Clusters.
Allow read permission for Prometheus IPv4 addresses in Kafka, same as the prerequisite for one-click installation in the previous context.
Operation Steps
Step 1: Deploying the Exporter
1. Log in to the TKE console.
2. Click Cluster in the left sidebar.
3. Click the ID/name of the cluster whose access credential you want to get to enter the cluster management page.
4. On the left sidebar, select Workload > Deployment to enter the Deployment page.
5. On the Deployment management page, click Create and select the target namespace to deploy the service. You can create in the console. Here, YAML is used to deploy the exporter. Below is a sample YAML configuration:
apiVersion: apps/v1kind: Deploymentmetadata:labels:k8s-app: kafka-exporter # Rename the exporter based on the business needs. We recommend you add the Kafka instance information, such as ckafka-2vrgx9fd-kafka-exportername: kafak-exporter # Rename the exporter based on the business needs. We recommend you add the Kafka instance information, such as ckafka-2vrgx9fd-kafka-exporternamespace: kafka-demo # The namespace of the cluster where the exporter will be deployedspec:replicas: 1selector:matchLabels:k8s-app: kafka-exporter # Rename the exporter based on the business needs. We recommend you add the Kafka instance information, such as ckafka-2vrgx9fd-kafka-exportertemplate:metadata:labels:k8s-app: kafka-exporter # Rename the exporter based on the business needs. We recommend you add the Kafka instance information, such as ckafka-2vrgx9fd-kafka-exporterspec:containers:- args:--kafka.server=x.x.x.x:9092 # Address of the Kafka instanceimage: ccr.ccs.tencentyun.com/rig-agent/kafka-exporter:v1.3.0imagePullPolicy: IfNotPresentname: kafka-exporterports:- containerPort: 9308name: metric-port # This name is required when configuring a scraping tasksecurityContext:privileged: falseterminationMessagePath: /dev/termination-logterminationMessagePolicy: FilednsPolicy: ClusterFirstimagePullSecrets:- name: qcloudregistrykeyrestartPolicy: AlwaysschedulerName: default-schedulersecurityContext: {}terminationGracePeriodSeconds: 30
Note:
Step Two: Add Collection Task
1. Log in to the TMP console and select the target TMP instance to enter the management page.
2. Enter Integrate with TKE, select the associated cluster, and choose Data Collection Configuration > Custom Monitoring > Customize Monitoring Configuration > Via YAML to add a collection task.
Monitoring Type: Select
PodMonitors. YAML configuration example as follows:apiVersion: monitoring.coreos.com/v1kind: PodMonitormetadata:name: kafka-exporter # Enter a unique namenamespace: cm-prometheus # Pay-as-you-go instance: cluster namespace; Monthly subscription instance (no longer available): namespace is fixed, do not changespec:podMetricsEndpoints:-interval: 30s # sampling intervalport: metric-port # Fill the spec.template.spec.containers[0].ports[0].name in the yaml file in Step 1.path: /metrics # Exporter metric collection path, default is /metricsrelabelings:- action: replacesourceLabels:- instanceregex: (.*)targetLabel: instancereplacement: 'ckafka-xxxxxx' # Adjust to the corresponding Kafka instance ID- action: replacesourceLabels:- instanceregex: (.*)targetLabel: ipreplacement: '1.x.x.x' # Adjust to the corresponding Kafka instance IPnamespaceSelector:matchNames:-kafka-demo # Fill in the namespace where the Exporter residesselector: # Enter the Label value of the pod to be monitored to locate the target pod.matchLabels:k8s-app: kafka-exporter
Note:
Note: Since
Exporter and Kafka are deployed on different servers, it is recommended that the Kafka instance information be placed into monitoring metrics via the Prometheus Relabel Mechanism so that you can troubleshoot.Viewing Monitoring Data
Prerequisites
The Prometheus instance has been bound to a Grafana instance.
Operation Steps
1. Log in to the TMP console and select the corresponding Prometheus instance to go to the management page.
2. Select Data Collection > Integration Center. On the Integration Center page, find Kafka monitoring, then select Dashboard Operation > Dashboard Installation/Upgrade to install the corresponding Grafana Dashboard.
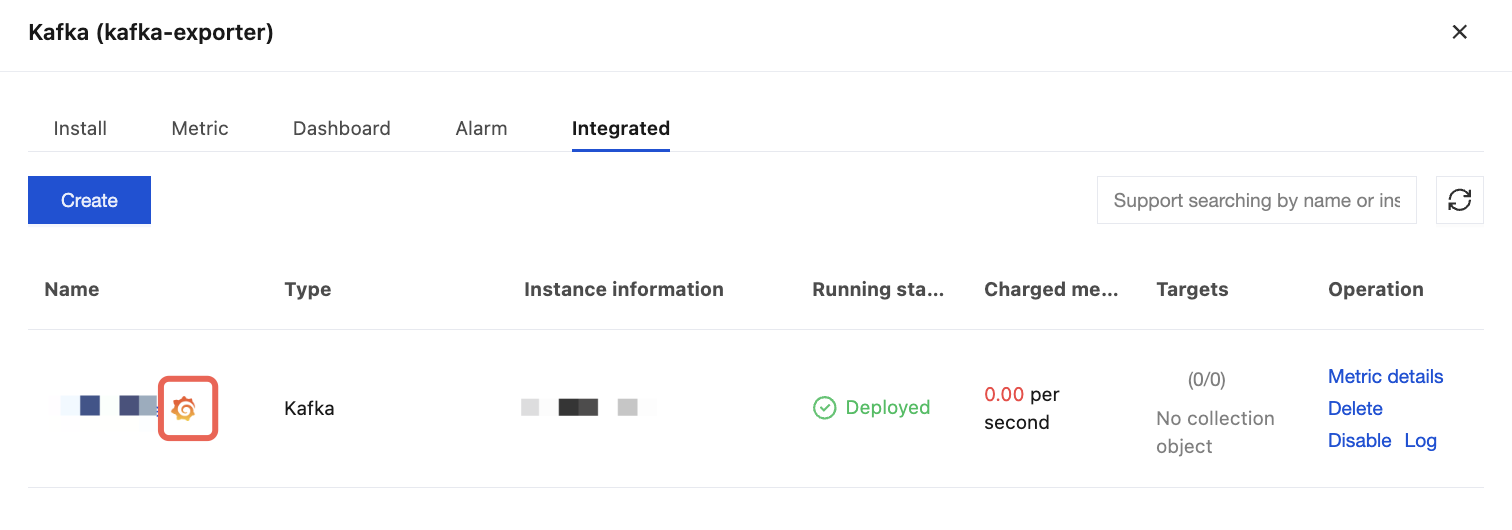
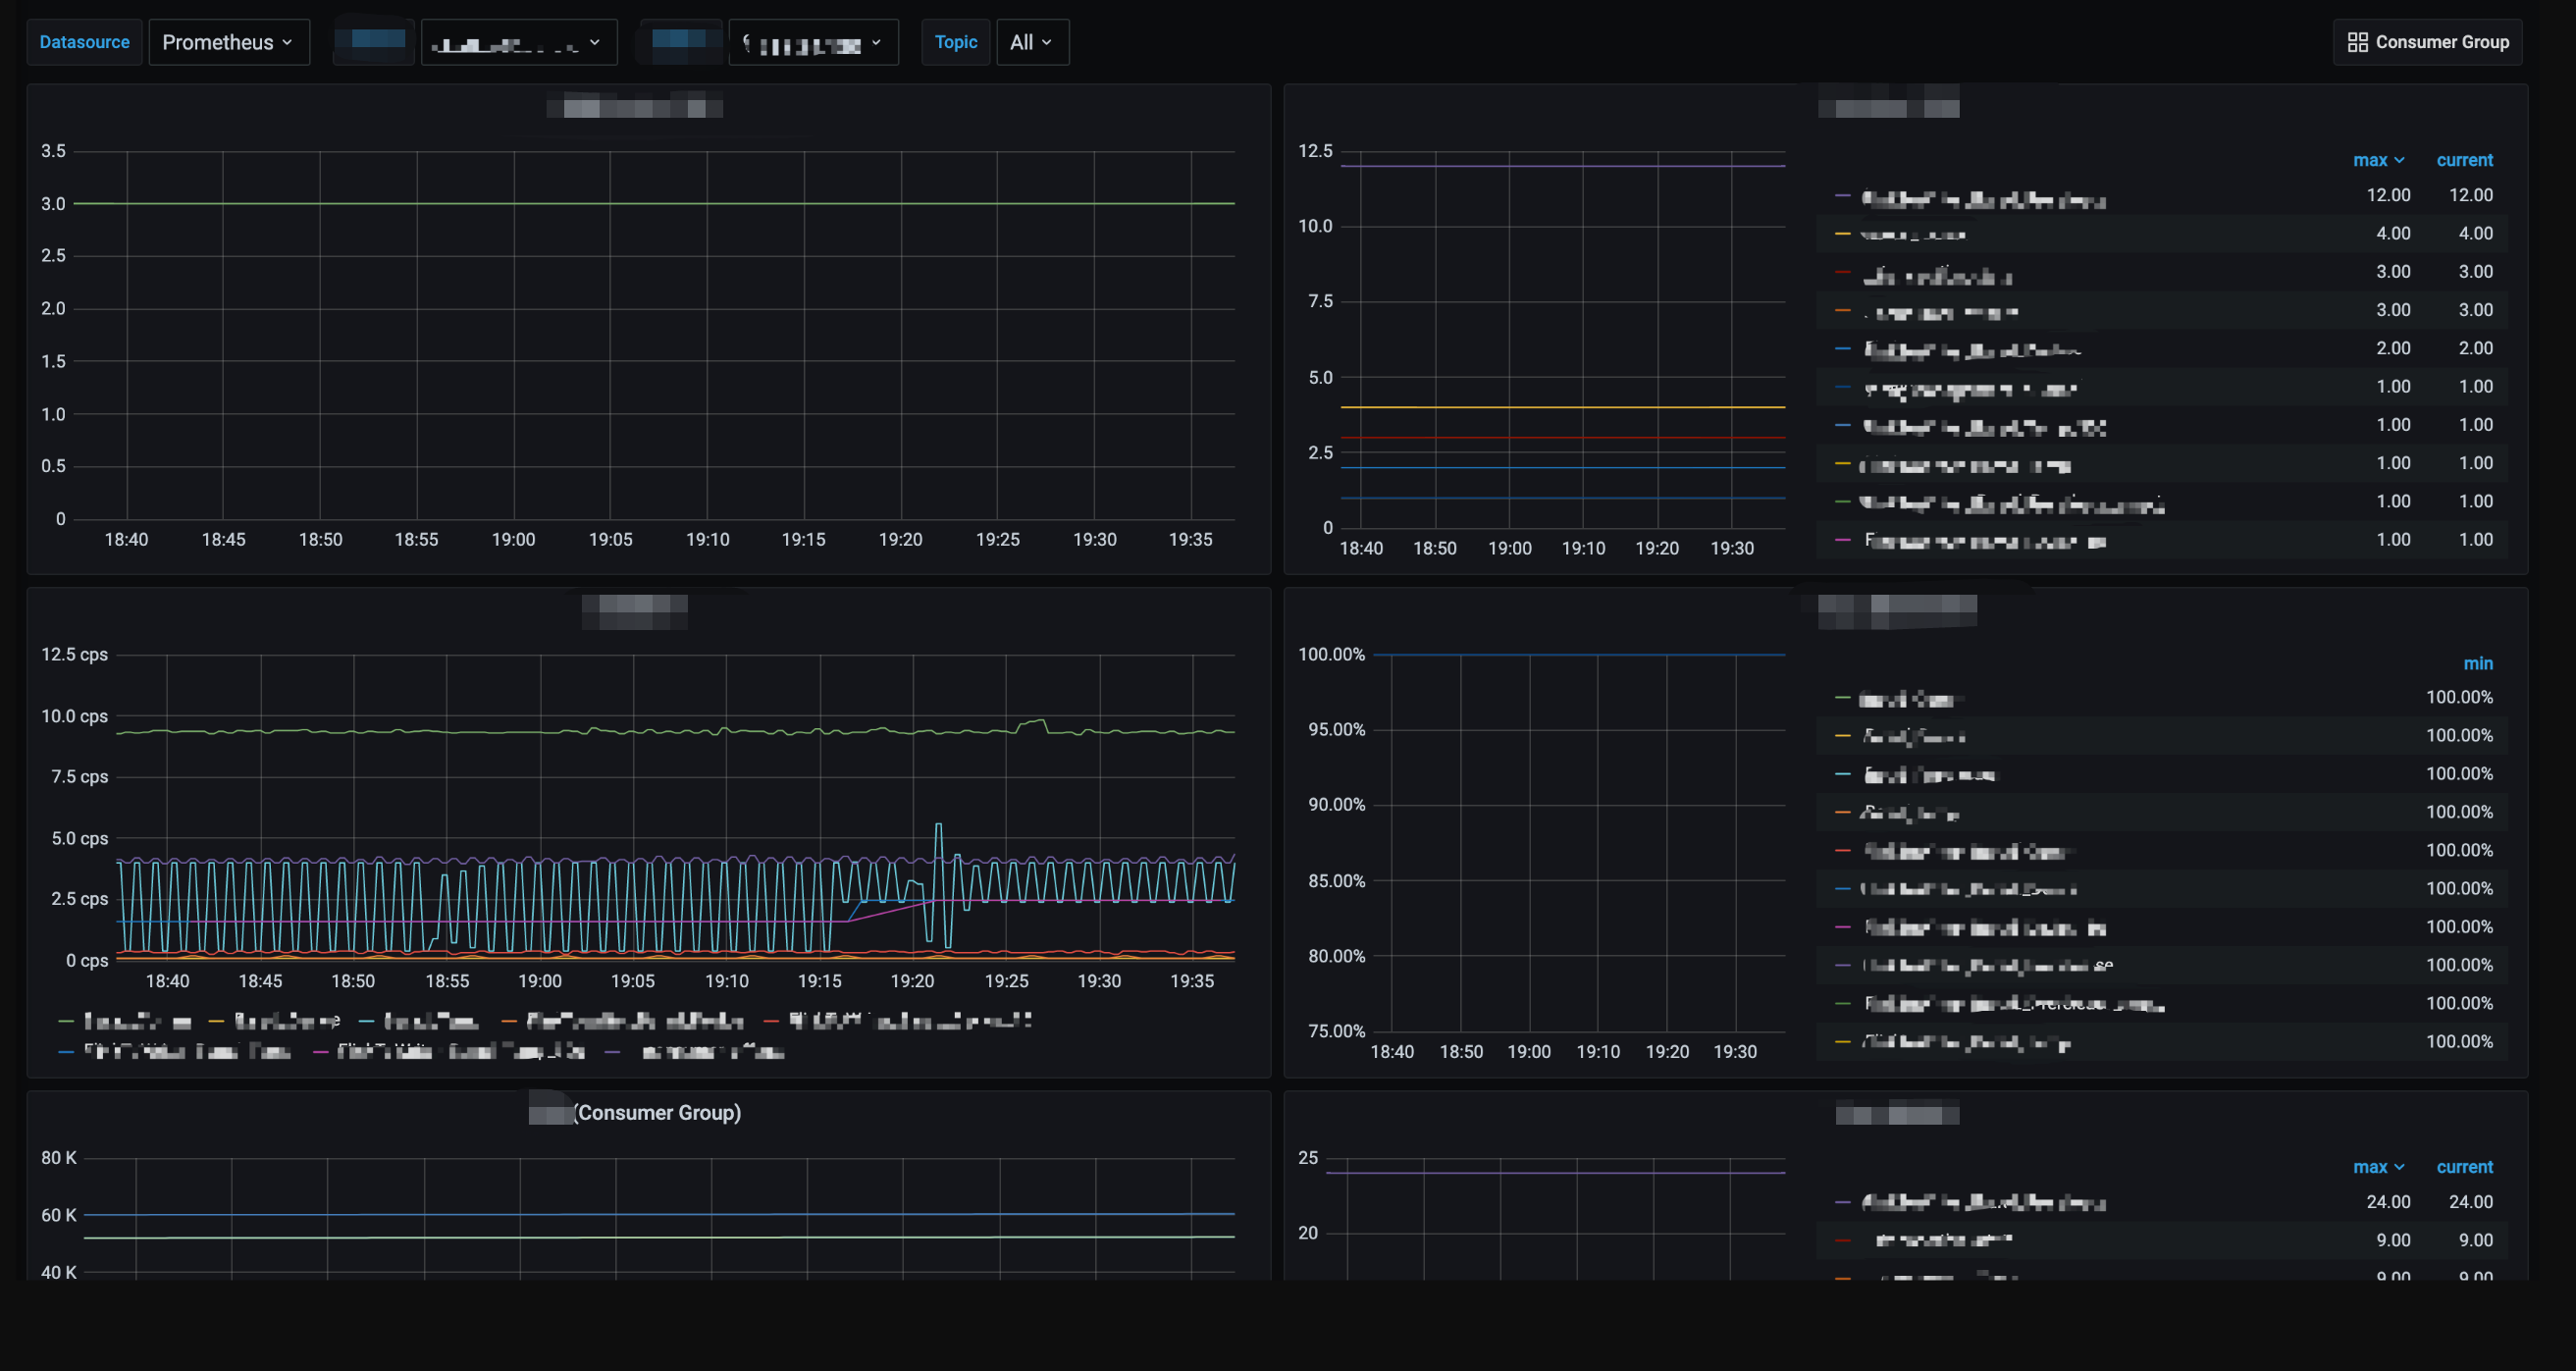
3. Select Integrated. In the integrated list, click the Grafana icon to automatically open the Kafka Monitoring Dashboard and view the monitoring data related to the instance, as shown below:
Configuring Alarm
1. Log in to the TMP console and select the corresponding Prometheus instance to go to the management page.
2. Select Alarm Management to add the corresponding alarm policies. For details, see Creating Alarm Rules.
Help and Support
Was this page helpful?
You can also Contact sales or Submit a Ticket for help.
Help us improve! Rate your documentation experience in 5 mins.
Feedback