A SQL statement query that takes more time than the specified value is referred to as a "slow query", and the corresponding statement is called a "slow query statement". The process where a database admin (DBA) analyzes slow query statements and finds out the reasons why slow queries occur is known as "slow query analysis".
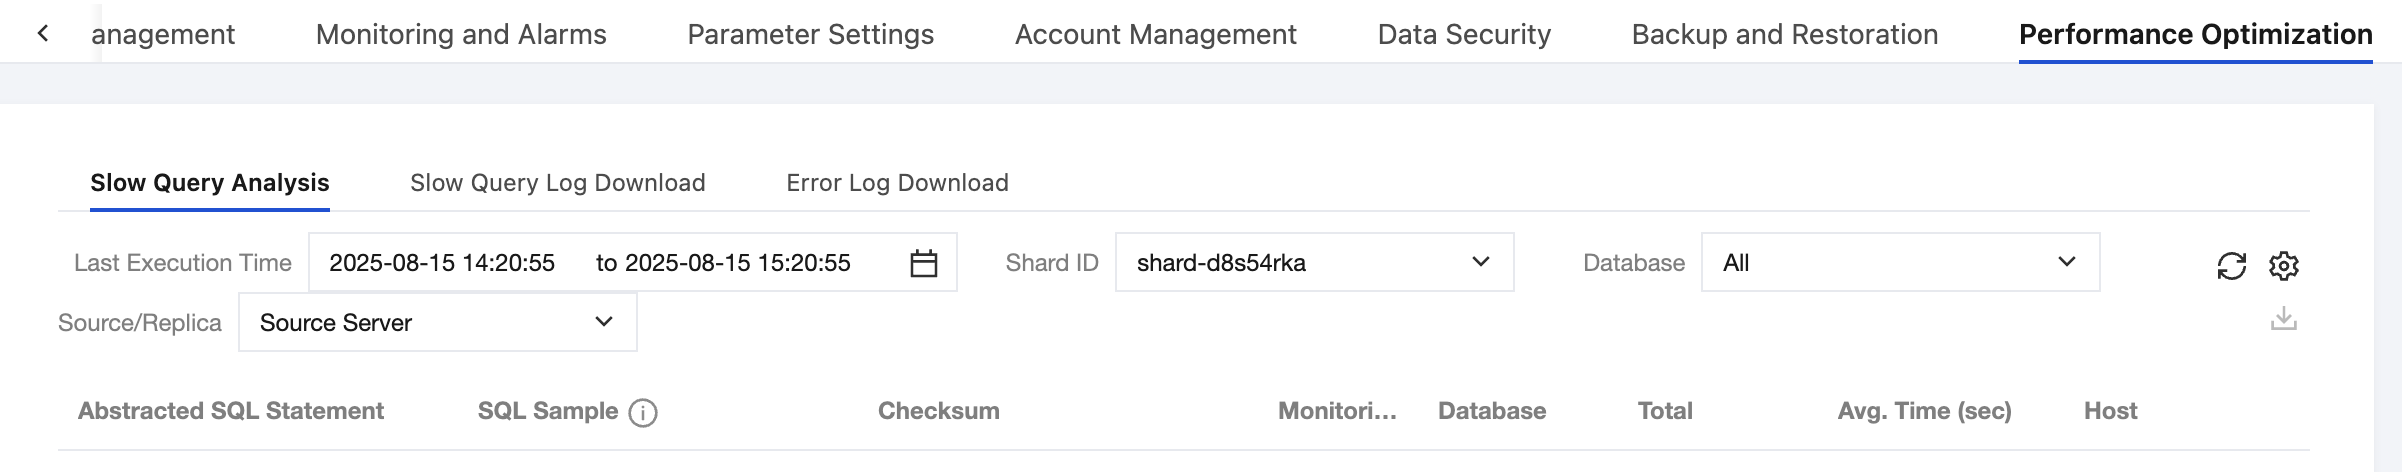
Log in to the TDSQL for MySQL console, click an instance ID in the instance list to enter the management page, and select the Performance Optimization > Slow Query Analysis tab to perform slow query analysis.
Note:
Click the top-right corner to customize displayed fields.
Currently, slow query analysis can only be performed and viewed in each shard separately.
Slow query threshold (long_query_time): One second by default, that is, only query statements executed for more than one second will be logged.
Analyzed data output delay: 1–5 minutes.
Logging duration: 30 days, depending on the backup and log settings.
Analysis list fields
Checksum (checksum): A sequence of digits used to identify a slow query statement (64-bit by default).
Abstracted SQL Statement (fingerprint): A slow query statement with user data hidden.
Database: The database in which the slow query statement was executed.
Account: The account under which a slow query statement occurs.
Last Execution Time (last_seen): The time when the slow query statement was last executed within the specified time range.
First Execution Time (first_seen): The time when the slow query statement was first executed within the specified time range.
Total (ts_cnt): The number of executions of the slow query statement within the specified time range.
Execution Proportion (%): The ratio of total executions of the slow query statement to the total executions of all slow query statements within the specified time range.
Total Time (query_time_sum): The total time consumed by the slow query statement within the specified time range.
Total Time (%): The ratio in percentage of the total time consumed by the slow query statement to the total time consumed by all slow query statements within the specified time range.
Average Time (query_time_avg): The average time is calculated by dividing the total time consumed by the slow query statement by the total number of executions of the slow query statement.
Min Time (query_time_min): The minimum among all execution time of the slow query statement.
Max Time (query_time_max): The maximum among all execution time of the slow query statement.
Total Lock Time (lock_time_sum): The total lock time of the slow query statement.
Total Lock Time Ratio: The ratio in percentage of the total lock time of the slow query statement to the total lock time of all slow query statements.
Average Lock Time (lock_time_avg): The average time calculated by dividing the total lock time of the slow query statement by the total number of locks of the slow query statement.
Min Lock Time (lock_time_min): The minimum among all lock time of the slow query statement.
Max Lock Time (lock_time_max): The maximum among all lock time of the slow query statement.
Sent Rows (Rows_sent_sum): The total number of data rows sent by the slow query statement.
Scanned Rows (Rows_examined_sum): The total number of data rows scanned by the slow query statement.
Host Address (Host): The host from which this slow query comes.
Monitoring: Click to view the analysis details of the SQL statement.