WebView, JsError, and Web Network Monitoring
Enabling Feature
Initialization requires enabling WebView, JsError, and Web network monitoring. Below is how to enable these three features based on Stable. The code is as follows:
QAPM.beginScene(QAPM.SCENE_ALL, QAPM.ModeStable | QAPM.ModeWebView | QAPM.ModeJsError| QAPM.ModeHTTPInWeb);
In addition, the following code needs to be configured:
WebView Monitoring requires enabling interaction with JavaScript. Call the following code during WebView initialization to enable:
WebSettings webSetting = webView.getSettings();webSetting.setJavaScriptEnabled(true);
After WebView initialization, add a call interface channel for Java and JS. The purpose is to allow the JS layer to obtain some configuration information from the Java layer:
webView.addJavascriptInterface(QAPMJavaScriptBridge.getInstance(),"QAPMAndroidJsBridge");
Add the following method in the WebView's shouldInterceptRequest code to intercept web-sdk and replace it with local SDK resources. Make sure to call the following code at the earliest position in this callback.
If it is x5, use the following code:
@Overridepublicpublic WebResourceResponse shouldInterceptRequest(WebView webView, String s) {???Object response = QAPMJavaScriptBridge.getInstance().shouldInterceptRequestWithX5(s);???if (response != null) {???????return (WebResourceResponse)response;?????? }return super.shouldInterceptRequest(webView, s);??? }
If it is Native WebView, use the following code:
@Overridepublicpublic WebResourceResponse shouldInterceptRequest(WebView webView, String s) {???WebResourceResponse response = QAPMJavaScriptBridge.getInstance().shouldInterceptRequest(s);???if (response != null) {???????return response;?????? }return super.shouldInterceptRequest(webView, s);??? }
Add the following method in the WebView's onPageFinished code to inject JS script:
webView.setWebViewClient(new WebViewClient(){??? @Override??? public void onPageFinished(WebView view, String url) {??????? super.onPageFinished(view, url);??????? QAPMJavaScriptBridge.getInstance().initFileJS(view);??? }});
Verifying Whether the Feature Is Working Properly
Native WebView, JsError monitoring:
1. Include the following code in the code (for remote debugging purposes).
WebView.setWebContentsDebuggingEnabled(true);
2. Open Google Chrome, and enter
chrome://inspect in the address bar. In the devices that appear, click inspect.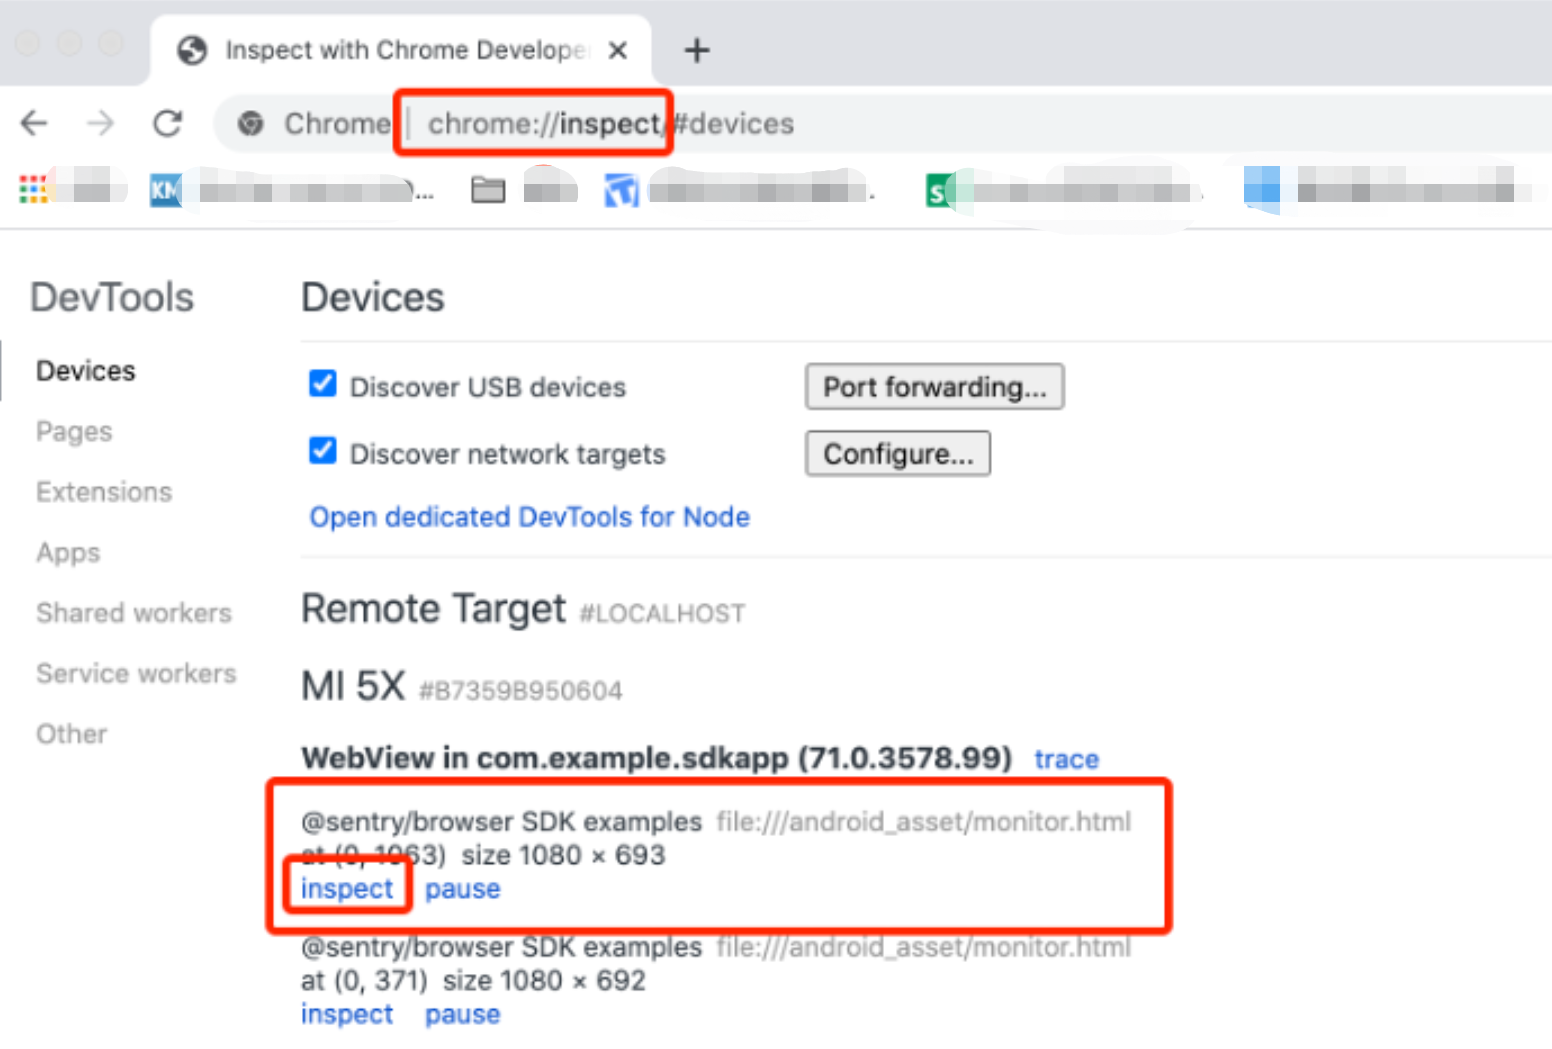
3. Find the Console module query log. If
web start success, vxxx is displayed, it indicates the WebSDK inject succeeded.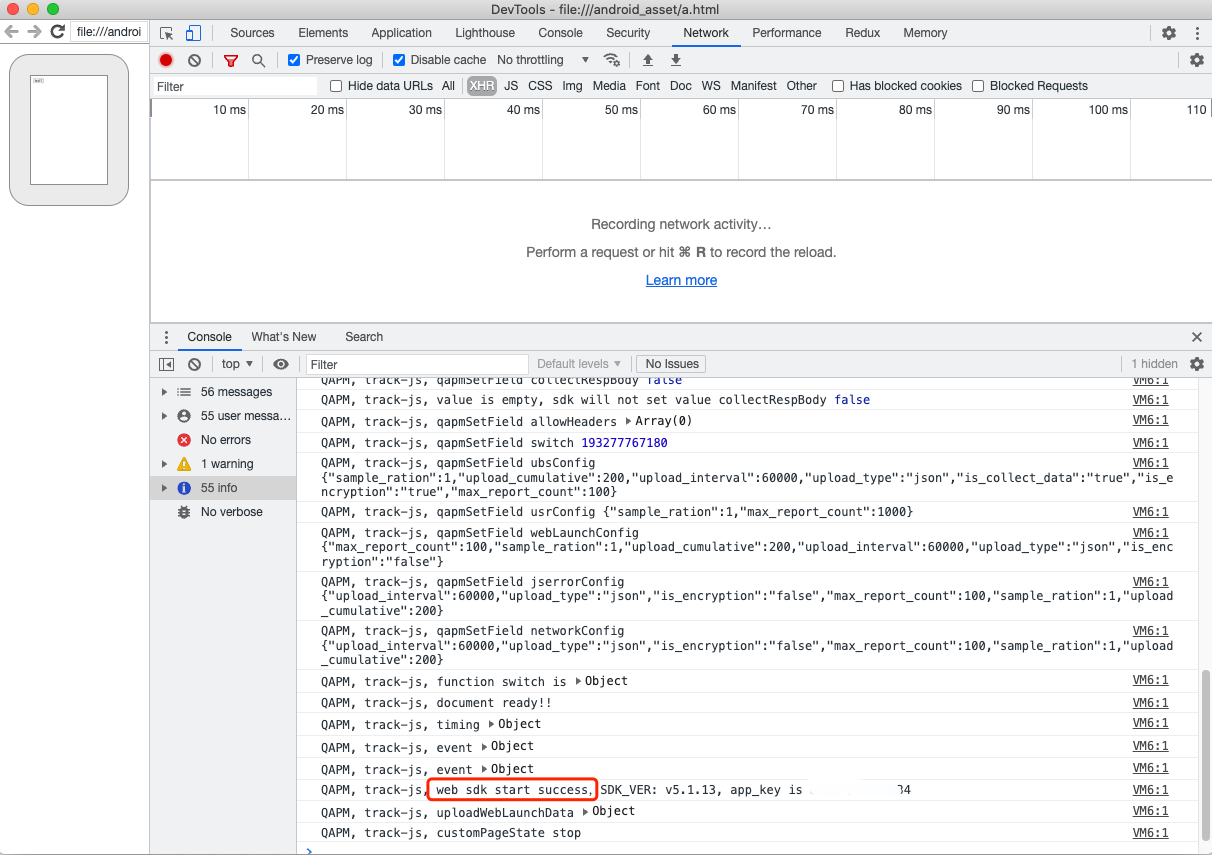
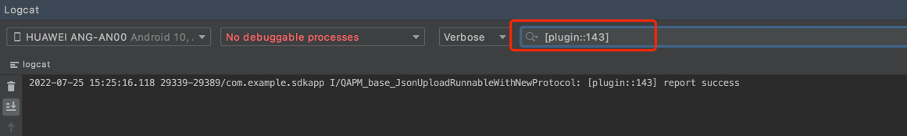
4. Check whether all features are reporting normally. Consider JsError reporting as an example, as follows:
Retrieval tag: [plugin::143].
The occurrence of a JsError, such as the following log message, indicates successful reporting of JsError data.
The other retrieval tags are as follows:
Page load: plugin::141 (reported immediately after each Web page load is complete).
Network request: plugin::154 (reported when there are network errors and slow requests).
Note:
1. To check whether WebView monitoring is normal, examine through browsers like Chrome for debugging.
2. Page load is reported in the Issue Case Details only if the page load duration exceeds 3.5s.
3. Network requests are reported in cases of network errors and slow networks.
피드백