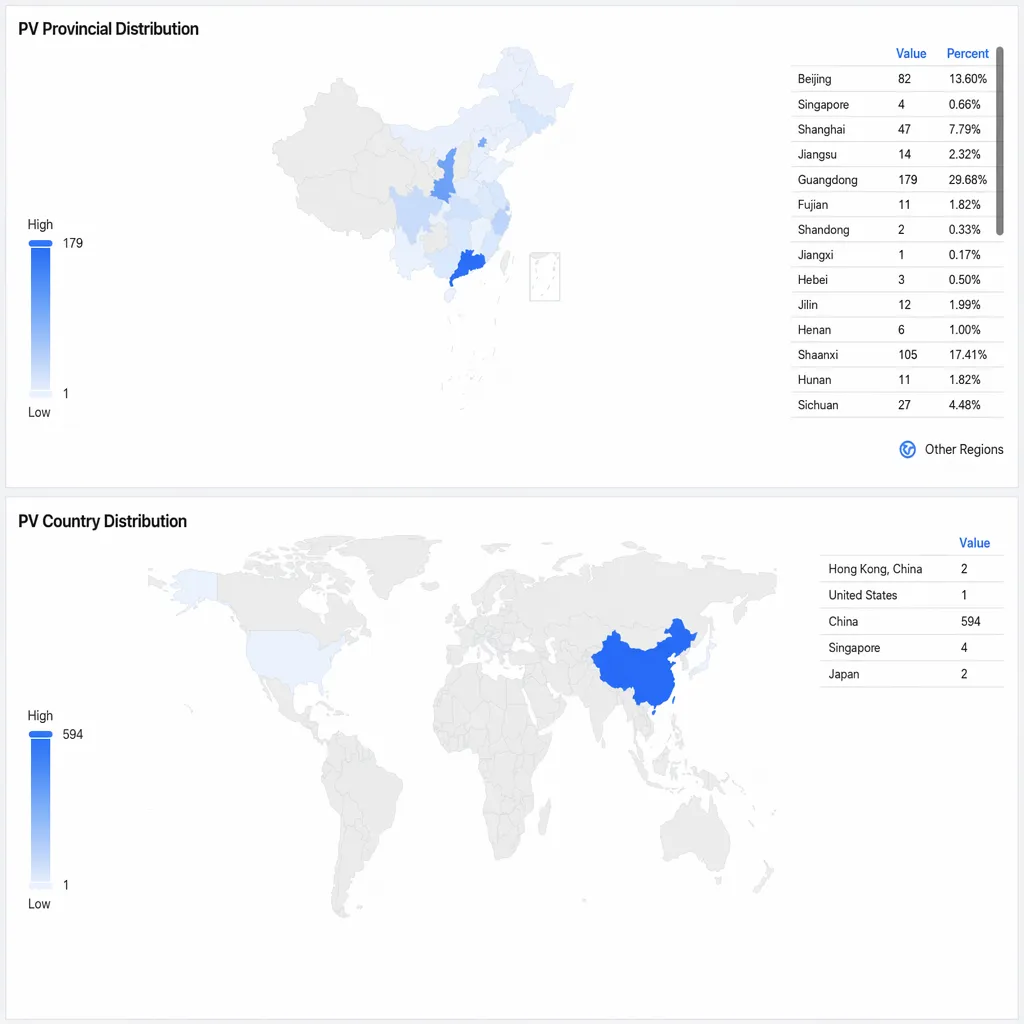
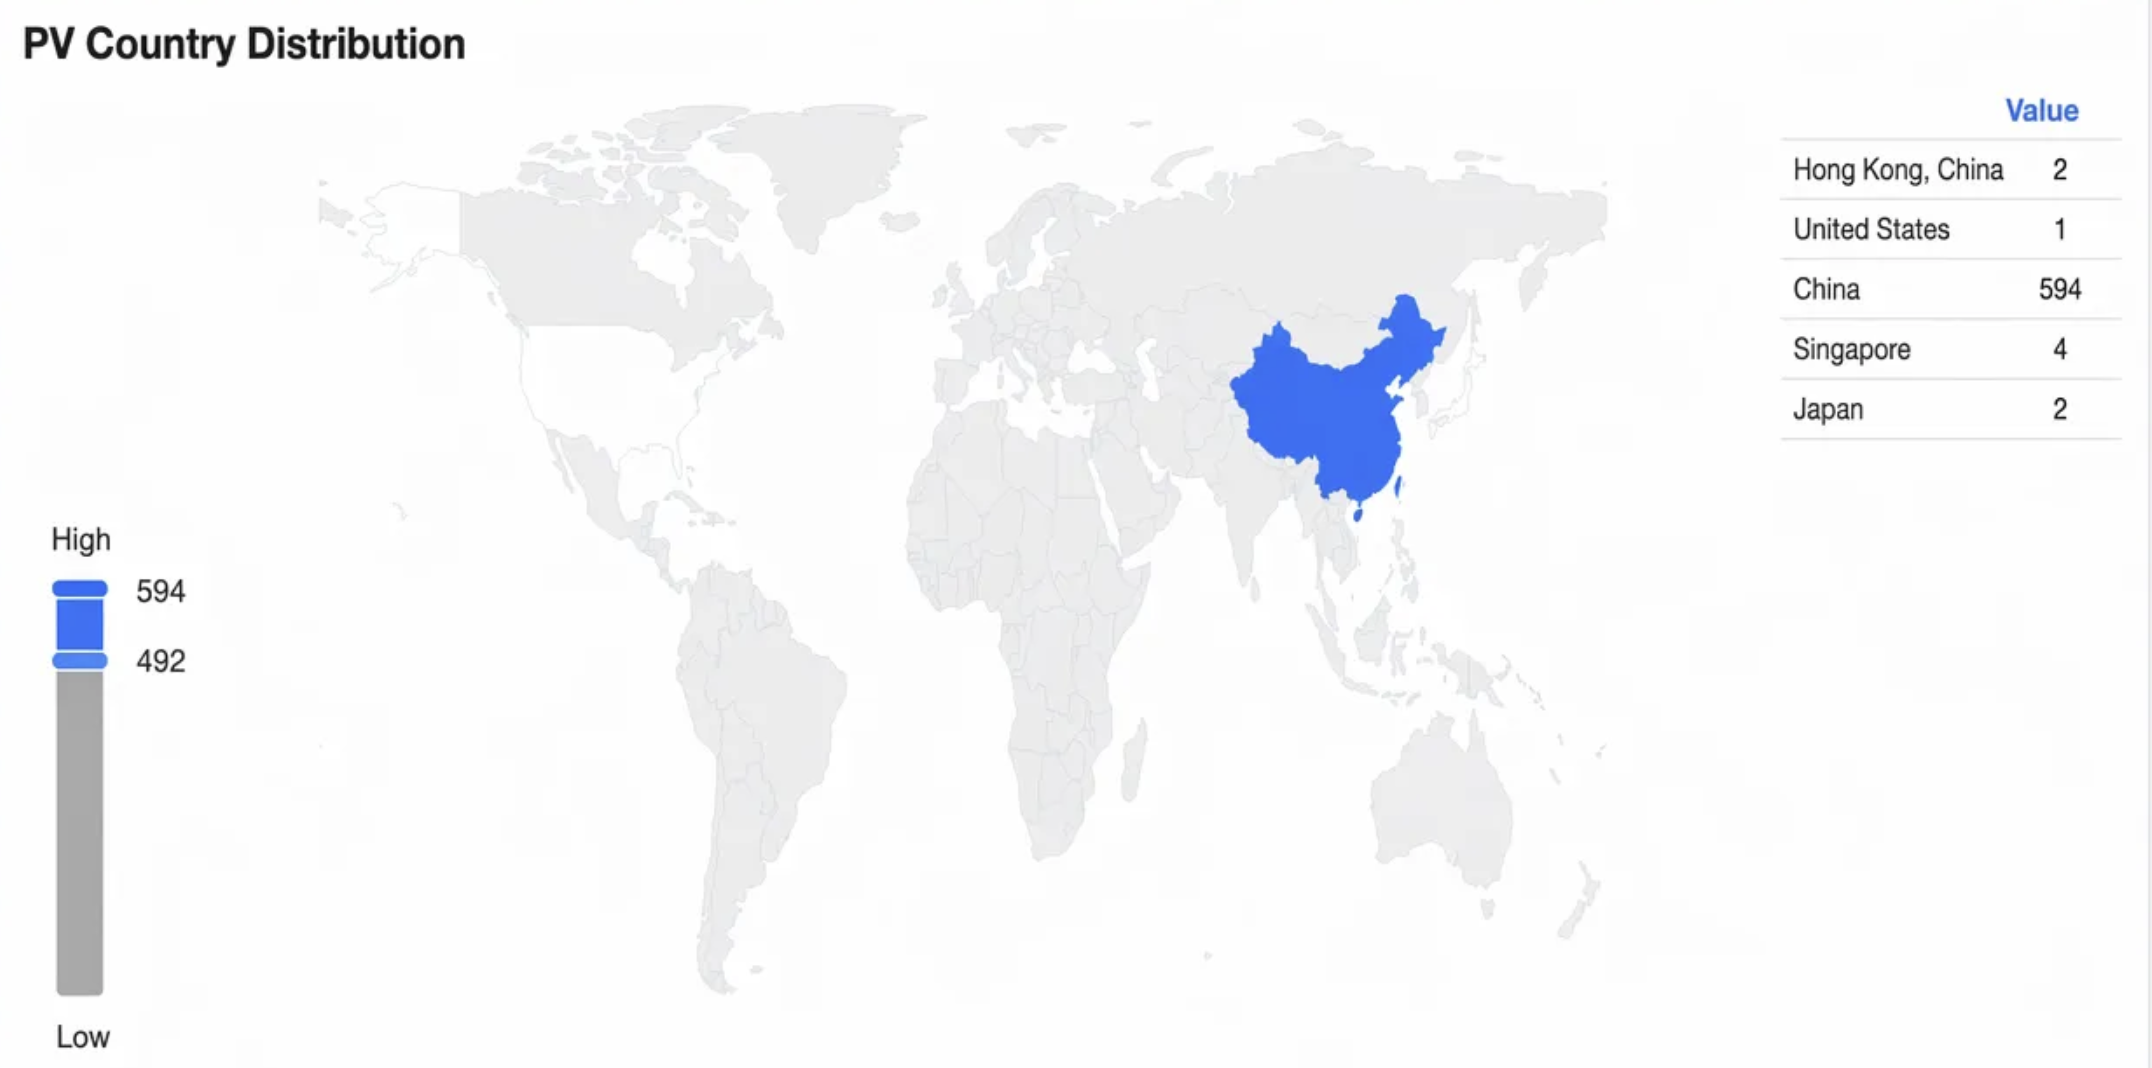
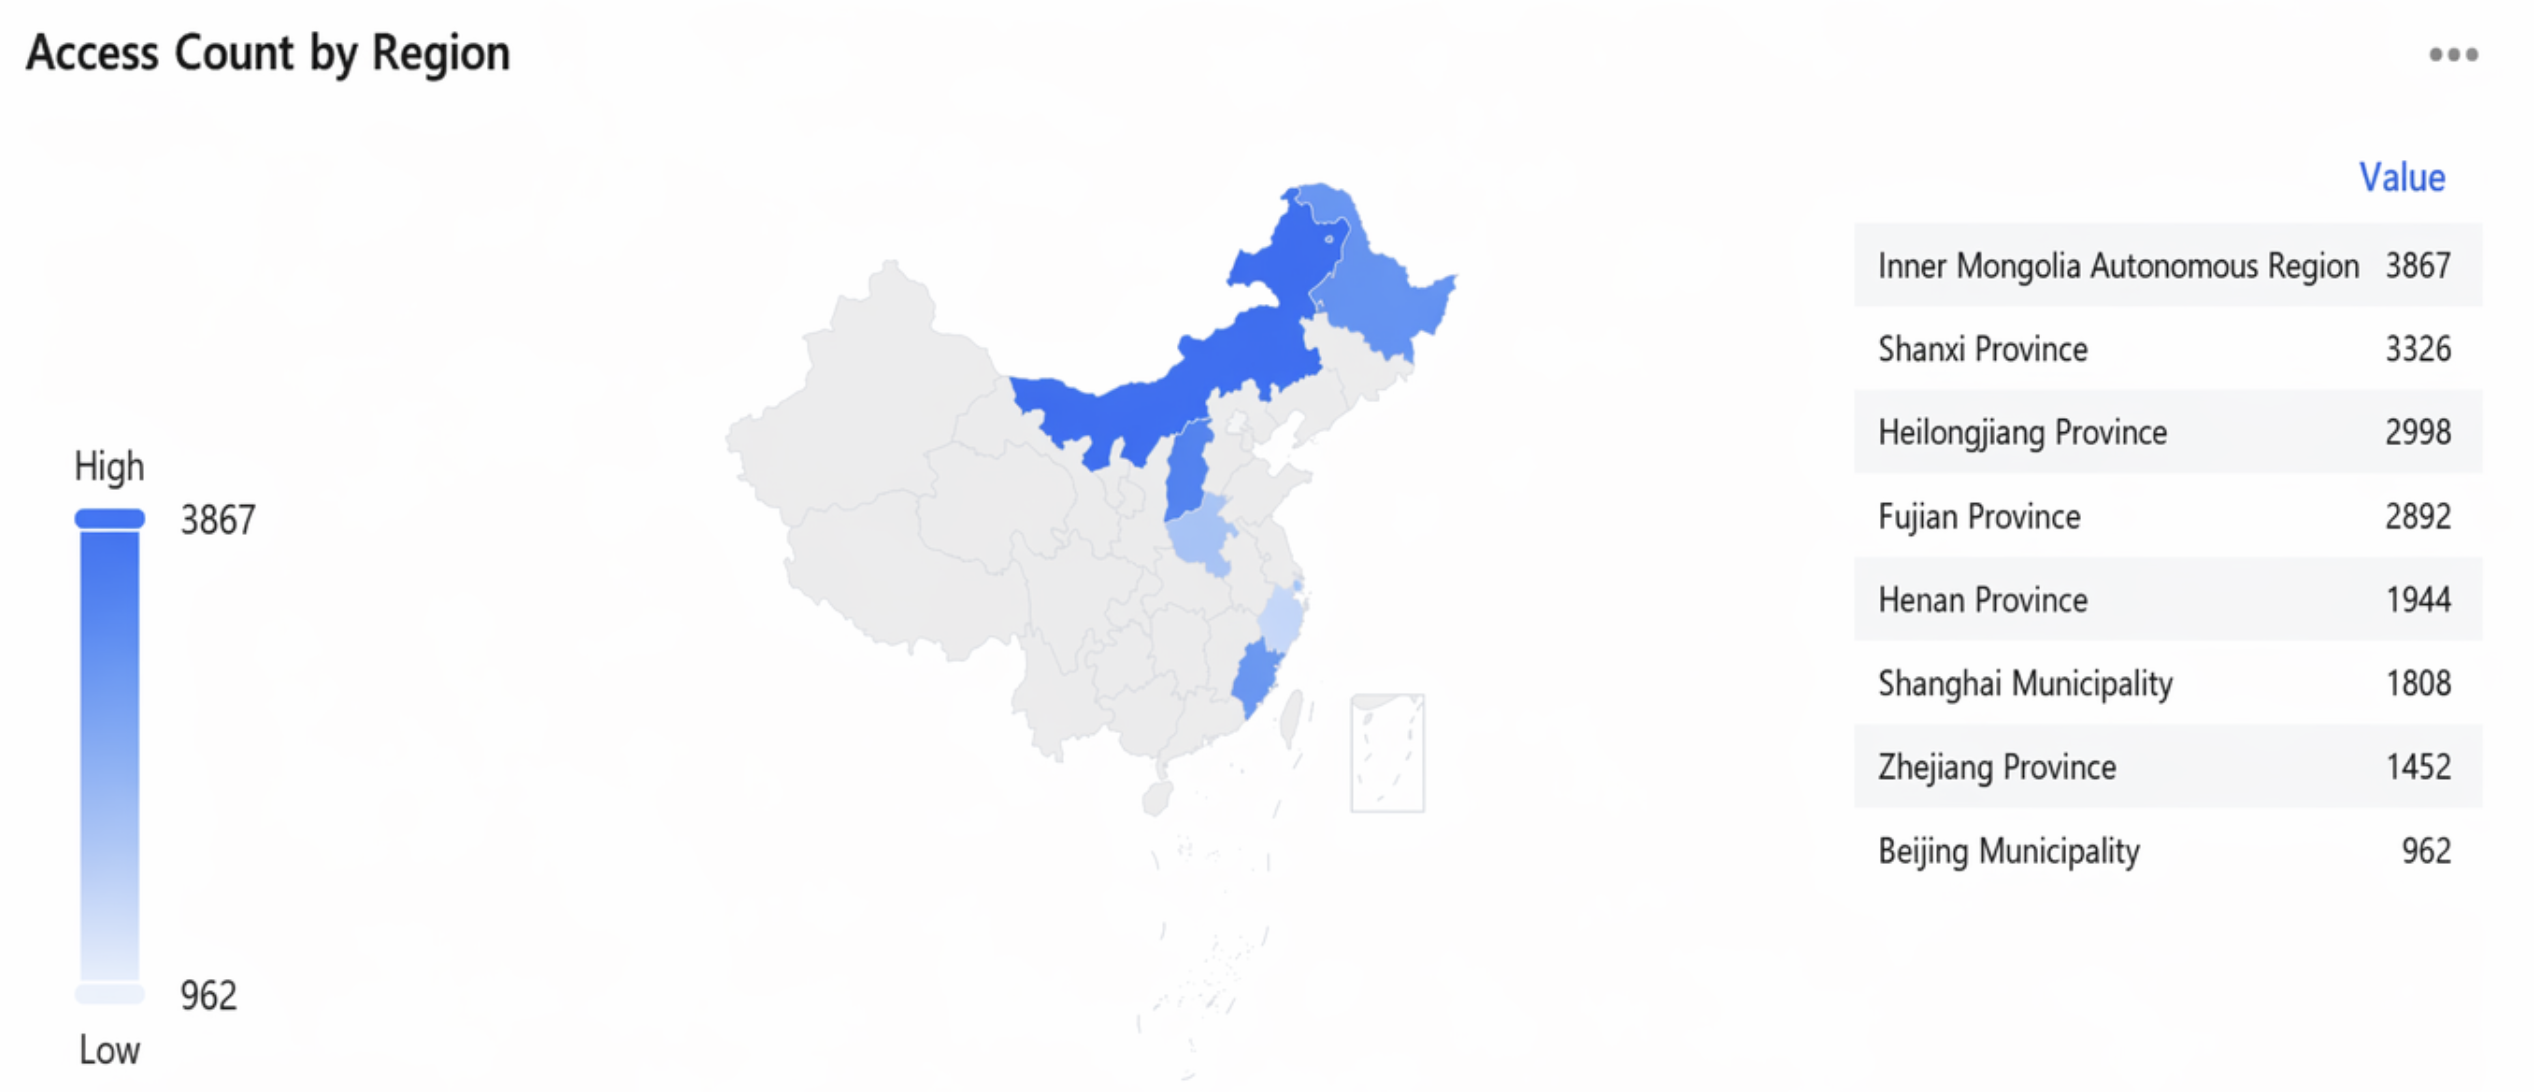
A map shows the geographic location of data through the position of graphics. It is generally used to display the distribution of data in different geographic locations. It is suitable for geographic statistics scenarios, such as the geographic distribution of attacker IPs.
Operation Steps
1. Log in to the CLS console, choose Dashboard > Dashboard List, and then select the dashboard you want to view.
2. Select the target dashboard to go to its view page, click Edit, and then enter the edit page.
3. Click Add Chart to create a new chart, select Custom Chart or Quick Chart, and then set the chart type to Map.
4. Configure the chart as needed.
General configuration
Configuration Item
Description
Basic Info
Chart Name: Set the display name of the chart, which can be left empty.
Description: Set the description information of the chart.
Chart Style
Location: Set the region range displayed on the map. You can select China map or world map. It is set to Auto by default, in which case the map is automatically adapted to the region information contained in the data.
Tag: When enabled, it displays administrative region names.
Legend
Set the chart legends. You can control the legend styles and positions and add comparison data to legends.
Numeric Format
Set the unit for all metric-type fields within the chart. For details, see Unit Configuration.
Statistical Analysis Fields
For a map, you must select the dimension field and metric field. When data mismatches occur, you need to manually select the statistical analysis field.
Configuration Item
Description
Dimension field
A field containing geographic information. Country/province names in English, country codes, and province codes are currently supported. By default, a field of the string data type is selected. If no such field is available, you must manually specify a field.
Metric field
Numerical field. By default, fields with the number data type are selected. If no number field exists, you must manually specify a field.
Map example:
Chart Operations
Filter Regions by Value: Drag the value range in the lower-left corner of the map to display only the regions within the specified interval.
Statement Example
Collect statistics of the geographical distribution of user visits.
*|select ip_to_province(client_ip)as province ,count(*)as"number_of_visits"groupby province orderby"number_of_visits"desclimit1000
Collect statistics of the geographical distribution of user visits (world).
*|select ip_to_country(client_ip)as country ,count(*)as"number_of_visits"groupby country orderby"number_of_visits"desclimit1000