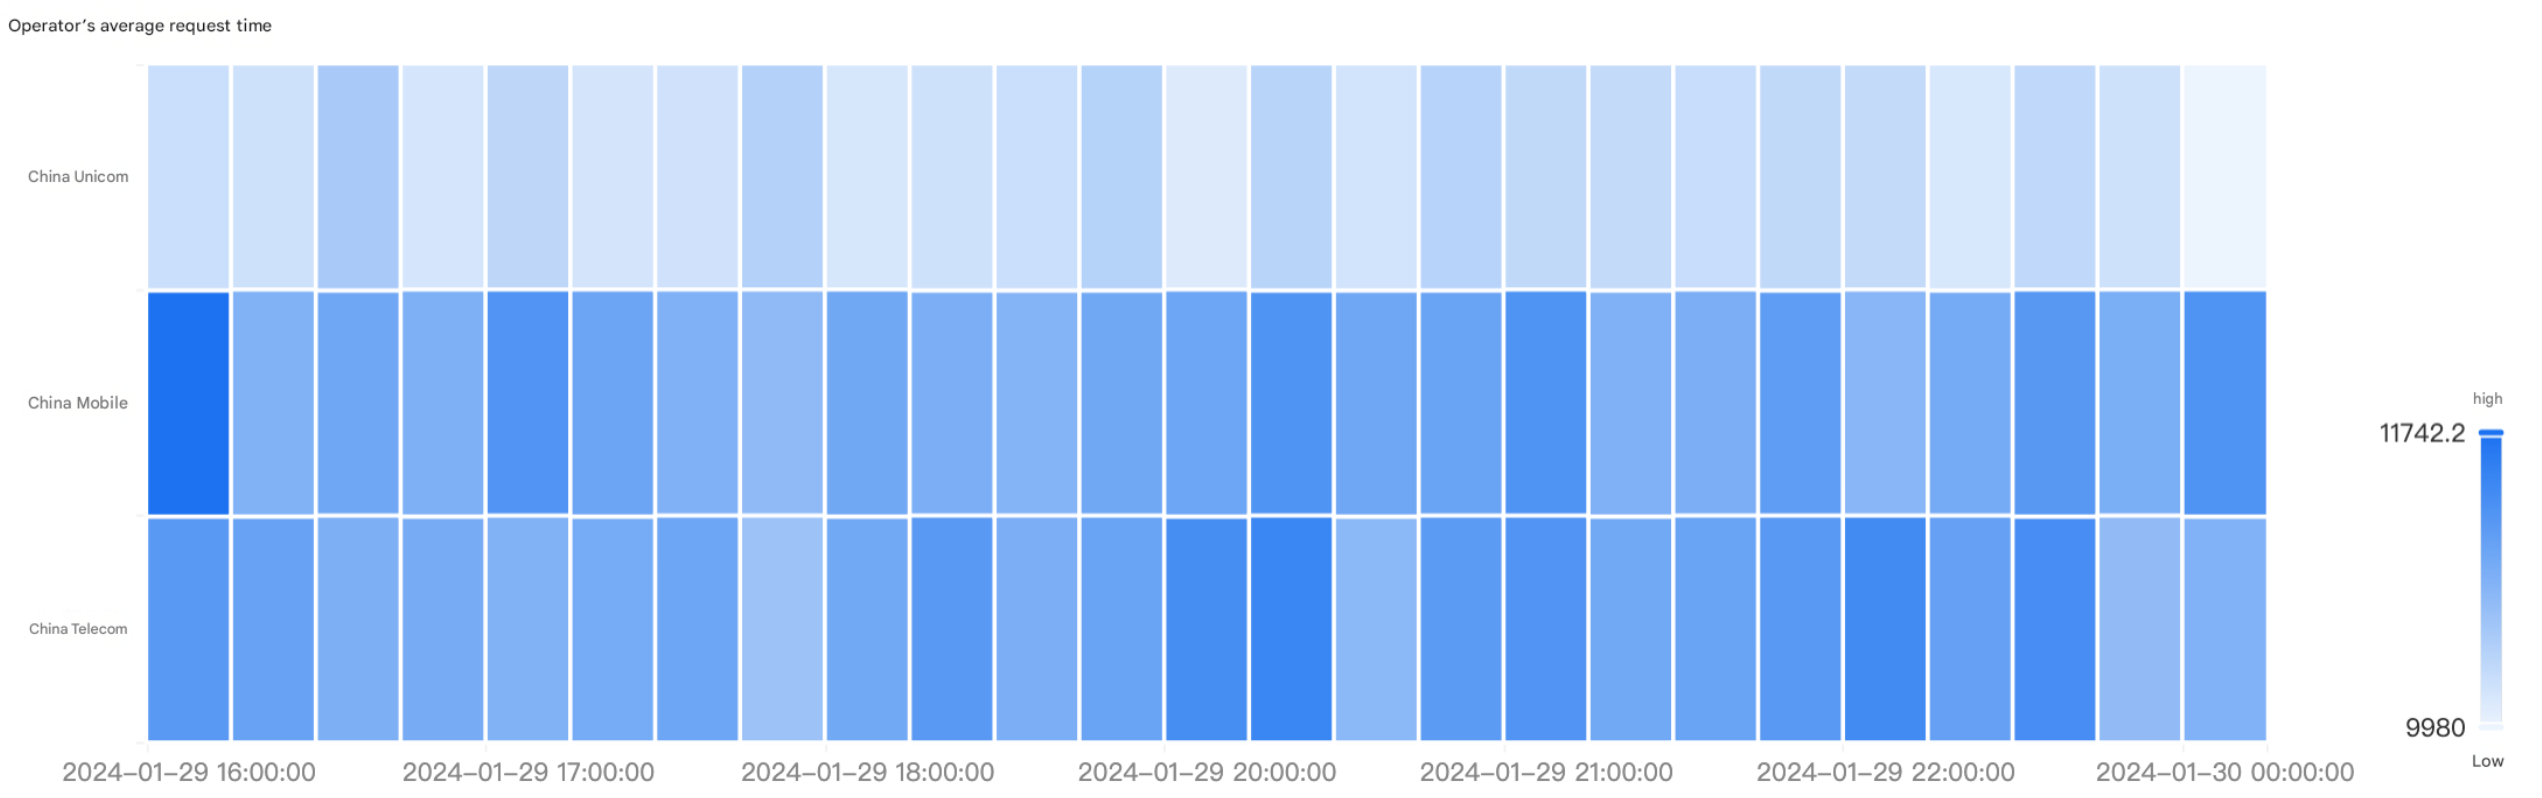
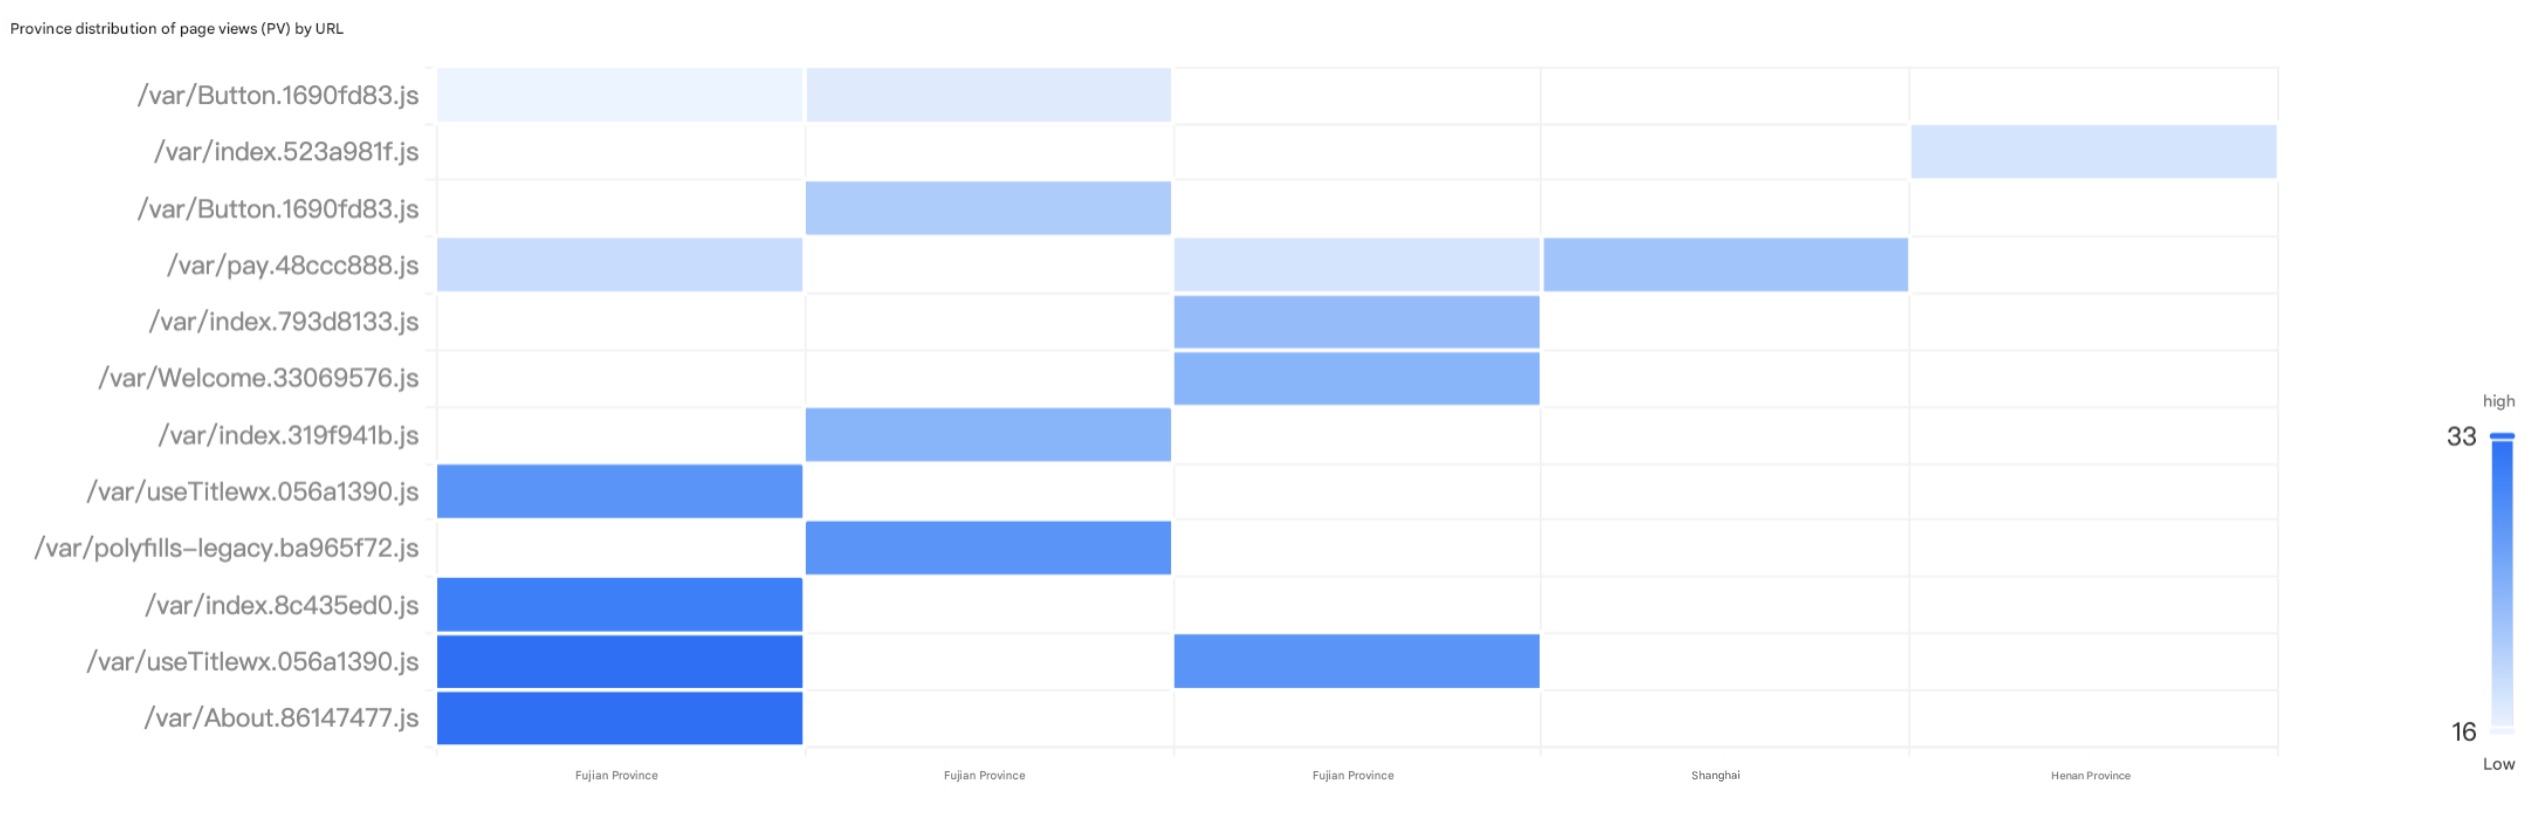
Heatmaps display statistical charts by coloring the blocks. For statistical indicators, higher values are represented by darker colors and lower values are represented by lighter colors. Heatmaps are suitable for viewing the overall situation, detecting anomalies, displaying differences among multiple variables, and checking whether there is any correlation between them.
Directions
1. Log in to the CLS console, click Dashboard > Dashboard List, select the dashboard you want to view.
2. Click Add Chart to create a chart, and select Heat Map as the chart type.
3. Configure the chart according to needs.
Chart Configuration
General configuration
Configuration Item
Description
Basic Info
Chart Name: Set the display name of the table, which can be left empty.
Coordinate axis
X-axis Display: Show/hide X-axis.
Y-axis Position: Configure the display position of the Y-axis.
Legend
Show or hide the legend.
Standard configuration
Set the field units for all metric types within the chart. For details, see Unit Configuration.
Interaction event
Support clicking the numbers in the chart to trigger interactive events, such as jumping to the set URL address, opening the search analysis page, opening the dashboard page, adding filter conditions, etc. For details, see Interaction Event.
Statistical Analysis Field
Define the chart fields and support manually specifying the fields corresponding to the chart content with default automatic adaptation.
Configuration Item
Description
X-axis Field
Select the field corresponding to the X-axis of the heatmap. By default, a field of the string data type is selected. If no such field is available, you must manually specify a field.
Y-axis Field
Select the field corresponding to the Y-axis of the heatmap. By default, a field of the string data type is selected. If no such field is available, you must manually specify a field.
Metric Field
Numerical field. Select the field corresponding to the heatmap tile. By default, a field of the number data type is selected. If no such field is available, you must manually specify a field.
Heatmap configuration
Configuration Item
Description
Chart Style
Counts: Setting the display and hide of heatmap block value tags. The value is hidden by default.
Sample Statement
Statistics of average request delays from ISPs on the timestamp: