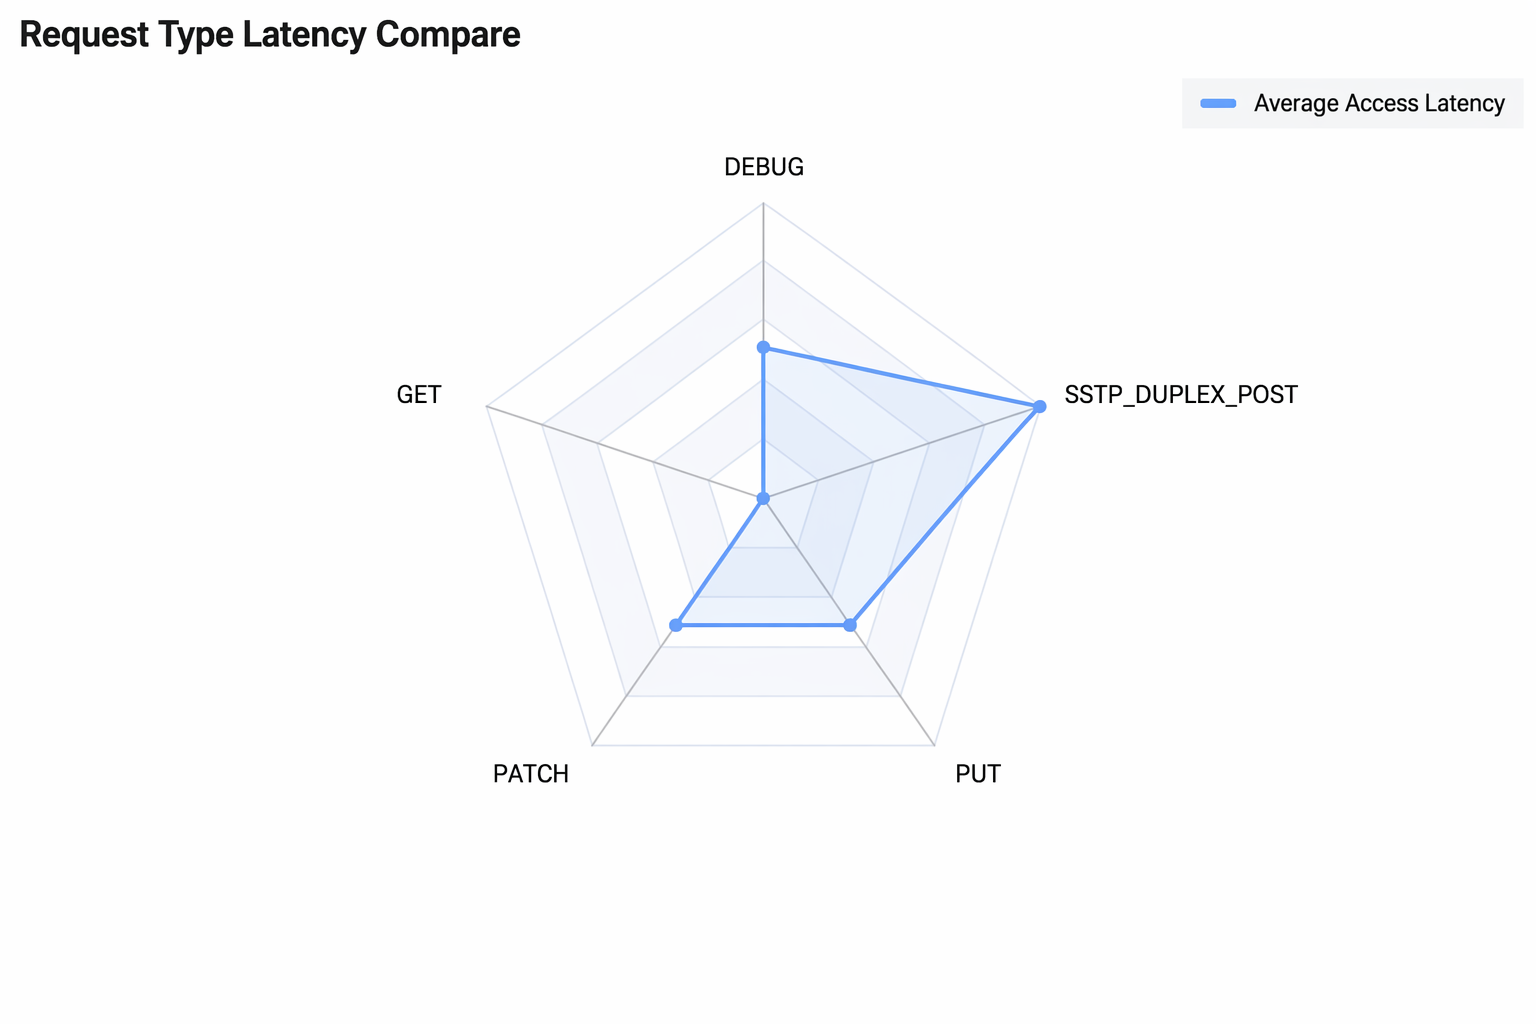
A radar chart is a chart used for visualizing and comparing multiple variables. It uses multiple axes radiating from a central point to represent different data categories or metrics. Data values are represented by points on each axis, and these points are connected to form a polygon, thereby displaying relationships and trends in the data.
Operation Steps
1. Log in to the Cloud Log Service (CLS) console, choose Dashboard > Dashboard List, and select the dashboard you want to view.
2. Click Add Chart, create a chart, and select Radar Chart as the type.
3. Configure the chart as needed.
General Configuration
Configuration Item
Description
Basic Info
Chart name: Set the display name of the chart, which can be empty.
Legend
Set the legend content of the chart to control the style and position of the legend. Comparison data can also be added to the legend.
Floating Prompt
Set the content style of the bubble prompt triggered by mouse hover.
Standard Configuration
Set the unit for all metric-type fields in the chart. For details, see Unit Configuration.
Interaction event
Click a data point in the chart to trigger interaction events, such as redirecting to a set URL, opening the search and analysis page, opening the dashboard page, or adding filter conditions. For details, see Interaction Events.
Statistical Analysis Fields
Dimension Field and Metric Field should be selected for a radar chart. In case of data mismatch, you need to manually select the statistical analysis fields.
Configuration Item
Description
Dimension Fields
Classification field. Each axis corresponds to a field value. Fields with a data type of string are selected by default. If no string-type field exists, you need to manually select the specified field.
Metric Fields
Numerical field. Fields with a data type of number are selected by default. If no number type field exists, you need to manually select the specified field.
Radar Chart Configuration
Configuration Item
Description
Chart Style
Radar Chart Type: Set the display type of the radar chart.
Metric Value Display: Control the display/hide of metric value tags.
Dimension Tag Display: Control the display/hide of dimension value tags.
Maximum Number of Displayed Dimensions: Control the number of dimensions displayed.
Line width: Control the thickness of lines.
Opacity: Control the opacity of filled areas.
Points: Display data points. No point is displayed if no data exists.
Point size: Control the size of data points on the line. Set it to 0 to hide points.
Statement Example
Compare statistics of request latency by request type: