The full instance monitoring page gives you an overview of the database monitoring metrics of all instances. The unified monitoring view displays the horizontal view of single monitoring metrics of all instances, allowing you to view and detect database exceptions and providing you with a new macro view on monitoring information.
Note:
Currently, full instance monitoring is supported only for TencentDB for MySQL (excluding basic single-node instances), TDSQL-C for MySQL, TencentDB for MariaDB, Tencent Cloud Database TDSQL for MySQL, Tencent Cloud Distributed Cache, TencentDB for MongoDB, and self-built MySQL.
2. In the left sidebar, select Monitoring & Alarm > Intelligent Monitoring.
3. Select the database type at the top.
4. Select the Full Instance Monitoring tab.
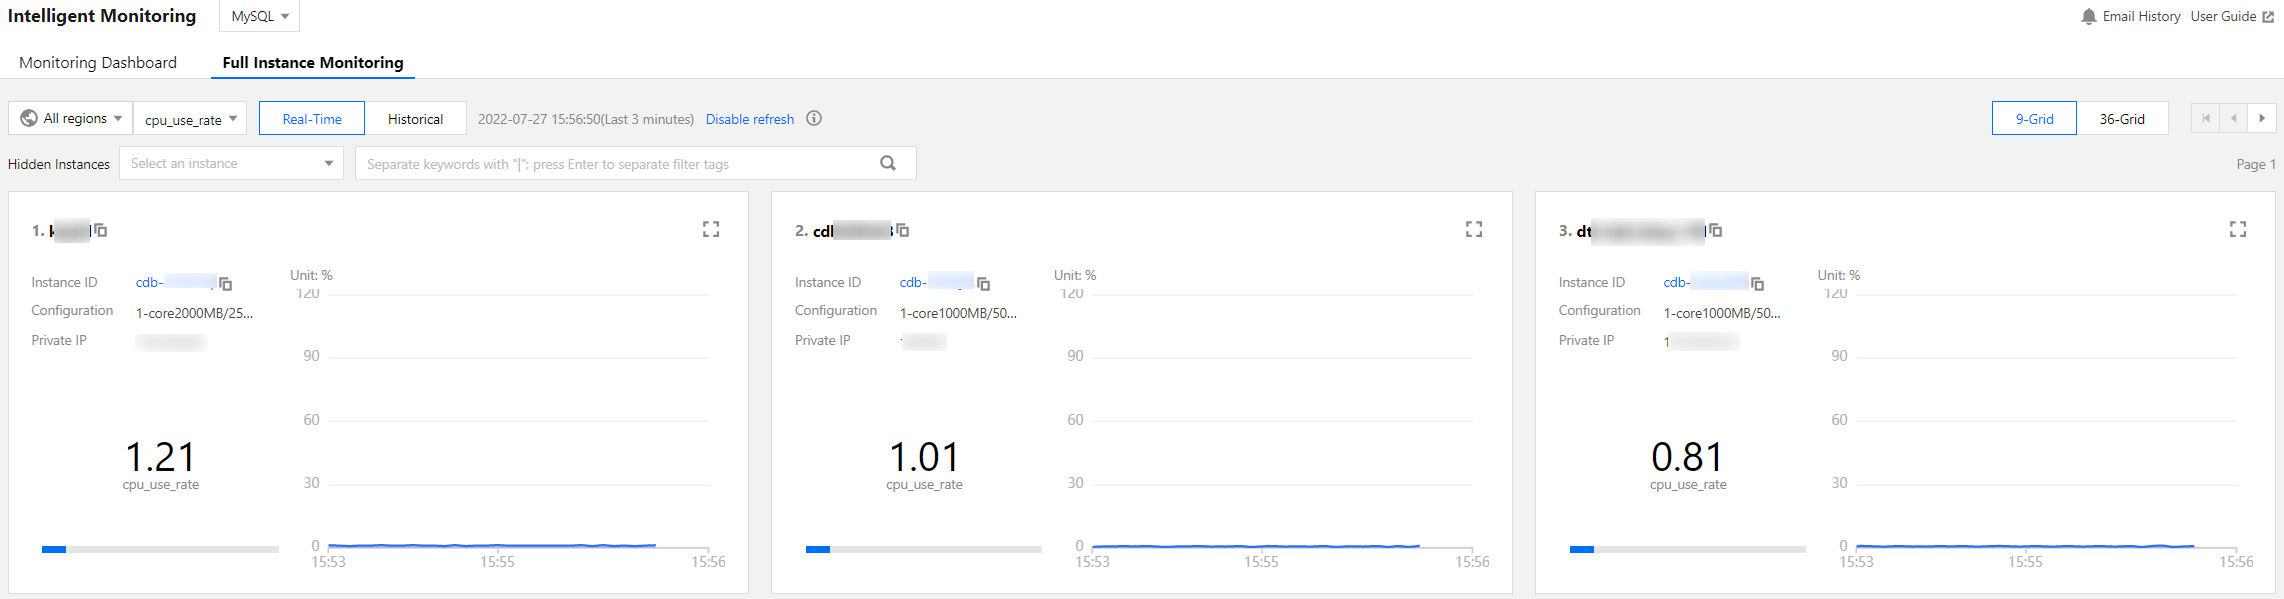
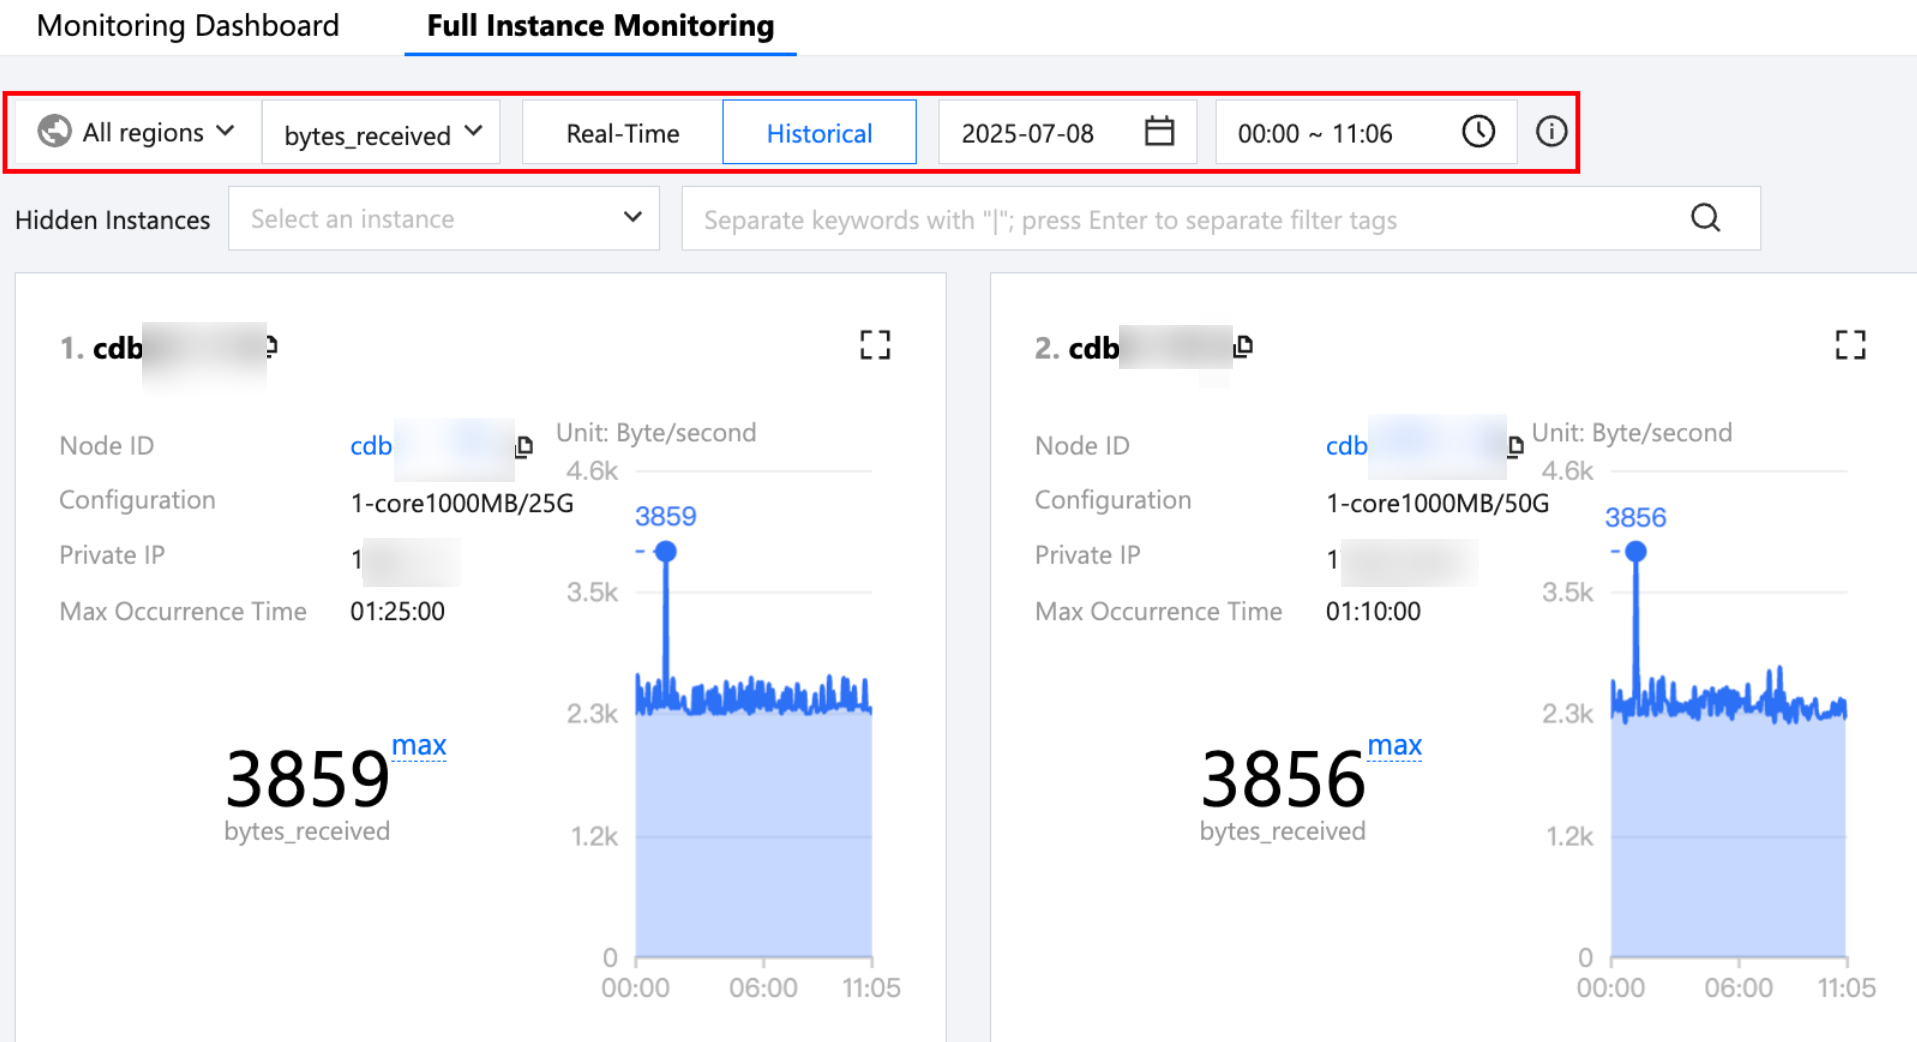
5. Select the region, desired monitoring metrics, and whether to view real-time or historical data.
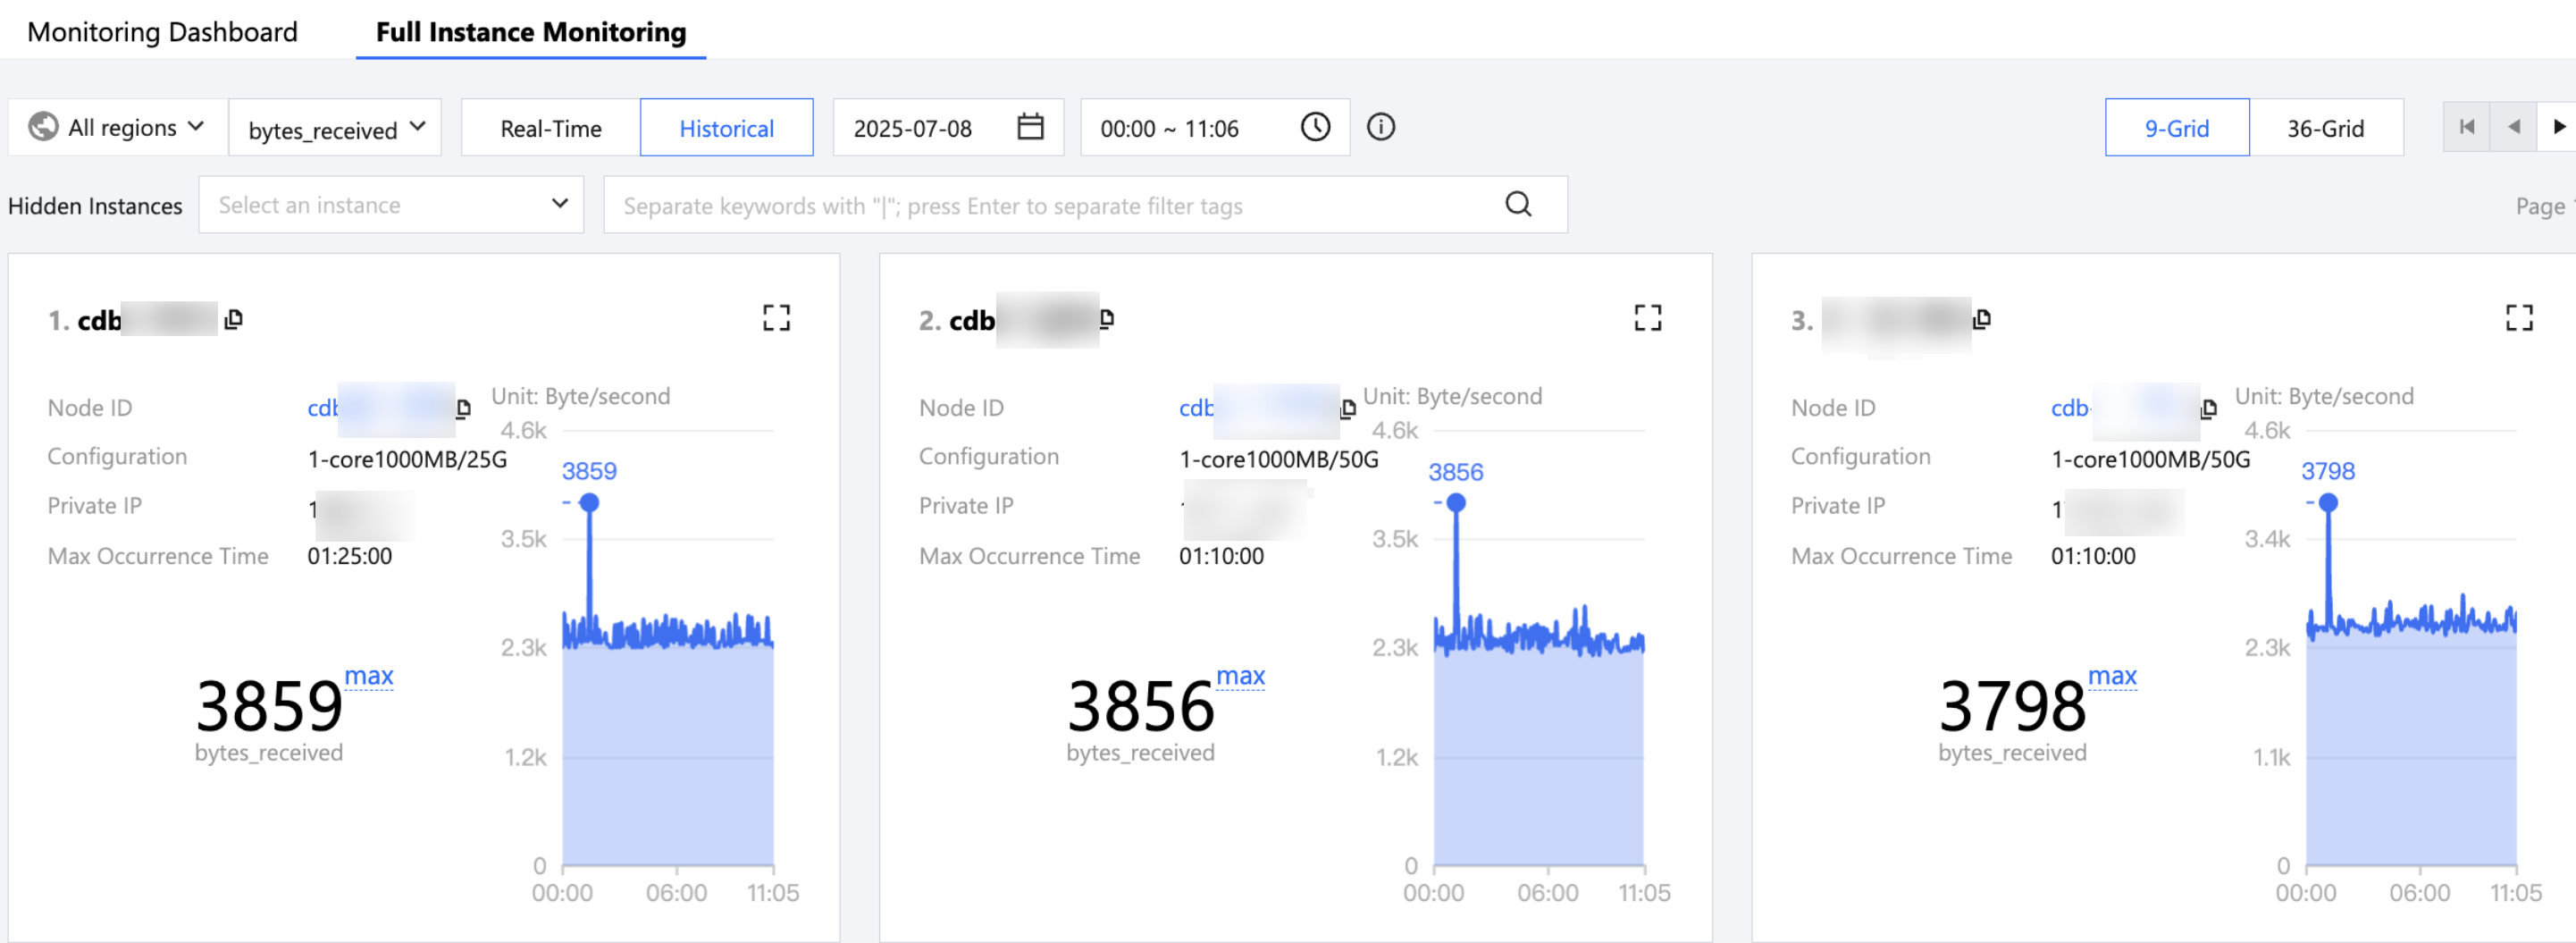
For historical monitoring, the MAX value of the selected metric and its occurrence time in the selected time period will be displayed.
6. View the monitoring information of an instance.
View the full instance monitoring dashboard: Without filtering or hiding instances, you can view the monitoring information of all instances.
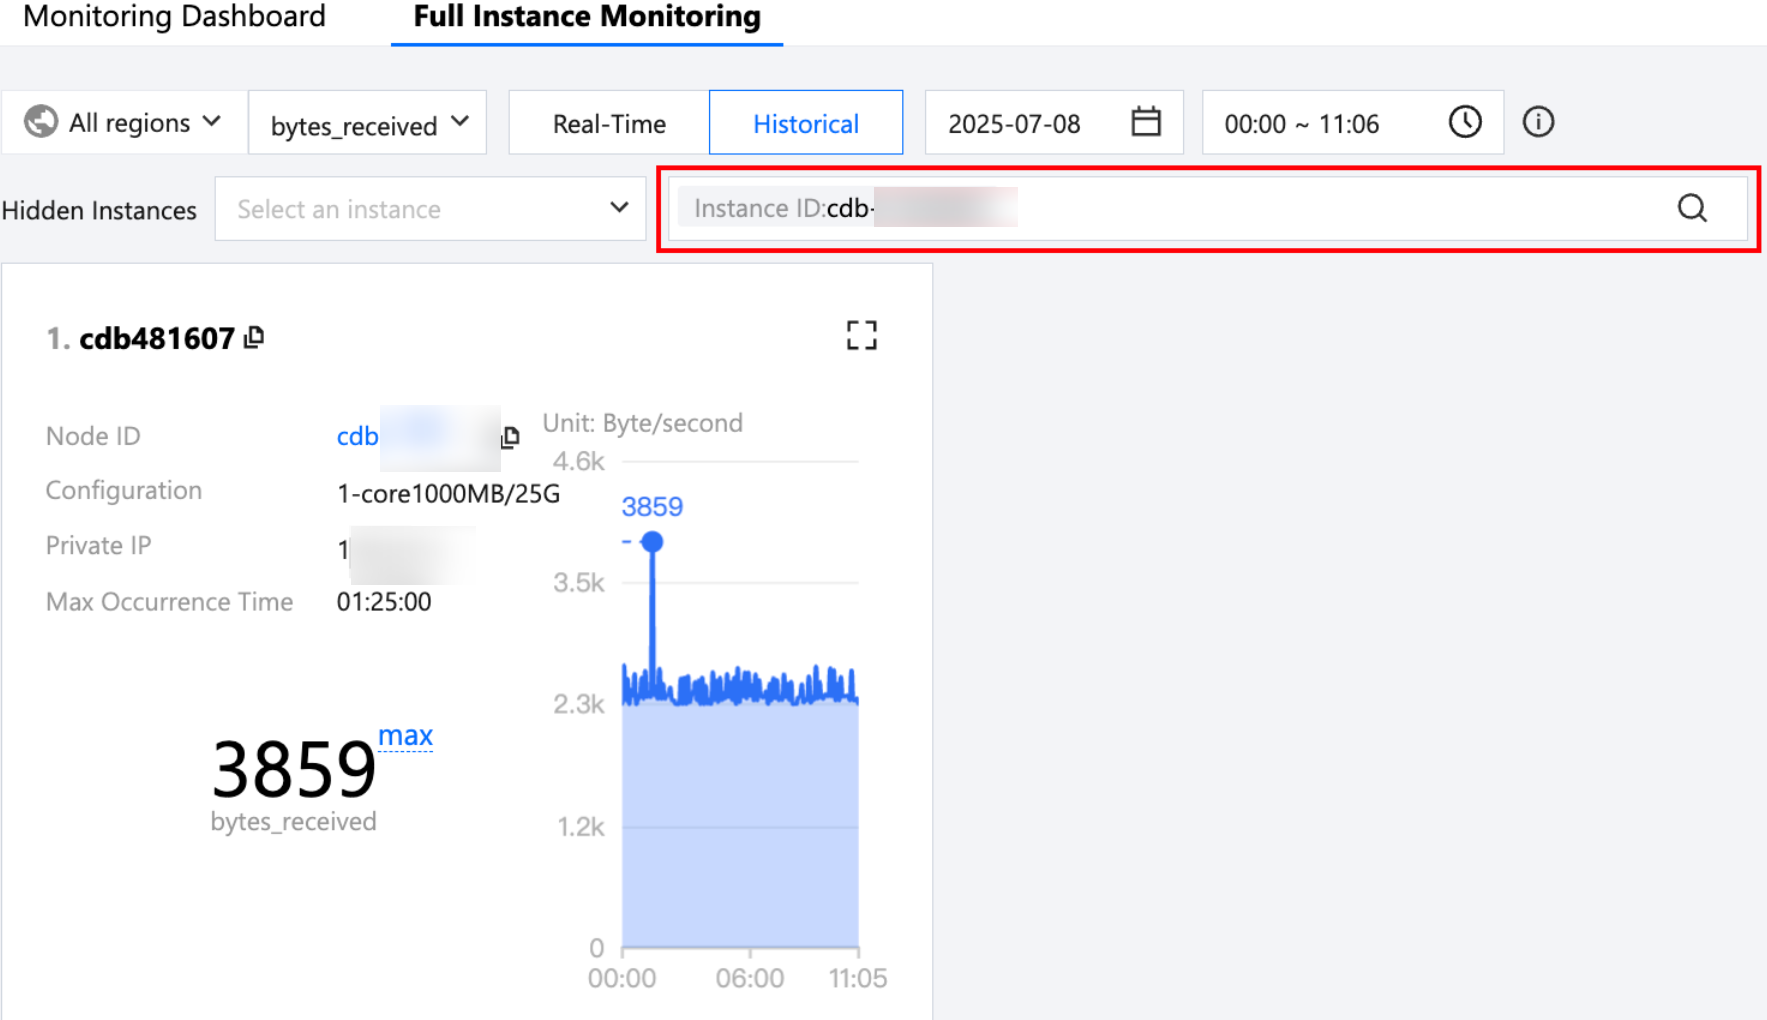
Filter by keywords: Optionally select resource attributes to filter and view instance monitoring information by keywords such as instance ID or instance name.
Click the search bar, and click the Help icon to view the Help for instance search.
Hidden Instances: You can choose to hide specific instances, preventing their monitoring information from being displayed.
9-grid or 36-grid display of monitoring charts: You can switch between a 9-grid or 36-grid display of monitoring charts in the upper-right corner of the page. For users with many instances, the 36-grid view is recommended for a clearer global perspective and better visibility of metric fluctuations.
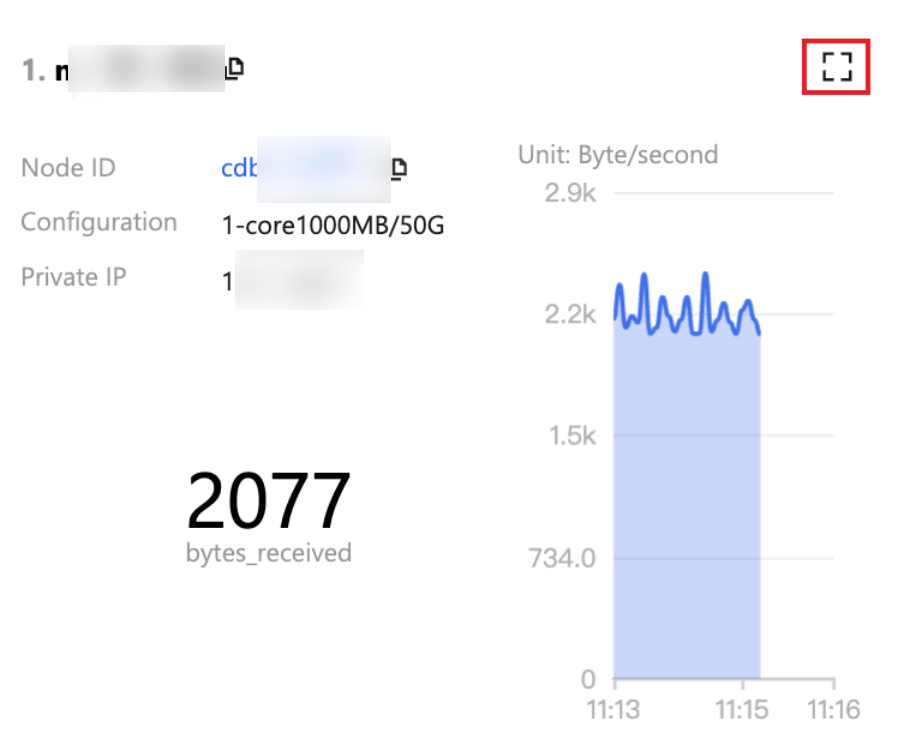
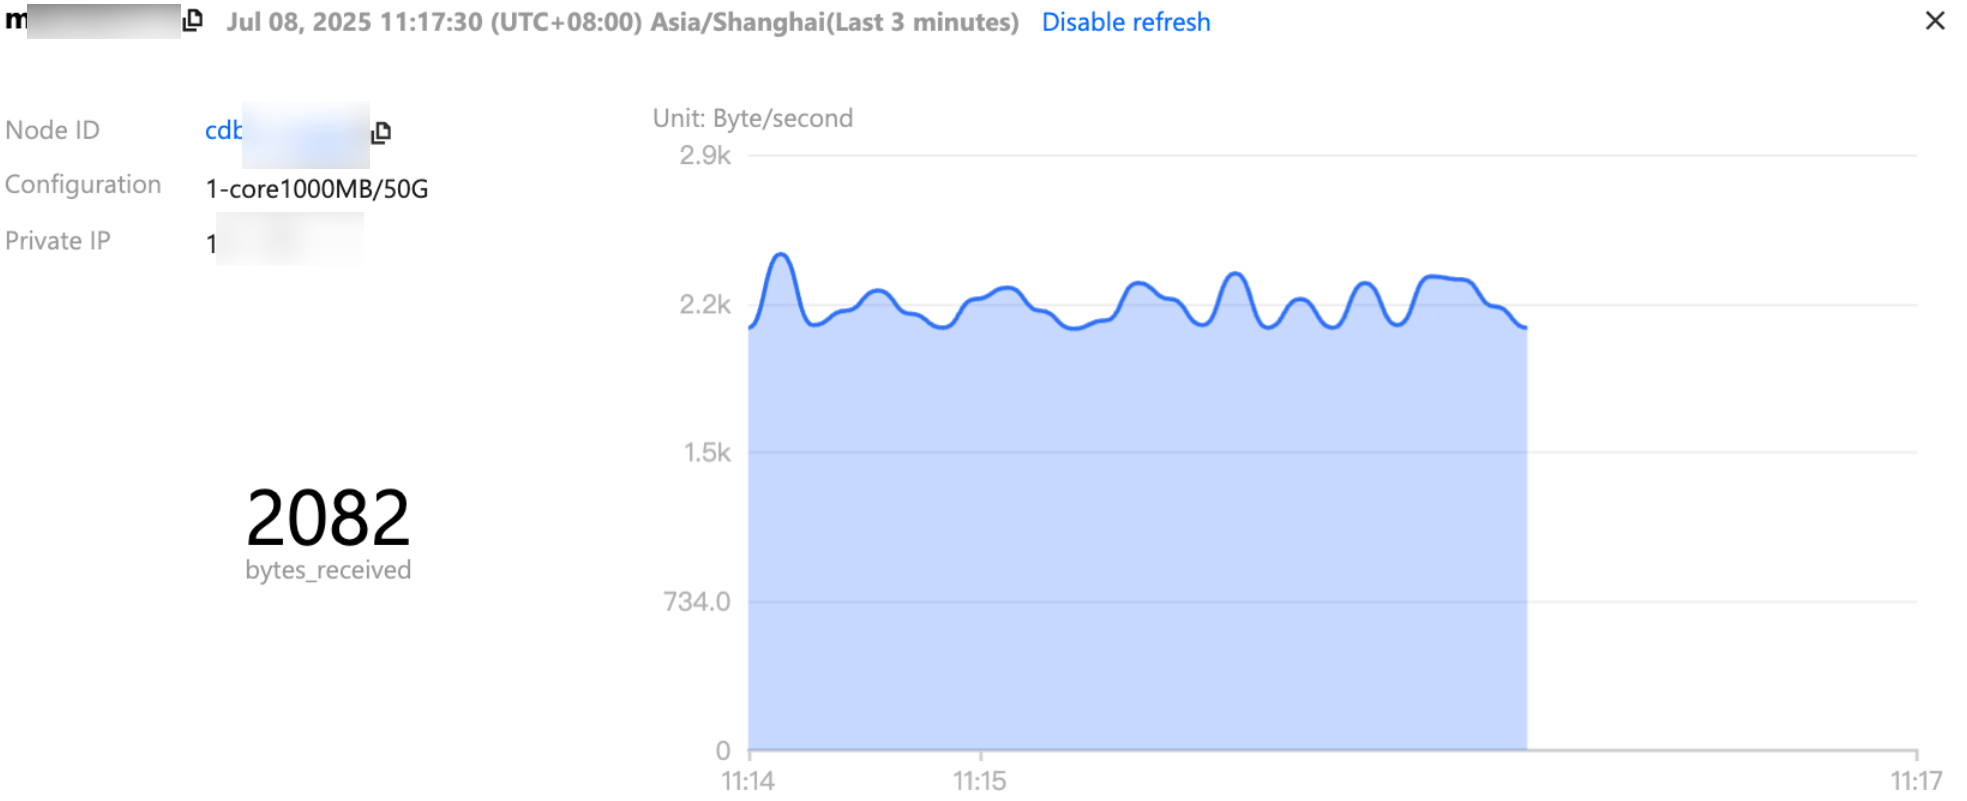
Zoom in for individual monitoring metrics: Click
in the upper-right corner of a chart card to view the monitoring data of the instance separately on the pop-up page.
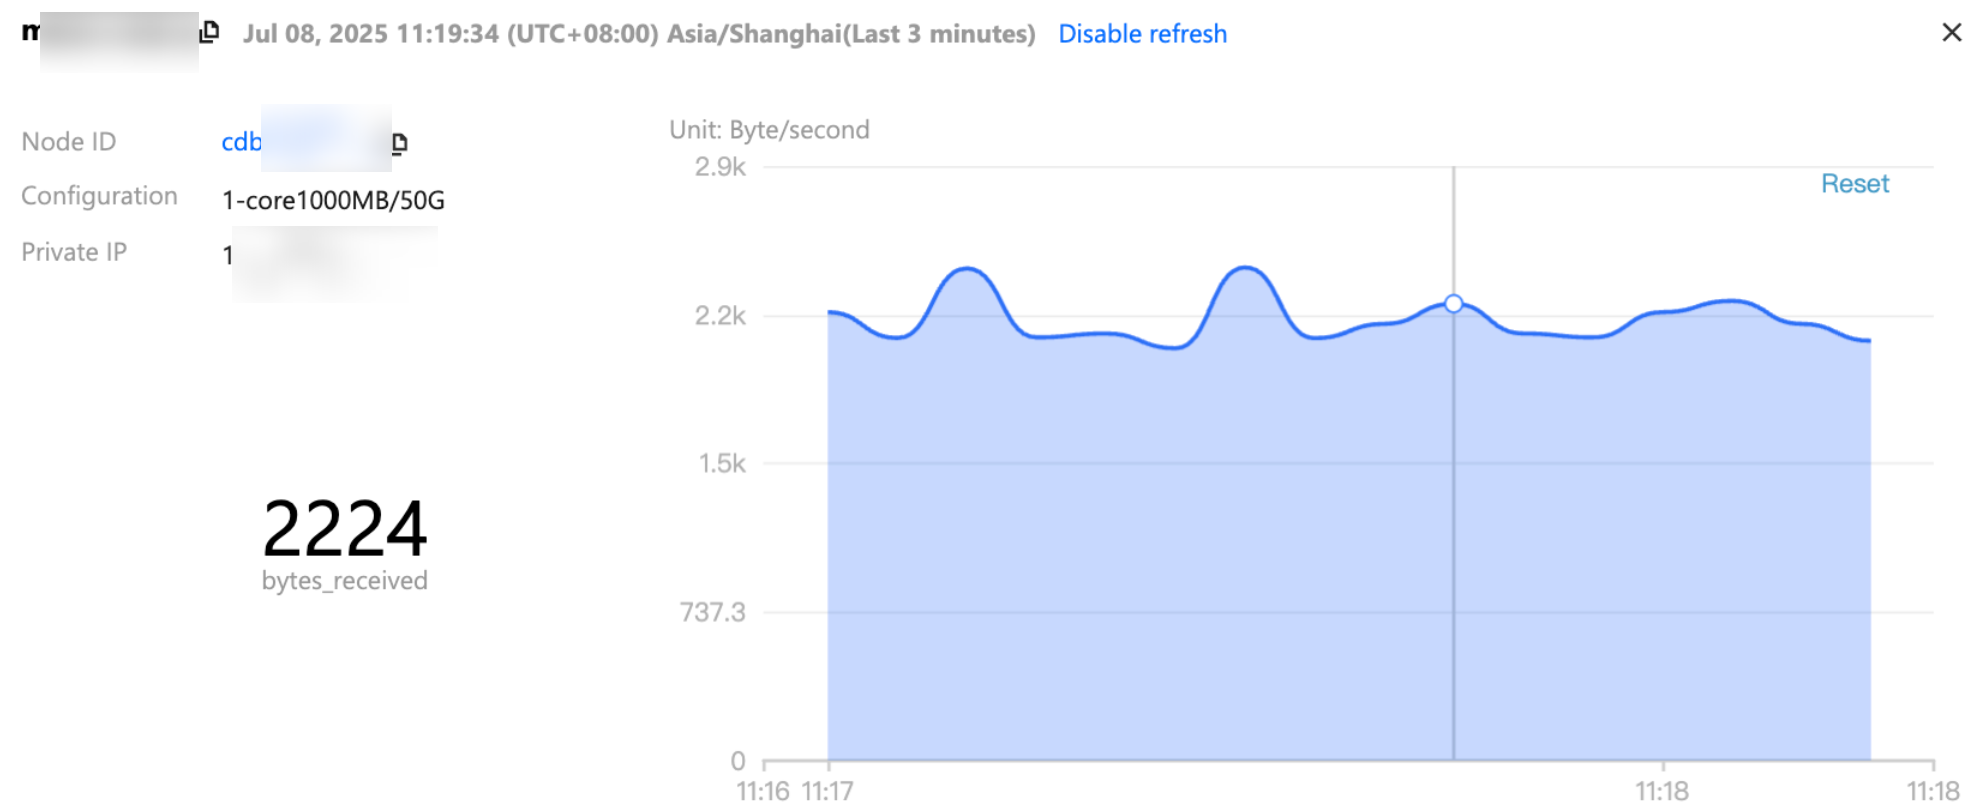
View monitoring charts in fine granularity: Drag the mouse within a single trend chart to select the time period to zoom in, and view the trend chart in fine granularity for that period.