- Release Notes and Announcements
- Product Introduction
- Purchase Guide
- Operation Guide
- Best Practices
- API Documentation
- History
- Introduction
- API Category
- Making API Requests
- Health Report Email Sending APIs
- Exception Detection APIs
- Session Killing APIs
- Space Analysis APIs
- Slow Log Analysis APIs
- Security Audit APIs
- Database Audit APIs
- Other APIs
- Data Types
- Error Codes
- DBbrain APIs 2019-10-16
- FAQs
- Service Level Agreement
- Glossary
- Contact Us
Feature description
You can use DBbrain's real-time session feature to view the real-time session information of your instance, including Performance Monitoring, Connection Monitoring, and Active Session.
Performance monitoring
Log in to the DBbrain console and select Performance Optimization on the left sidebar. On the displayed page, select a database type and an instance at the top, and select the Real-Time Session tab.
The Refreshing Frequency is 15s by default and can be set as needed. You can also disable refresh.
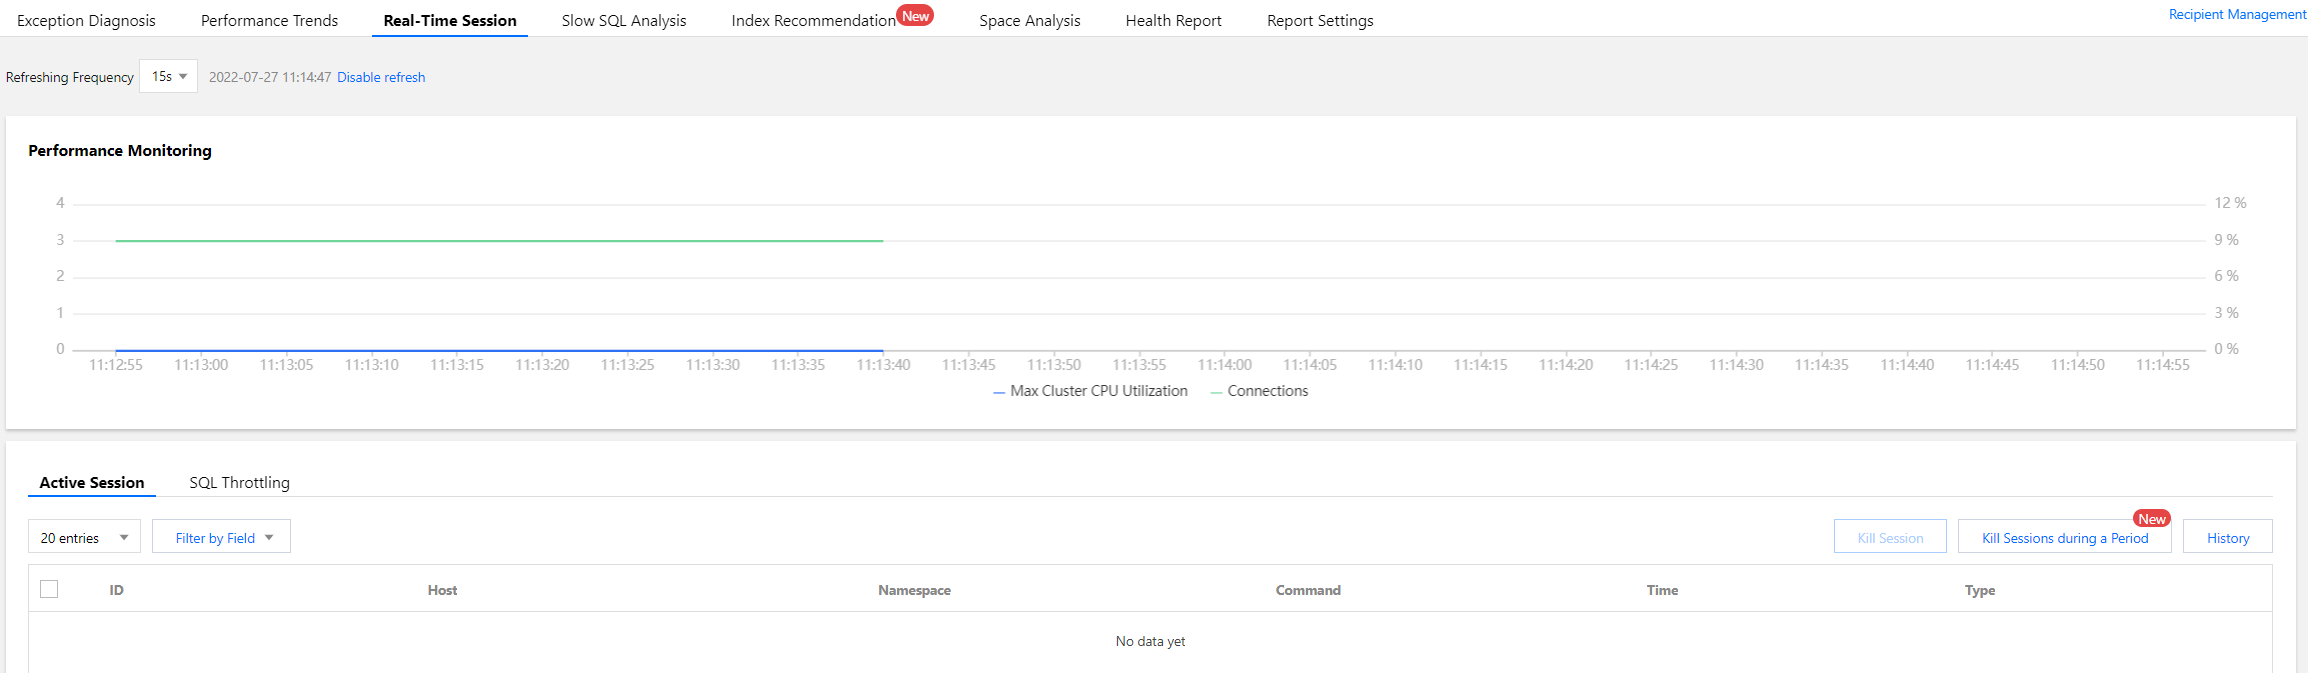
Active session
On the Active Session tab, you can set the limit, filter by field, and enable or disable Show Sleep Connection.
You can set the limit to 20, 50, or 100.
Filter by Field supports filtering by ID, HOST, Namespace, Type, and TIME fields.
You can filter active sessions by All or Others (including
update, insert, query, getMore, remove, killcursors, command, compressed, and none).Killing sessions
DBbrain allows you to kill sessions for easier session management.
Kill current sessions
Select target sessions and click Kill Session.
You can kill 1–100 sessions at a time.
Kill sessions during a period
DBbrain offers the feature of killing sessions during a period. You can set the conditions for killing sessions, so that when the conditions are met, sessions will be killed automatically.
1. Task Settings.
Set the conditions for killing sessions during a period (including HOST, Namespace, Type, and TIME) and set the Execution Mode.
Note:
You can set one or more filter conditions which are evaluated using the logical AND operator.
If only Time and Duration are set, all sessions that meet the conditions will be killed quickly.
2. Session Preview.
After setting the task, you can preview the sessions to be killed in the Session Preview section. After killing sessions during a period is enabled, the generated sessions that meet the conditions will be automatically killed.
3. Task Details.
After setting the task, click Details in the top-right corner to view the details of the sessions killed during a period.
View the history of killed sessions
DBbrain provides the feature of viewing the history of killed sessions. To use this feature, click History.

 Yes
Yes
 No
No
Was this page helpful?