Real-time performance trend monitoring tracks key performance metrics for Tencent Cloud Distributed Cache database instances, Redis nodes, and Proxy nodes, including CPU, memory, key information, network usage, network utilization, requests, and responses. Monitoring data is collected at a granularity of seconds, dynamically displaying changes in various metrics graphically and statistically summarizing maximum, minimum, and average values in table form. It supports multi-node metric comparisons, time-range comparison analysis, and flexible drag-and-zoom monitoring views.
With its powerful data statistical analysis capabilities, diverse display options, and high real-time performance, it meets various Ops and troubleshooting scenarios for database instances, helping Ops personnel quickly grasp the overall performance status of databases and prevent risks promptly.
Supported Performance Metrics
DBbrain currently supports monitoring the following Tencent Cloud Distributed Cache database performance metrics:
Category
Category Child Items
Chinese Metric Name
English Metric Name
Unit
Metric Meaning
Instance
CPU
CPU Utilization
cpu_util
%
Average CPU utilization.
Max Node CPU Utilization
cpu_max_util
%
Maximum CPU utilization of nodes (shards or replicas) in the instance.
Memory Info
Memory Usage
mem_used
MB
Memory capacity actually used, including data and cache.
Memory Utilization
mem_util
%
The proportion of actually used memory to total applied memory.
Max Node MEM Utilization
mem_max_util
%
Maximum memory utilization of nodes (shards or replicas) in the instance.
Latency
Avg Execution Latency
latency_avg
millisecond
The average execution latency from the Proxy to the Tencent Cloud Distributed Cache Server.
Max Execution Latency
latency_max
millisecond
The maximum execution latency from the Proxy to the Tencent Cloud Distributed Cache Server.
P99 Execution Latency
latency_p99
millisecond
The 99% execution latency from the Proxy to the Tencent Cloud Distributed Cache Server.
Avg Read Latency
latency_read
millisecond
The average execution latency of read commands from the Proxy to the Tencent Cloud Distributed Cache Server.
Avg Write Latency
latency_write
millisecond
The average execution latency of write commands from the Proxy to the Tencent Cloud Distributed Cache Server.
Avg Latency of Other Commands
latency_other
millisecond
The average execution latency of commands other than read and write commands from the Proxy to the Tencent Cloud Distributed Cache Server.
Key Info
Total keys
keys
pcs
The total number of keys stored in an instance (first-level keys).
Expired Keys
expired
pcs
The number of keys evicted within the time window, corresponding to the expired_keys output by the info command.
Evicted Keys
evicted
pcs
The number of keys evicted within the time window, corresponding to the evicted_keys output by the info command.
Network Usage
Connections
connections
pcs
The number of TCP connections to an instance.
Inbound Traffic
in_flow
Mb/second
Private network inbound traffic.
Outbound Traffic
out_flow
Mb/second
Private network outbound traffic.
Network Utilization
Connection Utilization
connections_util
%
The ratio of the actual TCP connection count to the maximum connection count.
Inbound Traffic Utilization
in_bandwidth_util
%
The ratio of the actually used private network inbound traffic to the maximum traffic.
Outbound Traffic Utilization
out_bandwidth_util
%
The ratio of the actually used private network outbound traffic to the maximum traffic.
Inbound Traffic Throttling Trigger
in_flow_limit
times
The number of times for which inbound traffic exceeds the maximum bandwidth.
Outbound Traffic Throttling Trigger
out_flow_limit
times
The number of times for which outbound traffic exceeds the maximum bandwidth.
Request
Total Requests
commands
times/second
Average CPU utilization.
Read Request
cmd_read
times/second
Maximum CPU utilization of nodes (shards or replicas) in the instance.
Write Request
cmd_write
times/second
The number of times for which write command executed per second.
Other Requests
cmd_other
times/second
The number of times for which commands executed per second excluding read and write commands.
Big Value Request
cmd_big_value
times/second
The number of times for which commands executed per second with request size exceeding 32 KB.
Key Requests
cmd_key_count
pcs/second
The number of key requests per second.
Mget Requests
cmd_cmget
times/second
The number of requests executed per second using Mget.
Response
Slow Query
cmd_slow
times
The number of times for which commands with execution latency is greater than the slowlog-log-slower-than configuration.
Read Request Hit
cmd_hits
times
The number of read requests for existing keys, corresponding to the keyspace_hits metric reported by the info command.
Read Request Miss
cmd_miss
times
The number of read requests for keys that do not exist, corresponding to the keyspace_misses metric reported by the info command.
Read Request Hit Rate
cmd_hits_ratio
%
Key Hit / (Key Hit + Key Miss). This metric reflects the cache miss rate. When the access is 0, this value is null.
Execution Error
Execution Error
cmd_err
times/second
The number of times for which a command execution error occurred, such as non-existent commands or parameter errors.
Redis Node
CPU
CPU Utilization
cpu_util
%
Average CPU utilization.
Memory Info
Memory Usage
mem_used
MB
Memory capacity actually used, including data and cache.
Memory Utilization
mem_util
%
The proportion of actually used memory to total applied memory.
Key Info
Total Keys
keys
pcs
The total number of keys stored in an instance (first-level keys).
Expired Keys
expired
pcs
The number of keys evicted within the time window, corresponding to the expired_keys output by the info command.
Evicted Keys
evicted
pcs
The number of keys evicted within the time window, corresponding to the evicted_keys output by the info command.
Replication Delay
Replication Delay
repl_delay
B
The relative command latency length of the replica node to the primary node.
Network Usage
Connections
connections
pcs
The number of connections from the proxy to the node.
Connection Utilization
connections_util
%
Node connection utilization.
Request
Total Requests
commands
times/second
QPS, number of times for which commands executed.
Read Request
cmd_read
times/second
The number of times for which read command executed.
Write Request
cmd_write
times/second
The number of times for which write command executed.
Other Requests
cmd_other
times/second
The number of times for which commands executed other than read and write commands.
Response
Slow Query
cmd_slow
times
The number of times for which commands with execution latency is greater than the slowlog-log-slower-than configuration.
Read Request Hit
cmd_hits
times
The number of read requests for existing keys, corresponding to the keyspace_hits metric reported by the info command.
Read Request Miss
cmd_miss
times
The number of read requests for keys that do not exist, corresponding to the keyspace_misses metric reported by the info command.
Read Request Hit Rate
cmd_hits_ratio
%
Key Hit / (Key Hit + KeyMiss), this metric can reflect the situation of Cache Miss.
Proxy node
CPU
CPU Utilization
cpu_util
%
Proxy CPU utilization.
Traffic
Inbound Traffic
in_flow
Mb/second
Private network inbound traffic.
Outbound Traffic
out_flow
Mb/second
Private network outbound traffic.
Request
Total Requests
proxy_commands
times/second
The number of commands executed by the proxy.
Key Requests
cmd_key_count
pcs/second
The number of keys accessed by the command.
Mget Request
cmd_mget
times/second
The number of times for which Mget command executed.
Execution Error
cmd_err
times/second
The number of times for proxy command execution errors, such as non-existent commands or parameter errors.
Big Value Requests
cmd_big_value
times/second
The number of times for which requests executed larger than 32 KB per second.
Network Usage
Connections
connections
pcs
The number of TCP connections to an instance.
Connections per Sec
client_connections_received_per_second
times/second
The number of TCP connections established per second.
Disconnections per Sec
client_connections_closed_per_second
times/second
The number of TCP connections disconnected per second.
Abnomal Disconnections per Sec
client_connections_aborted_per_second
times/second
The number of abnormal TCP disconnections per second.
Network Utilization
Connection Utilization
connections_util
%
The ratio of the actual TCP connection count to the maximum connection count.
Inbound Traffic Utilization
in_bandwidth_util
%
The ratio of the actually used private network inbound traffic to the maximum traffic.
Outbound Traffic Utilization
out_bandwidth_util
%
The ratio of the actually used private network outbound traffic to the maximum traffic.
Inbound Traffic Throttling Trigger
in_flow_limit
times
The number of times for which inbound traffic triggered traffic throttling.
Outbound Traffic Throttling Trigger
out_flow_limit
times
The number of times for which outbound traffic triggered traffic throttling.
Latency
Avg Execution latency
latency_avg
millisecond
The average execution latency from the Proxy to the Tencent Cloud Distributed Cache Server.
Max Execution Latency
latency_max
millisecond
The maximum execution latency from the Proxy to the Tencent Cloud Distributed Cache Server.
P99 Execution Latency
latency_p99
millisecond
The 99% execution latency from the Proxy to the Tencent Cloud Distributed Cache Server.
Avg Read Latency
latency_read
millisecond
The average execution latency of read commands from the Proxy to the Tencent Cloud Distributed Cache Server.
Avg Write Latency
latency_write
millisecond
The average execution latency of write commands from the Proxy to the Tencent Cloud Distributed Cache Server.
Avg Latency of Other Commands
latency_other
millisecond
The average execution latency of commands other than read and write commands from the Proxy to the Tencent Cloud Distributed Cache Server.
2. In the left sidebar, choose Performance Optimization.
3. Select the Distributed Cache database type and instance ID at the top, and select the Performance Trends tab.
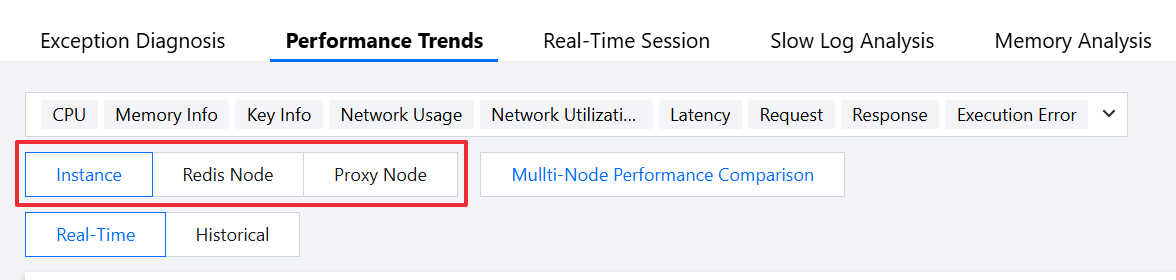
4. Select the monitoring dimension you want to view.
Monitoring dimensions support Distributed Cache instance monitoring, Redis node monitoring, and Proxy node monitoring.
Instance: Displays the monitoring view of the entire instance, supporting real-time and historical data.
Redis Node: Supports viewing monitoring metrics for a single node and comparing the trend of metrics among nodes. For performance trend comparisons across multiple Redis nodes, see Multi-node Performance Comparison.
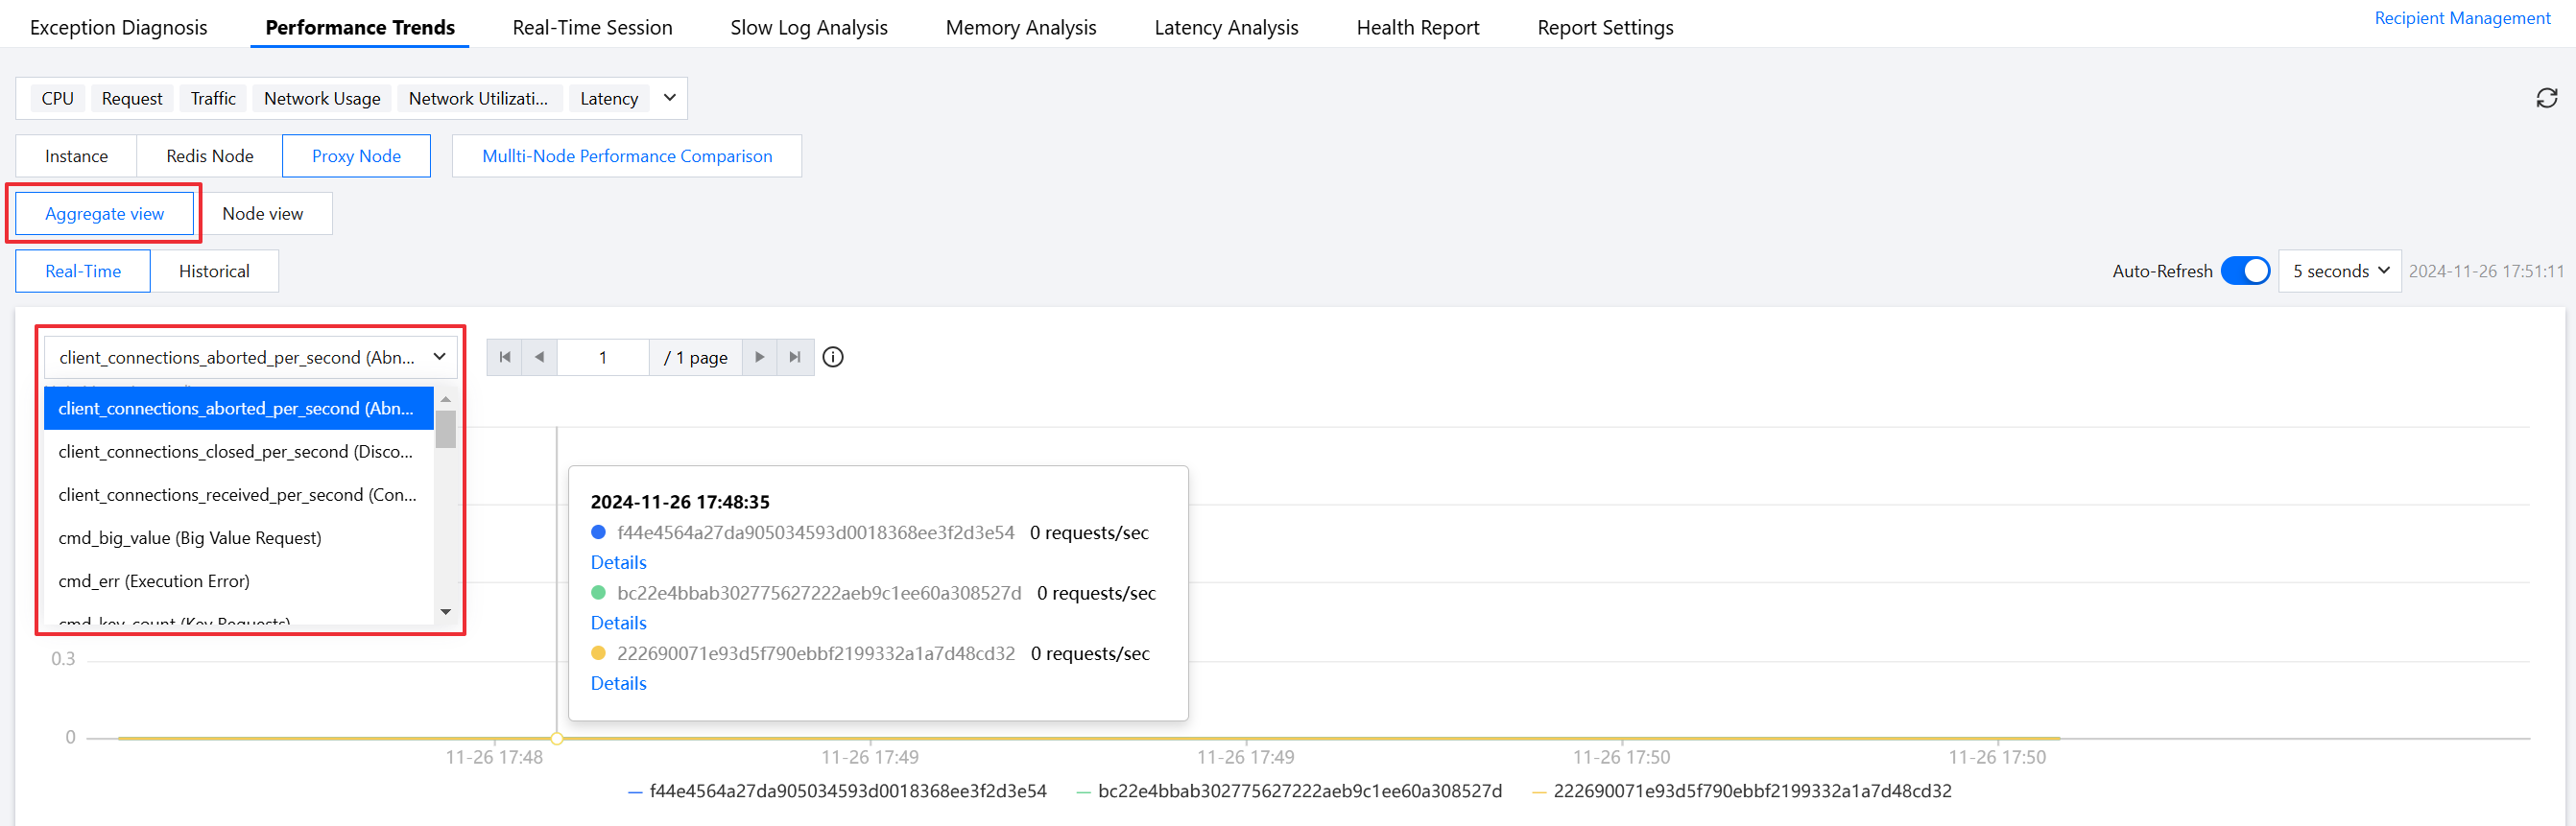
Proxy Node: Displays comparative trends of related metrics across Proxy nodes. When selecting the Proxy node dimension, you can select between Aggregate and Node View modes for real-time and historical data.
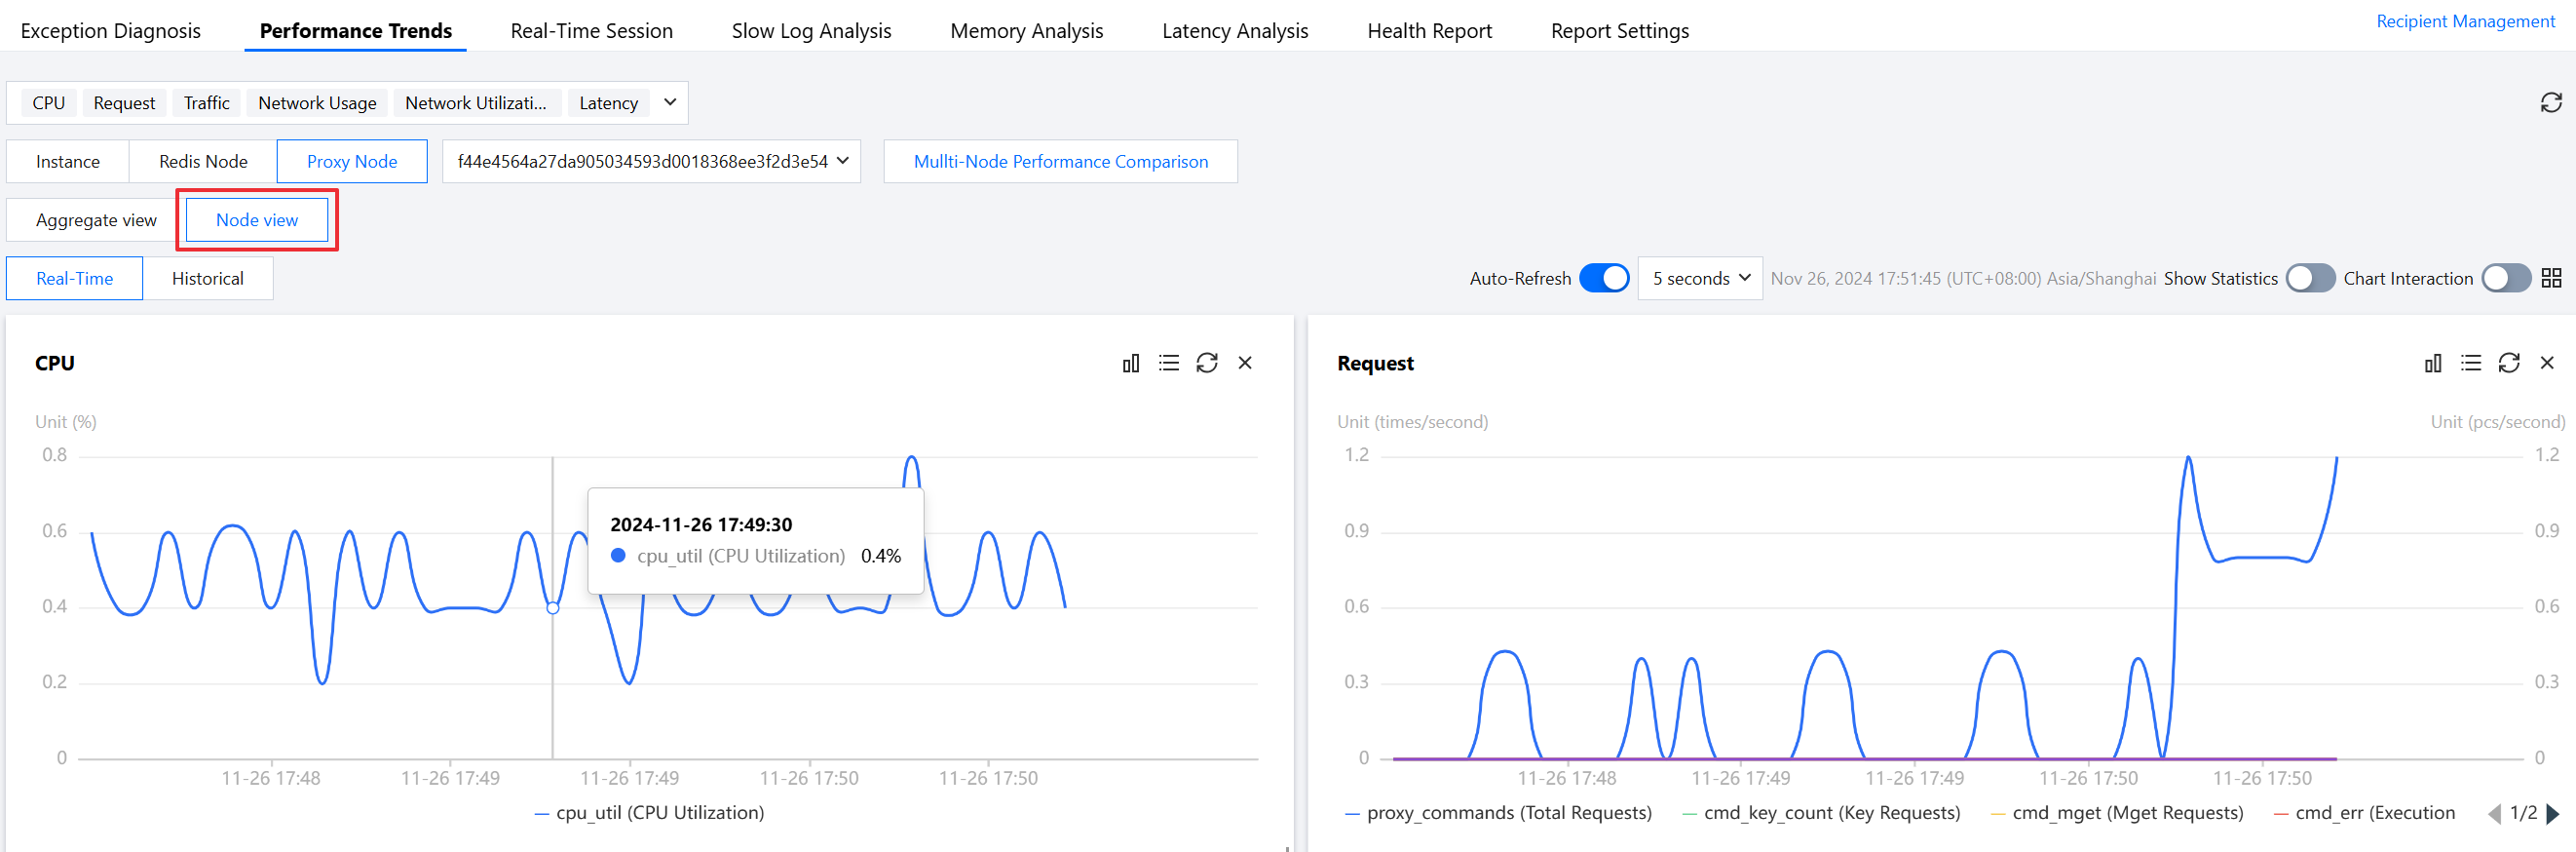
In the Aggregate view mode, all Proxy node information is displayed. Select specific metrics in the upper left corner, and view single metric information for all nodes. Click Details to enter the Node view.
Node view mode, all monitoring metric information of a single node is displayed.
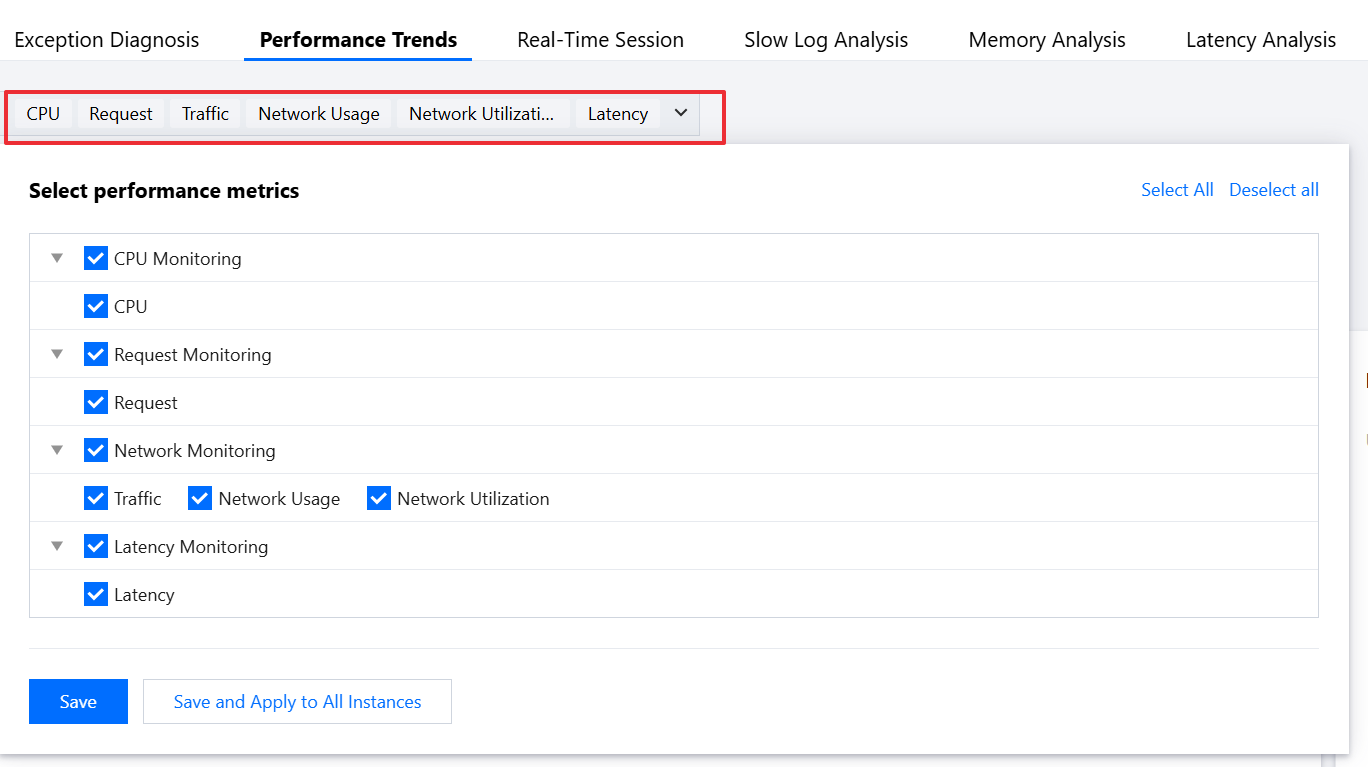
Step 2: Selecting Monitoring Metrics
Click the metrics dropdown list, check Performance metrics, or use the quick-select options in the upper right corner to select all or none. After selecting metrics, click Save.
Click Save to apply the metrics to the currently selected instance.
Click Save and Apply to All Instances to apply the selected metrics to all database instances.
Step 3: Viewing Performance Trend Monitoring View
View the performance trend monitoring view based on the viewing conditions set in the above steps.
The performance trend monitoring view can also be viewed in the following ways.
Switch Between Real-time or Historical Views
Click Real-Time or Historical to view the corresponding real-time performance trend and historical performance trend.
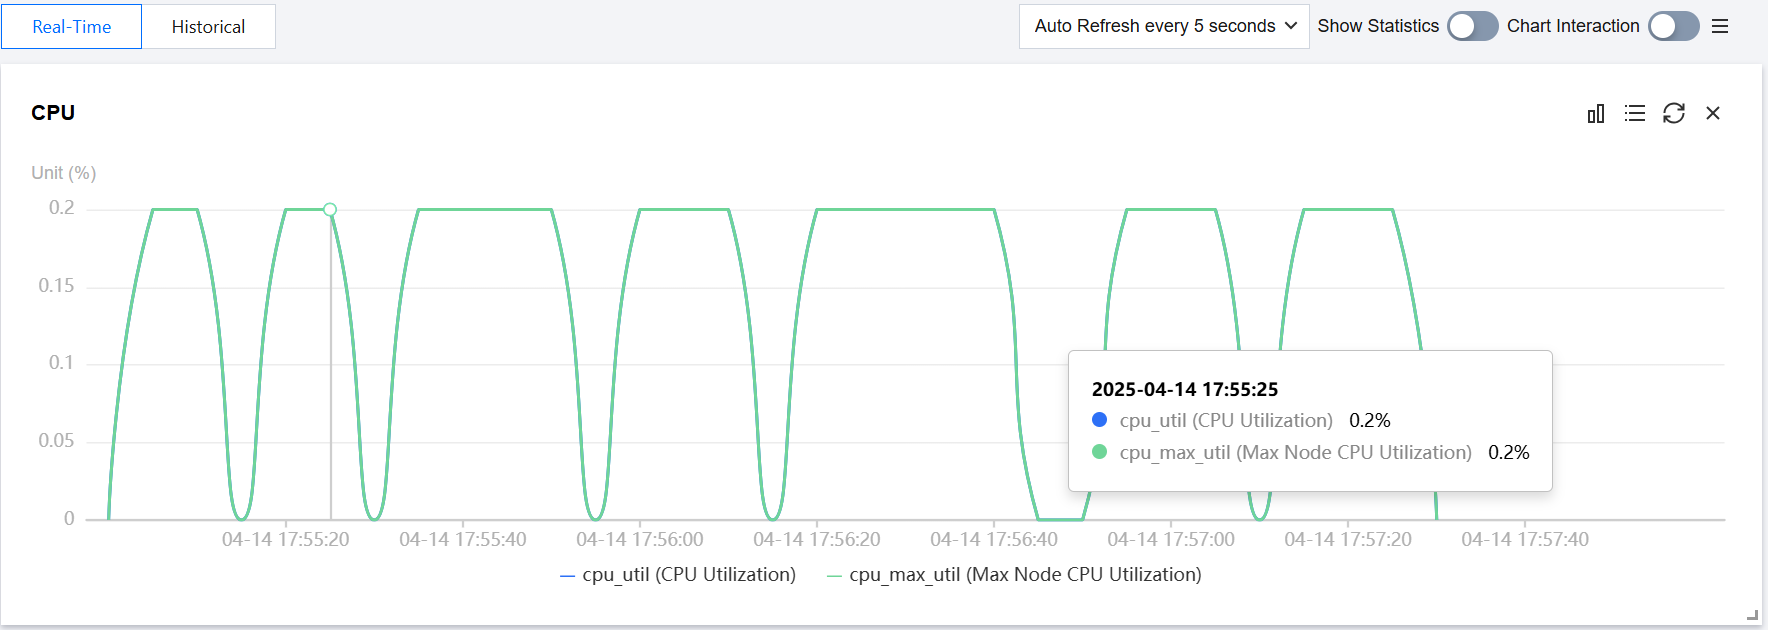
Real-time performance trend view: Users can view the performance trend of the instance. Auto-refresh is enabled by default, with a refresh frequency of 5 seconds. You can select 5 seconds, 10 seconds, 15 seconds, or turn off auto-refresh.
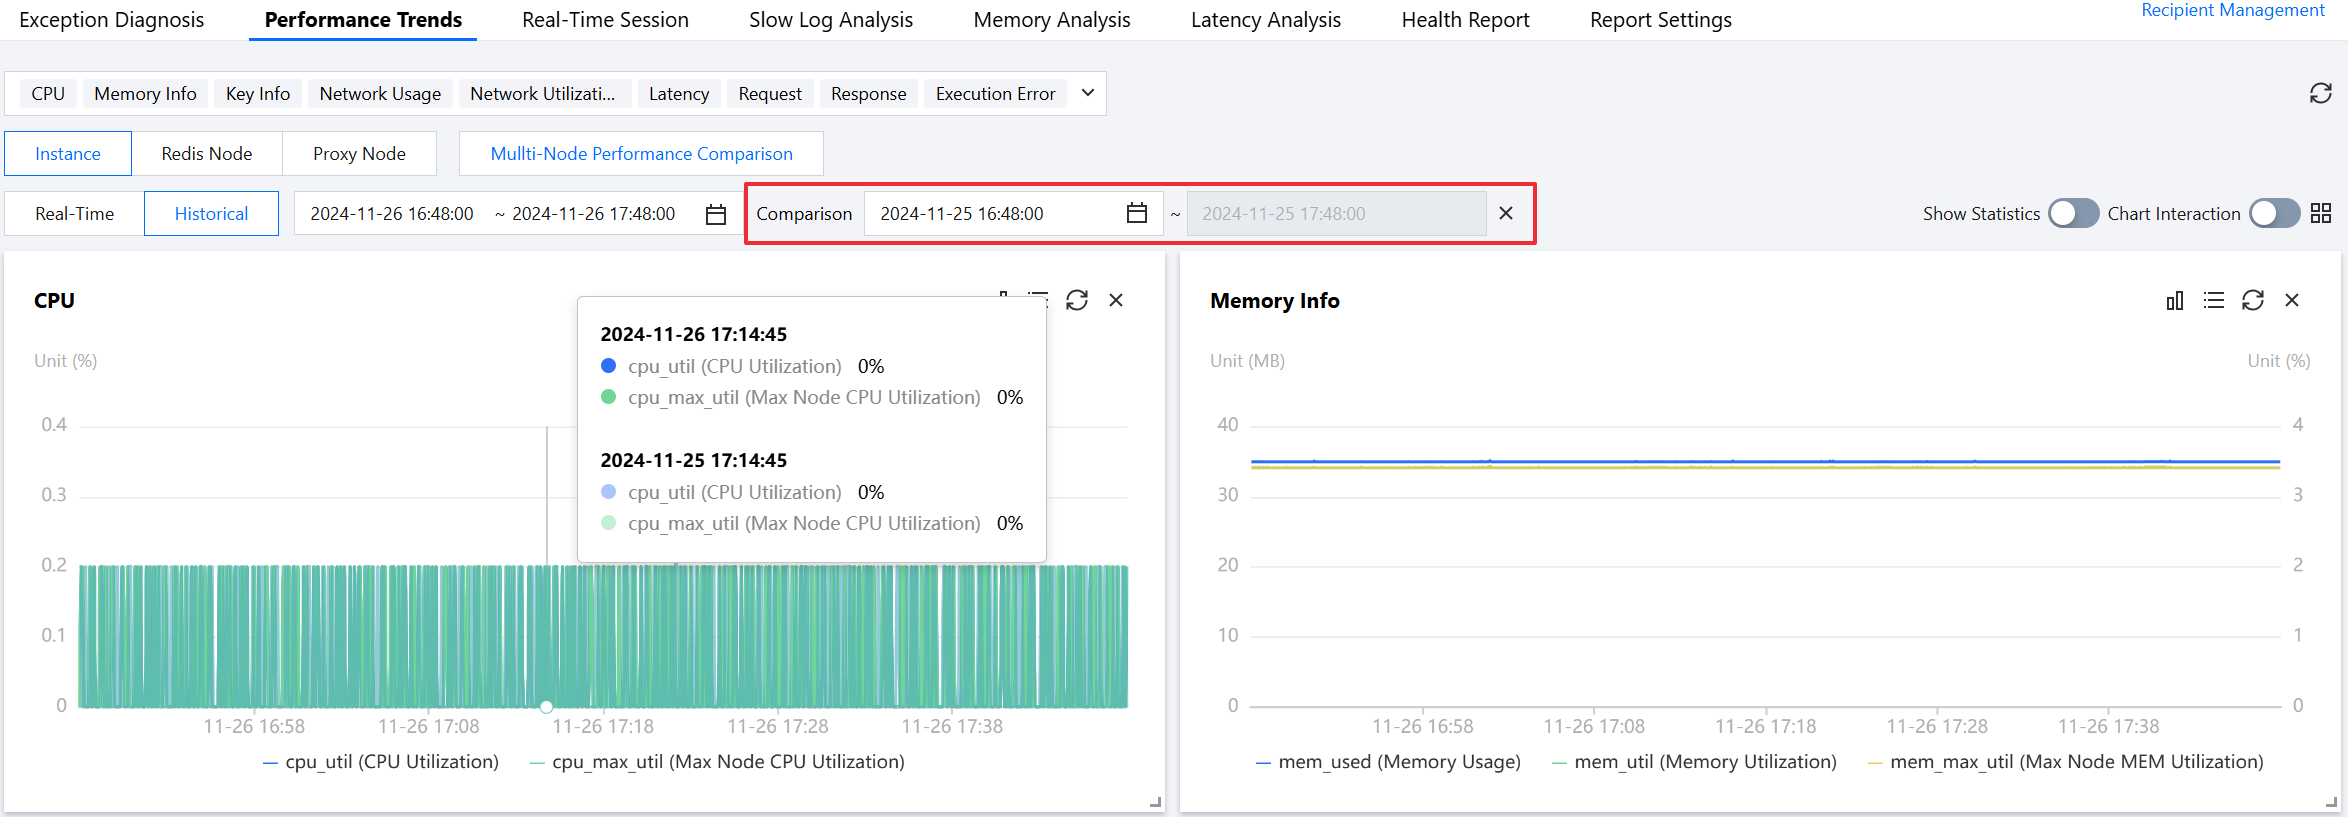
Historical performance trend view: By selecting different time periods, the performance trend monitoring view of the selected period will be displayed. You can switch between the past 1 hour, past 3 hours, past 24 hours, past 7 days, and custom time periods.
Click Add Time Comparison, and select the desired comparison time period to view the time comparison of multiple performance metrics.
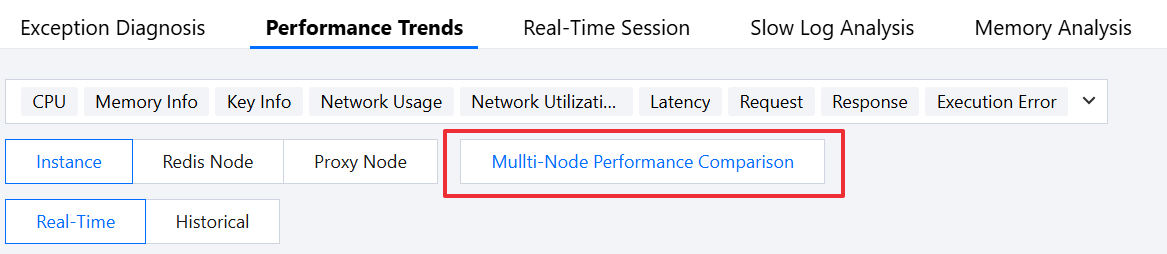
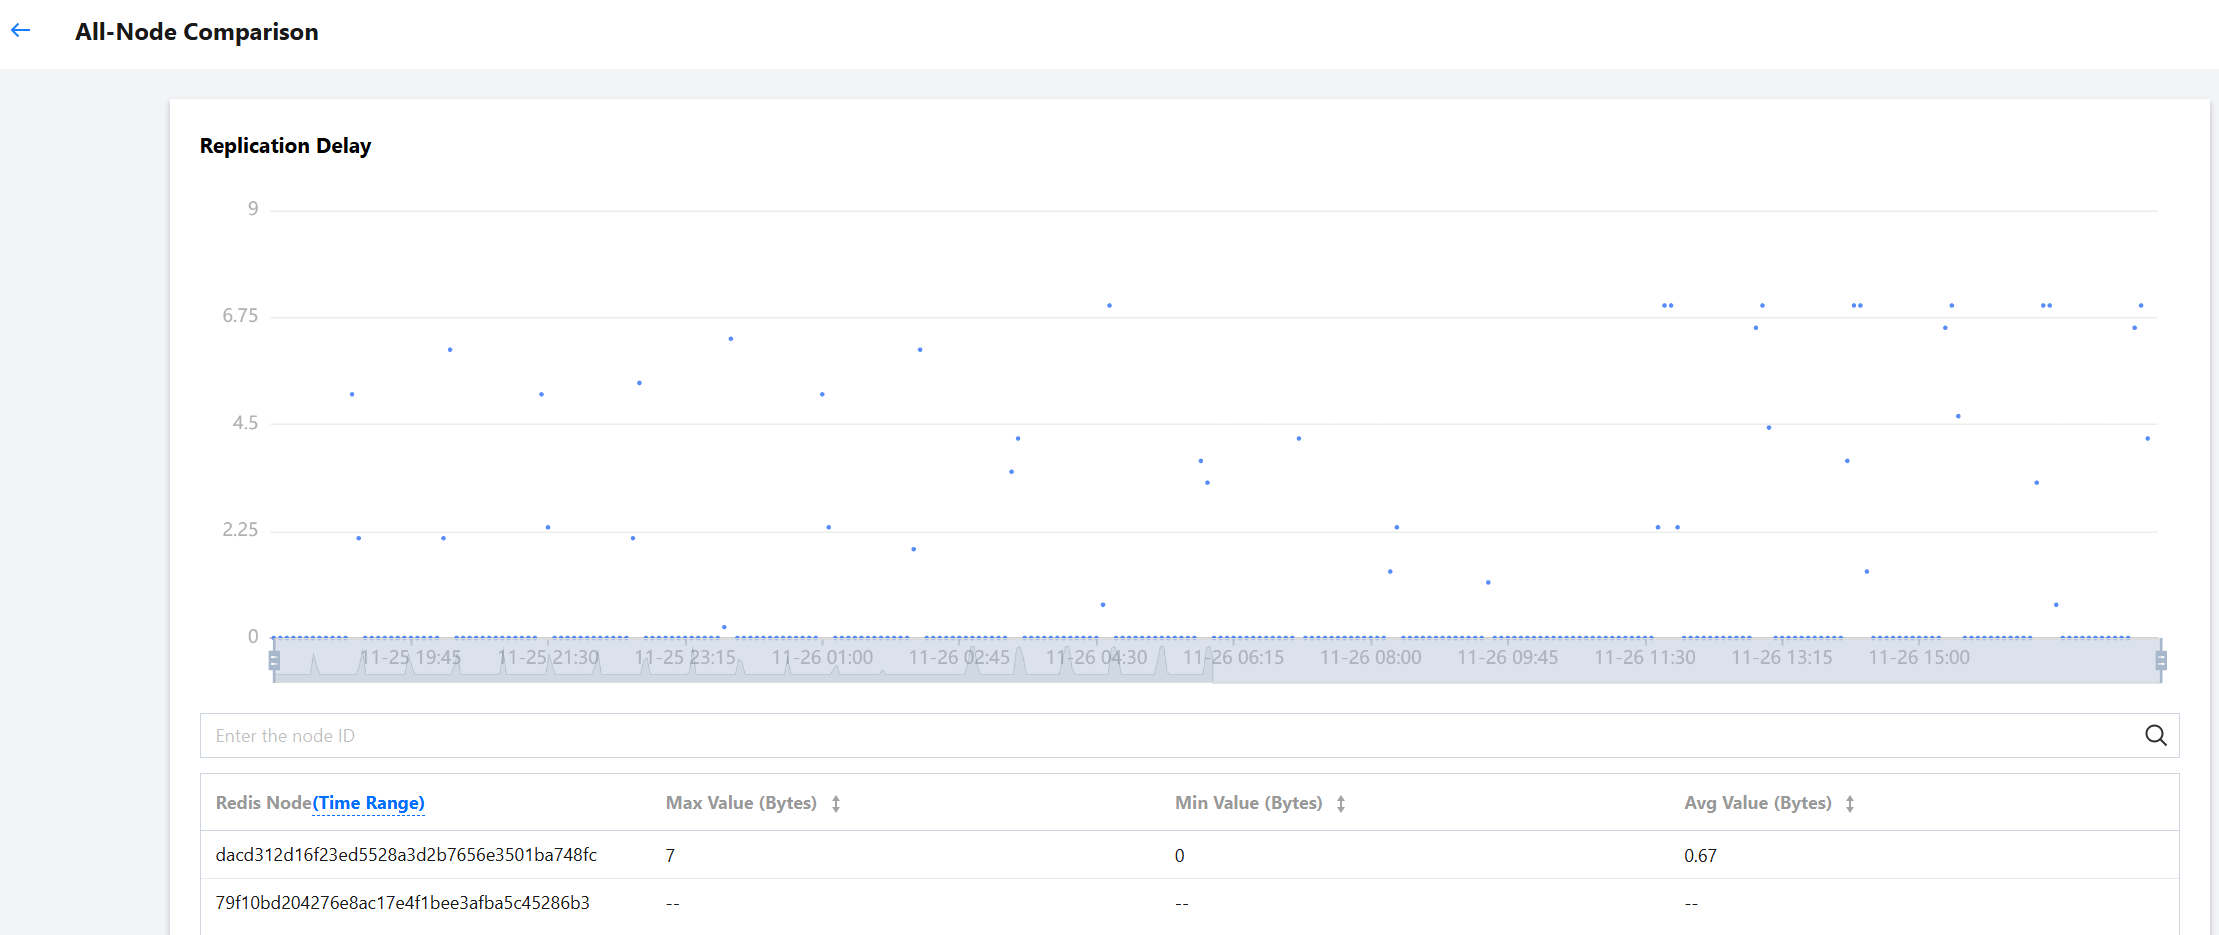
Multi-node Performance Metric Comparison
Currently, only multi-node performance metric comparisons for Redis node monitoring dimensions are supported.
1. At the top of the page, click Multi-Node Performance Comparison.
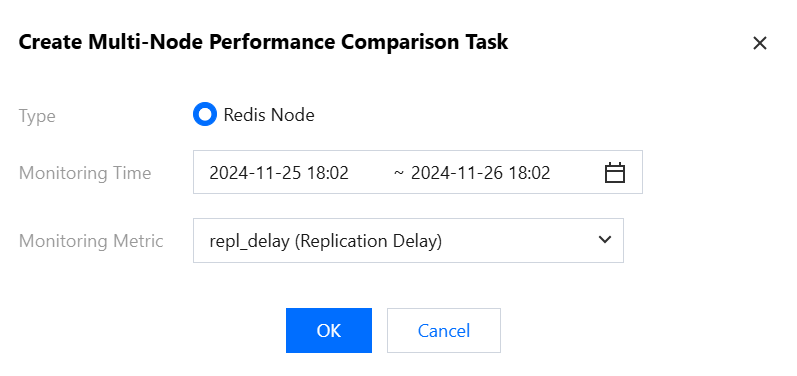
2. In the pop-up window on the right, click Create Multi-Node Performance Comparison Task, select the type, monitoring time, and monitoring item, and click OK.
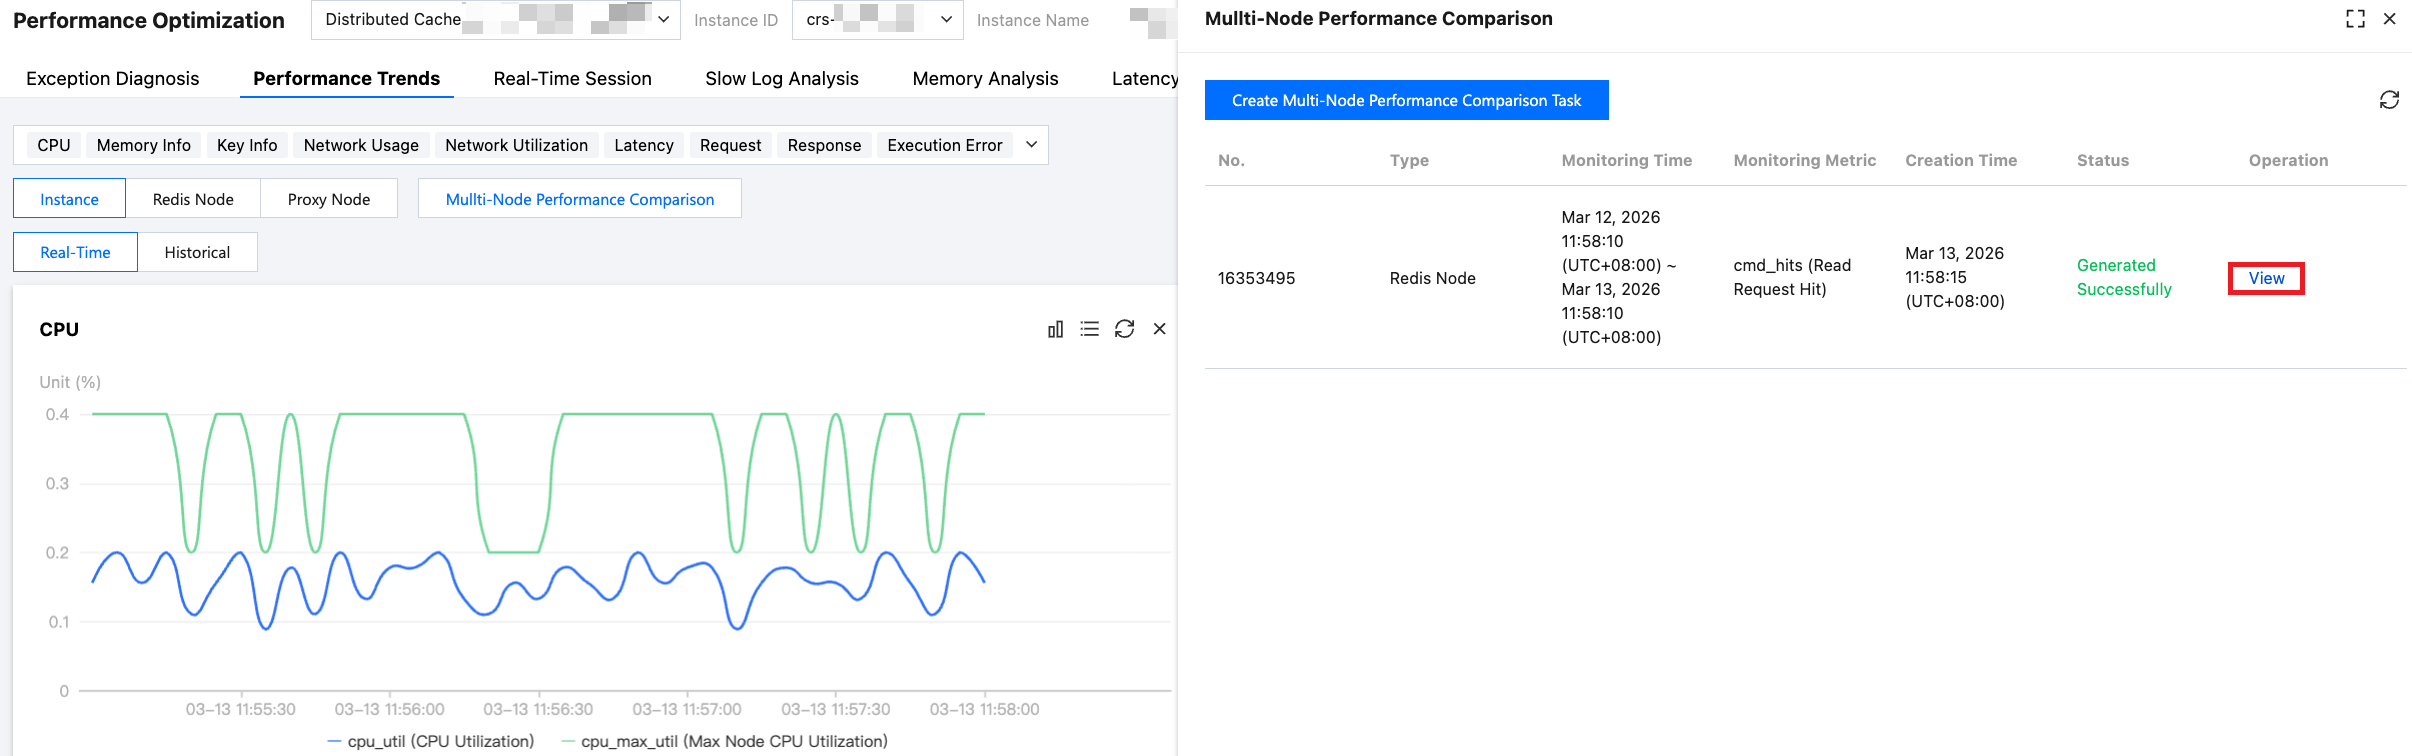
3. In the pop-up window on the right, click View.
4. View the generated full node comparison chart.
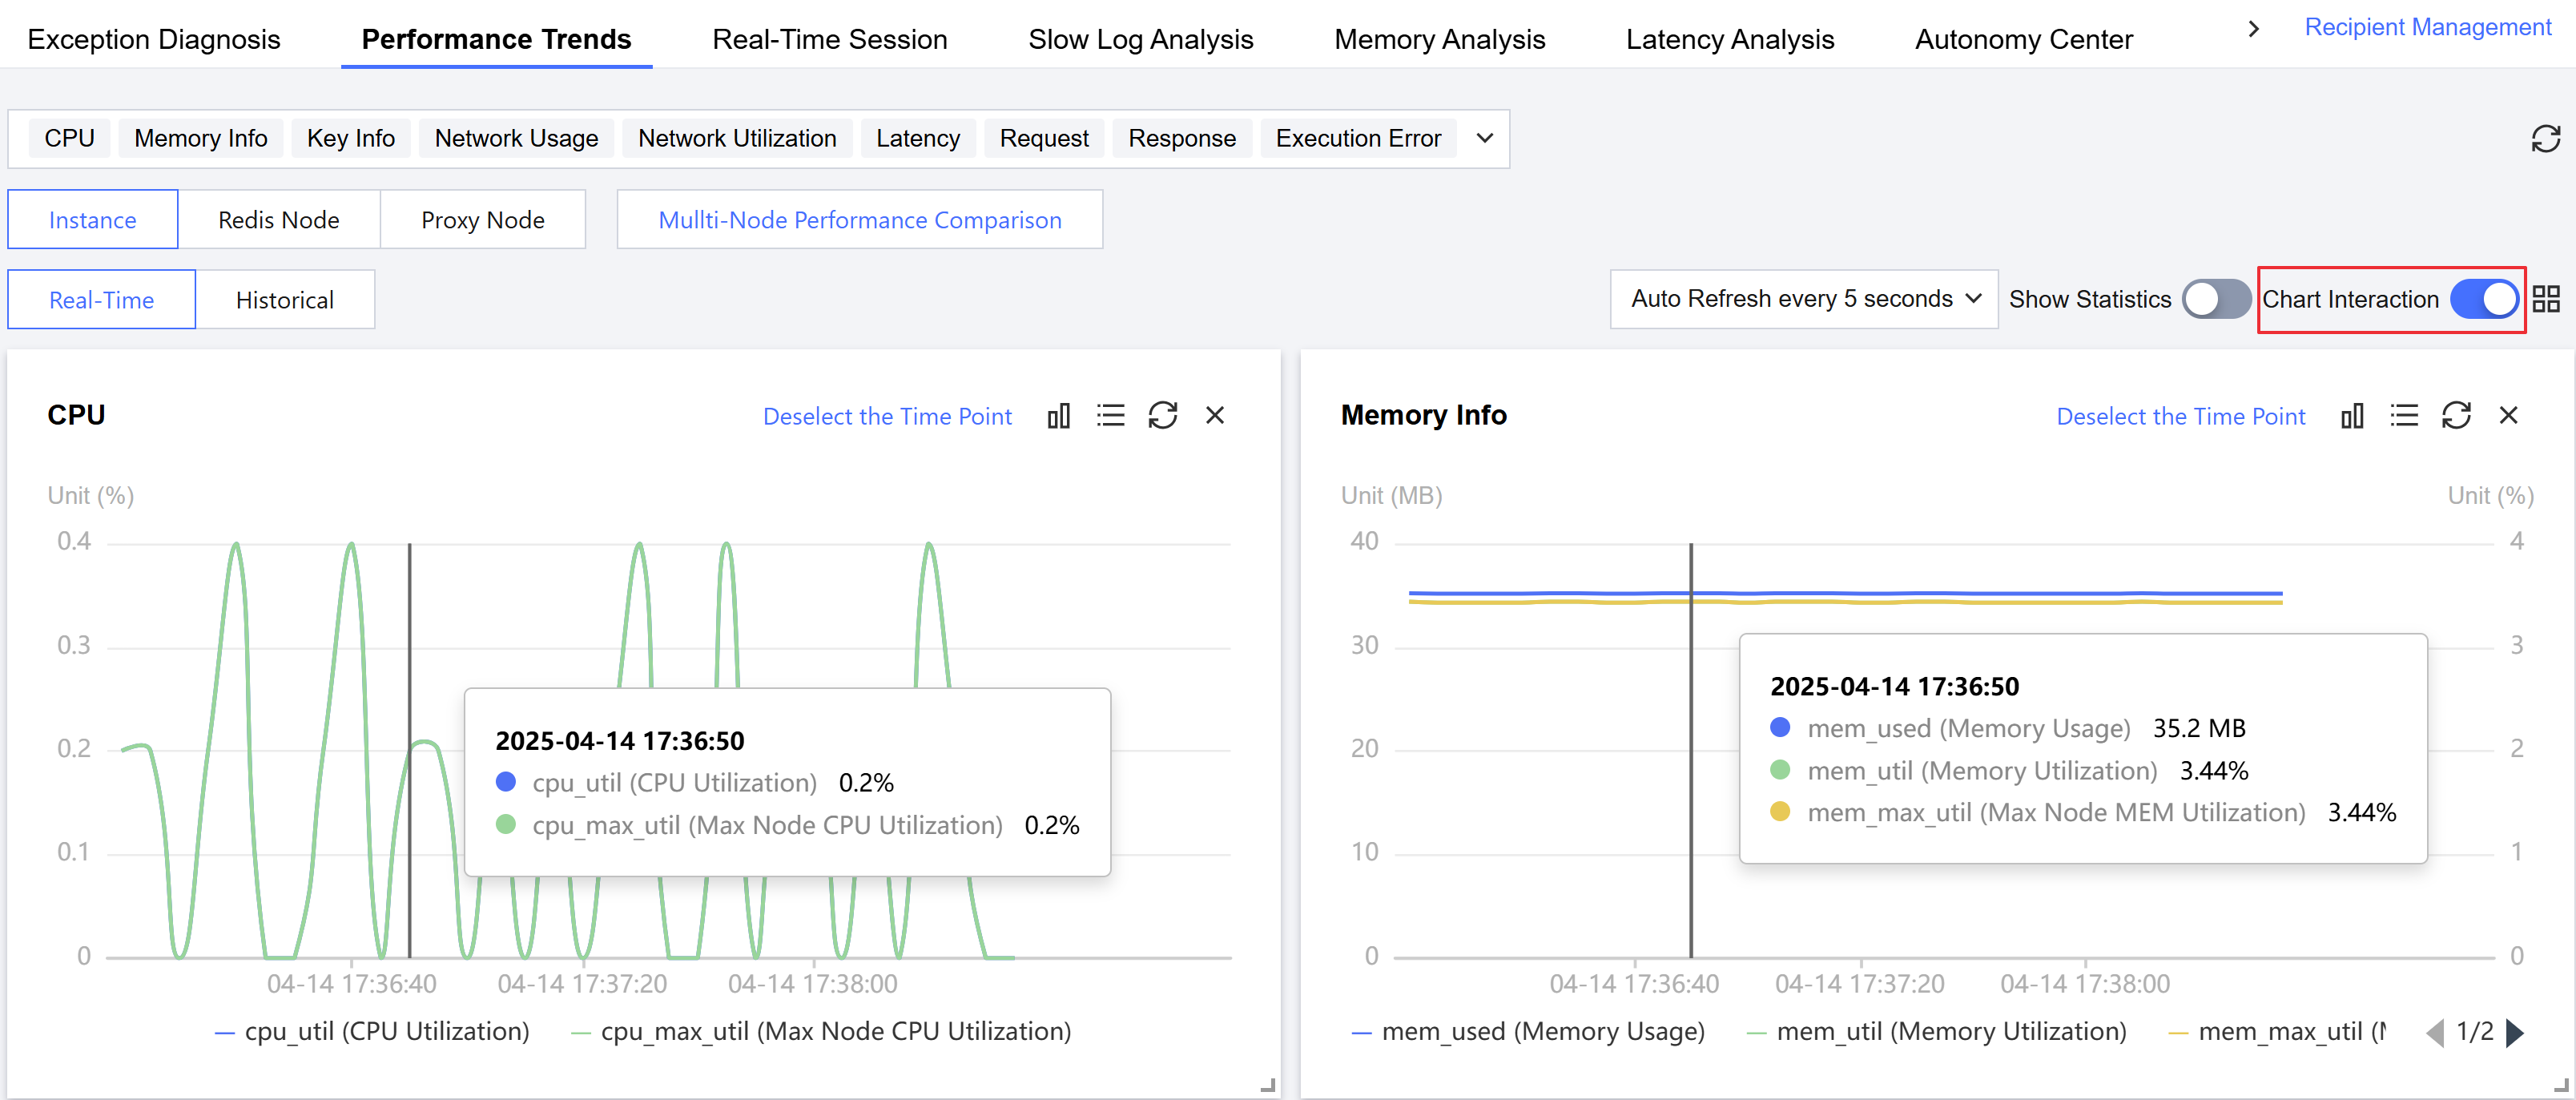
Enabling Chart Linkage
Click the Chart Interaction button on the right side of the page to view associated comparisons across multiple monitoring metrics. Hover over any data point in a monitoring chart to display the data at the same time in other monitoring views. Click to fix the data display, and click Deselect the Time Point to cancel.
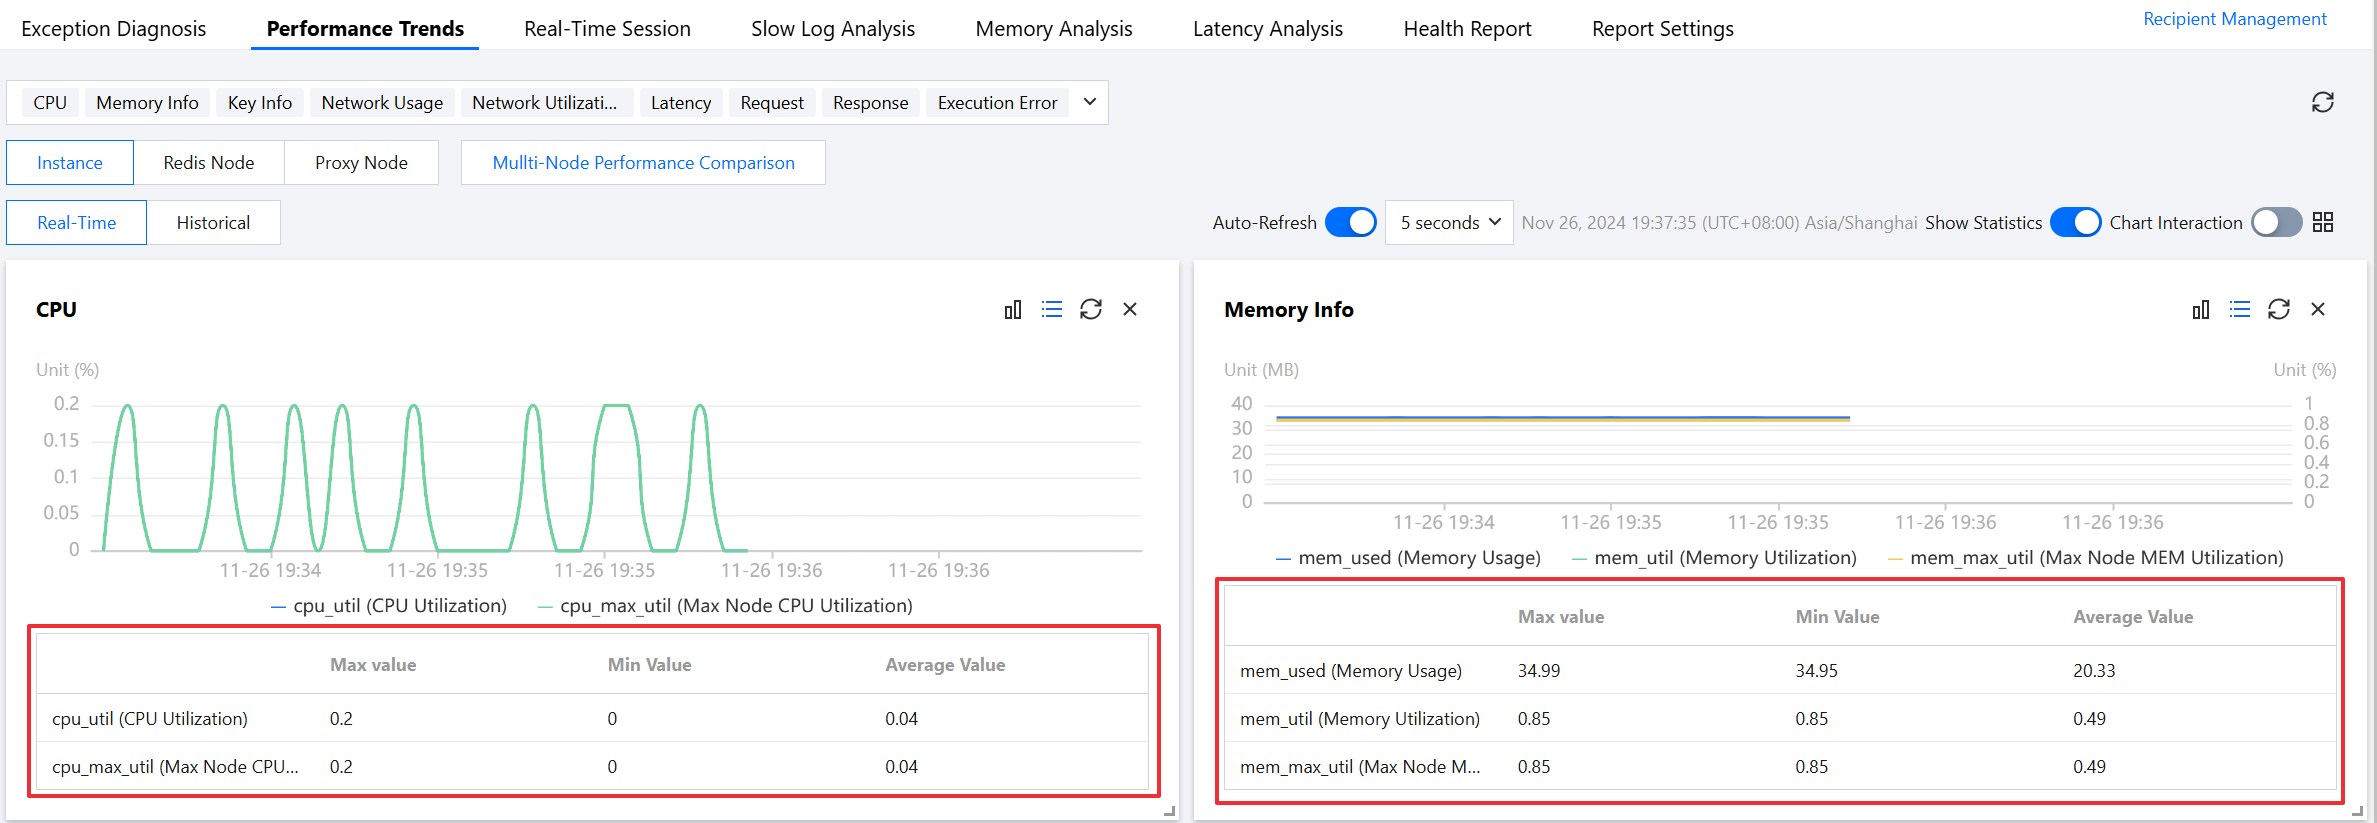
Displaying Monitoring Metric Data in Chart Format
On the right side of the page, click Show Statistics to display the maximum, minimum, and average statistics of each monitoring metric in table format below the global metrics monitoring chart.
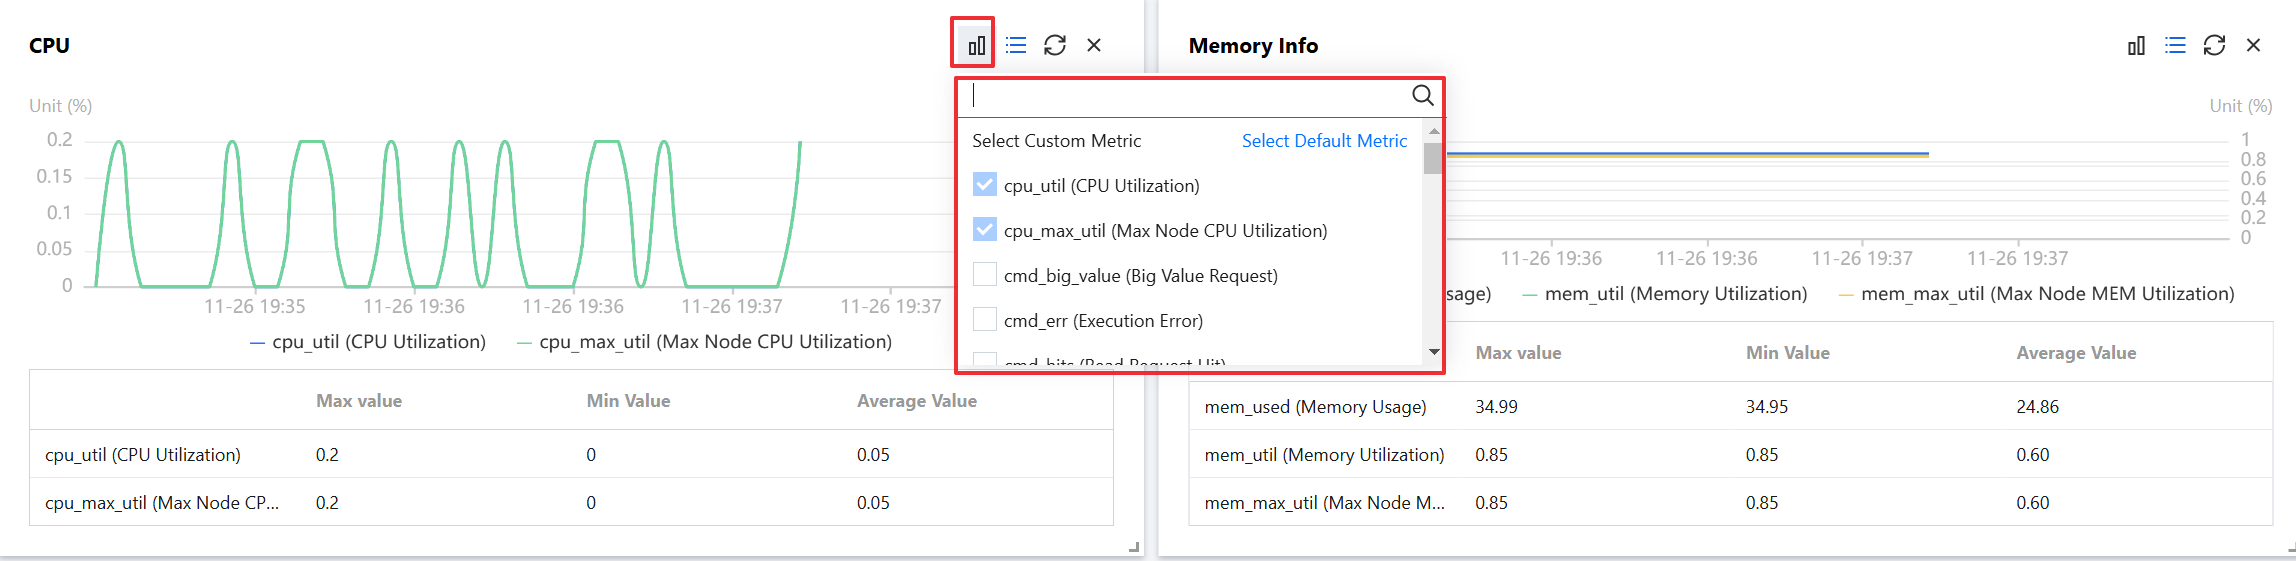
At the top right of the single metric monitoring chart, click
to display the maximum, minimum, and average statistics of that monitoring metric in table format.
Custom Monitoring Metric Comparison Analysis
At the top right of any monitoring view, click
to add other types of monitoring metrics for comparison view and analysis.
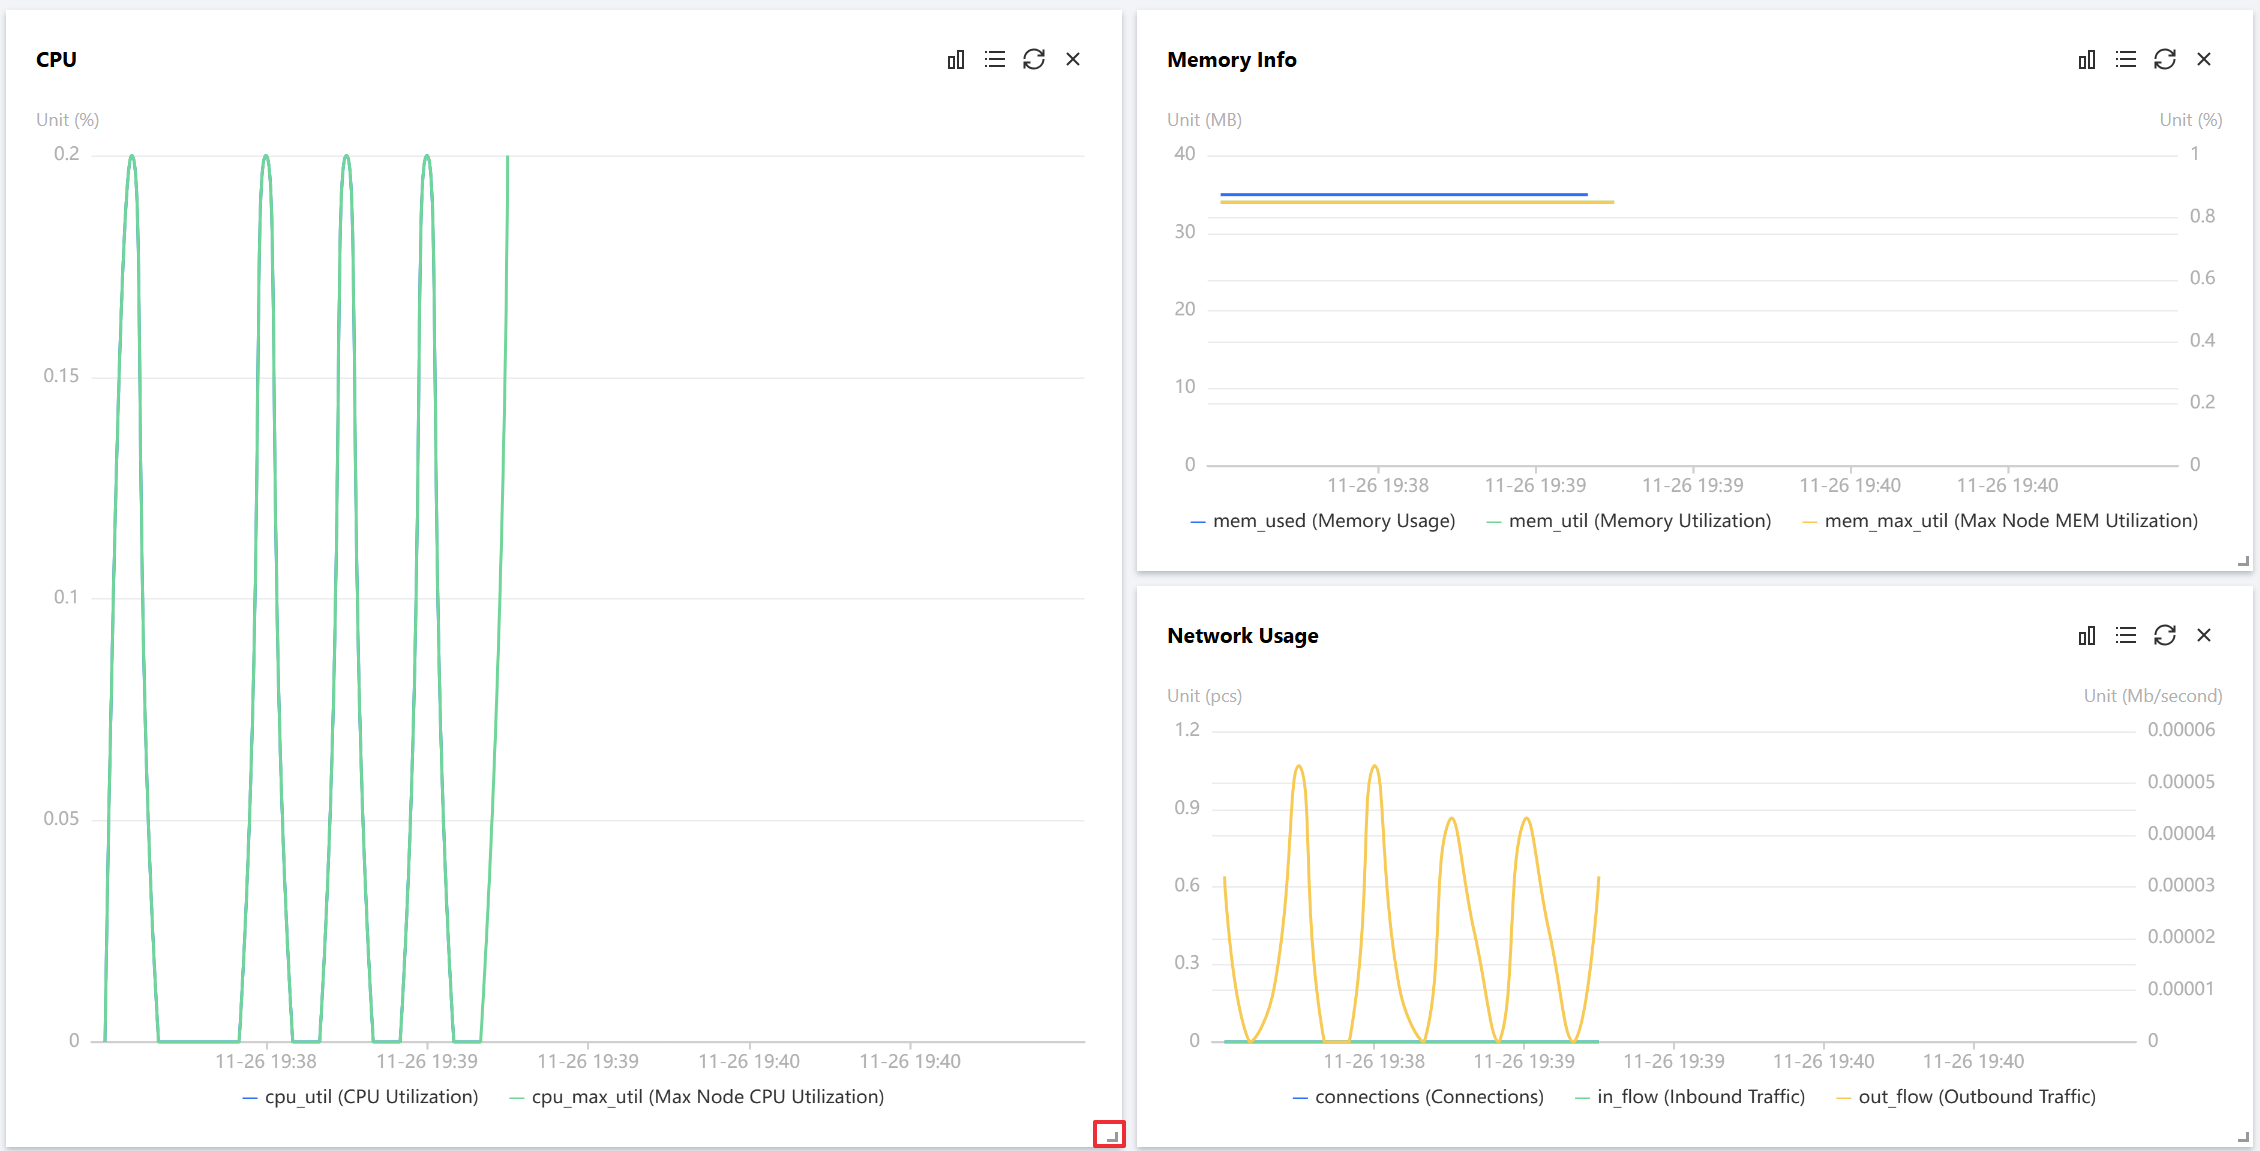
Switching between Single-Column and Double-Column Display Modes for the Monitoring View
Click
on the right of chart linkage in the top right to switch between single-column mode and double-column mode. Refer to the diagram below for single-column mode.
Dragging and Dropping Monitoring View Freely
You can drag and drop the monitoring views freely. Click the border of a monitoring view with the mouse pointer to drag it. You can adjust the order of the monitoring views flexibly according to the Ops scenario, making it easy for efficient viewing and analysis.
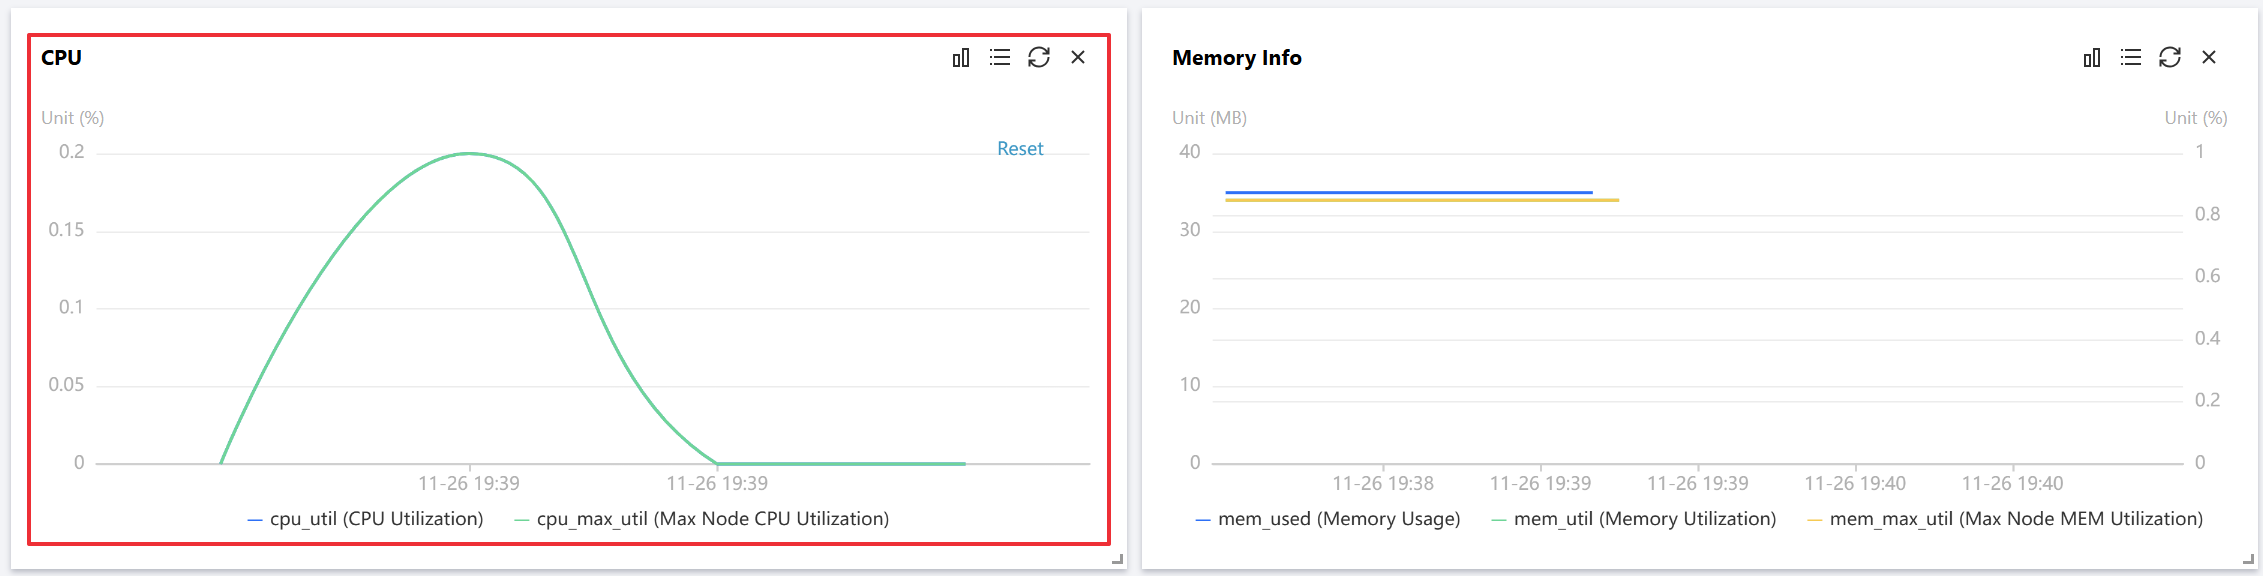
Fine-Grained View of Monitoring Chart
Drag the mouse pointer to select the time period to zoom in on a single monitoring chart for a fine-grained trend display. Click Reset to restore.
Zooming in Monitoring View
Drag the icon at the bottom right of any monitoring chart to stretch and zoom in the image freely, making it easier to display the trend chart of the metrics more clearly.