The SQL optimization feature enables you to optimize SQL statements in just a few clicks and provides the corresponding execution plan interpretation and optimization suggestion. It is suitable for scenarios such as slow SQL statement optimization, pre-release code review, and self-check.
This feature provides expert suggestions about SQL optimization and supports many database management features, including viewing database table structures or executing/modifying SQL statements in the console. It helps you optimize all aspects of SQL statements and allows you to manipulate databases in the same way as you do in a database client tool.
You can manually enter SQL statements and analyze them to get their performance evaluation results and optimization suggestions.
The visual execution plan feature is added to help you understand the entire SQL statement execution process and details. In this way, you can easily get a grasp of your statement performance overheads.
Note:
Currently, SQL optimization is supported only for TencentDB for MySQL (excluding basic single-node instances), TDSQL-C for MySQL, and self-built MySQL databases.
Optimizer execution
1. Log in to the DBbrain console and select Performance Optimization on the left sidebar. On the displayed page, select a database type and an instance at the top, and select the SQL Optimization tab.
2. On the SQL Optimization tab, you can view the information of database tables, SQL statements, and SQL execution.
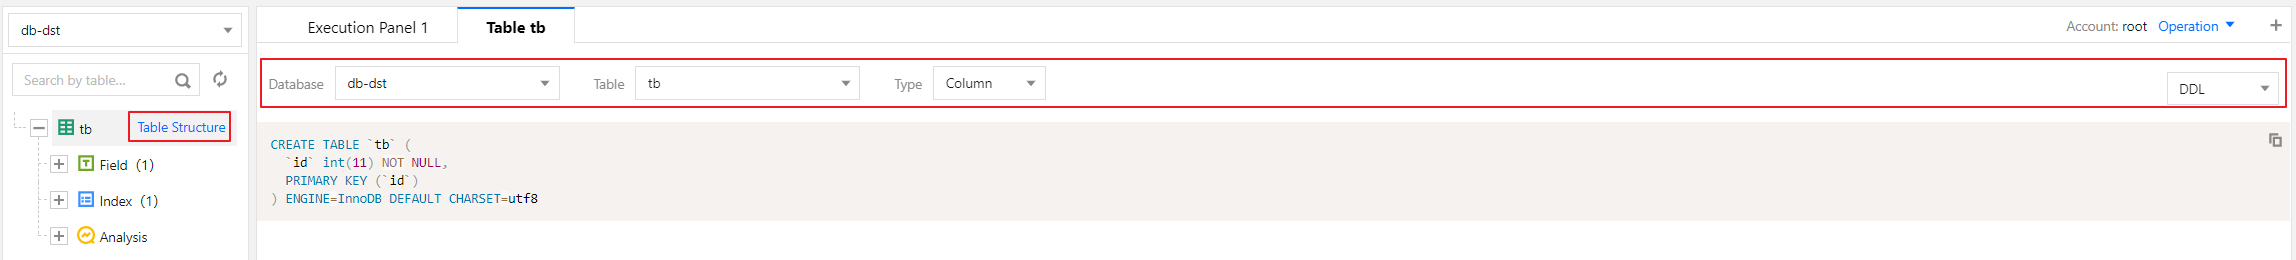
The left section displays databases, tables, fields, and index names. You can filter databases by database name and click Table Structure next to a table to view its details.
The right section displays SQL details. You can filter data by database, table, or type and view data in the Table or DDL mode.
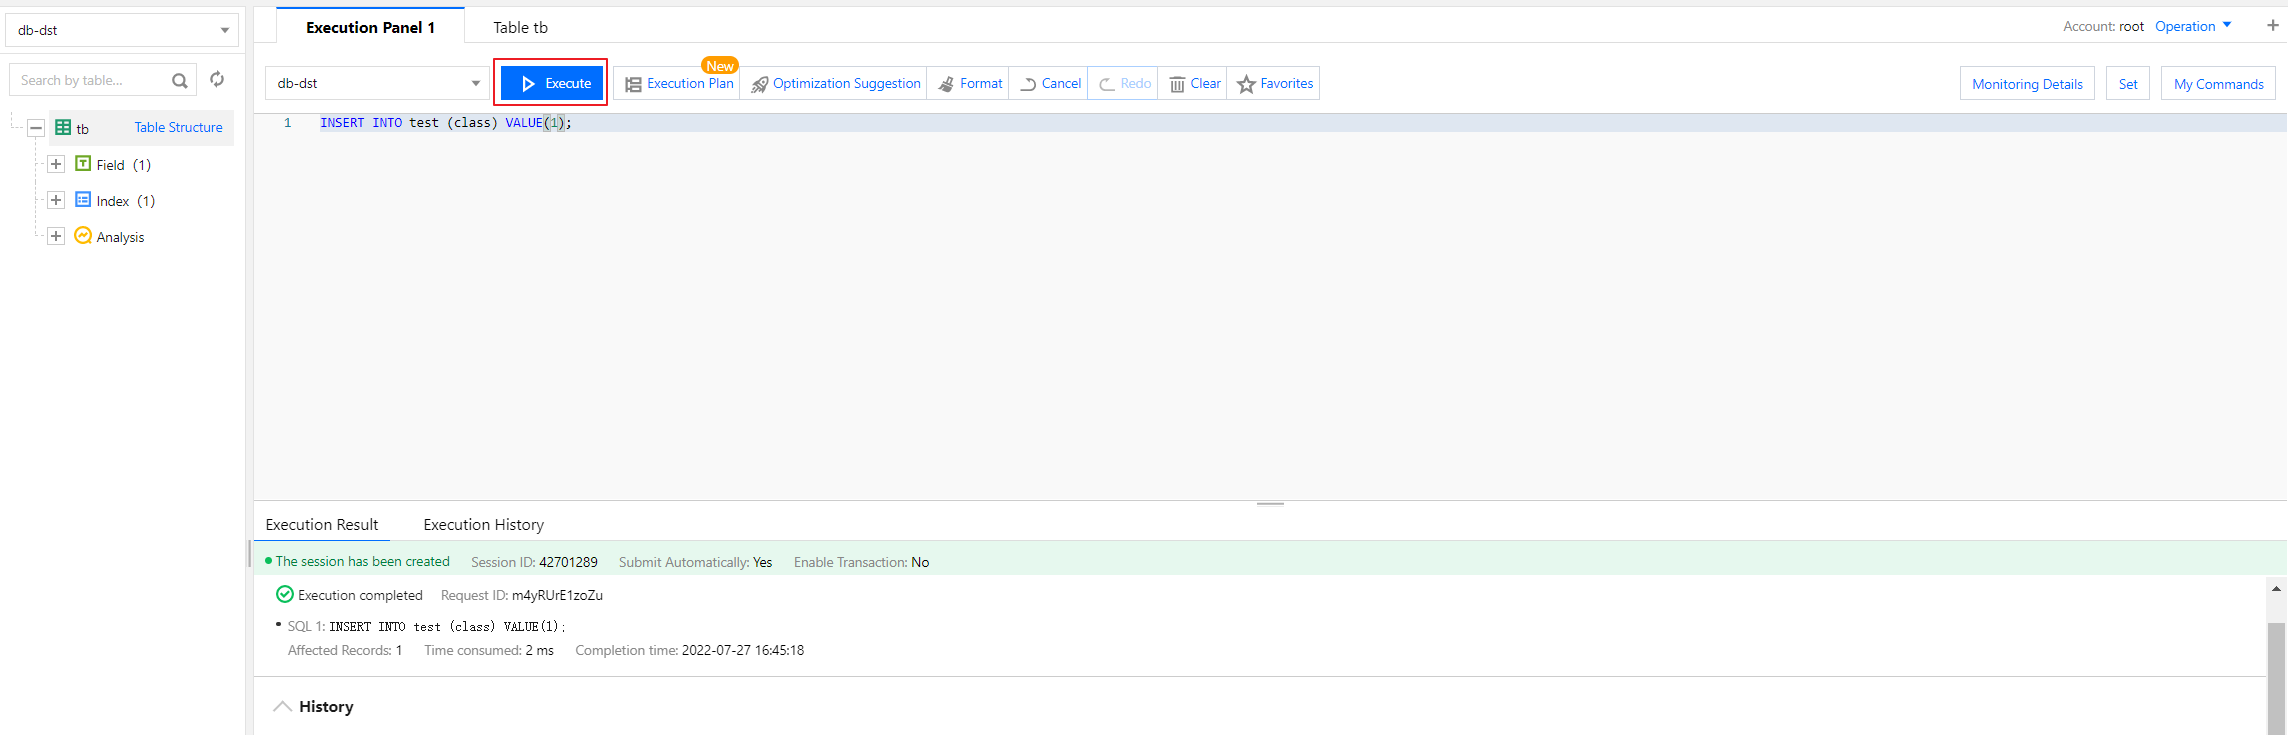
3. On the execution panel, you can enter or paste a SQL statement to execute it, format it, or view its execution plan and optimization suggestion. You can also clear it or cancel or redo your operations.
Each operation can be controlled with a keyboard shortcut, which can be viewed by hovering over the corresponding button.
Click Execute to execute the entered SQL statement. You can also view the Execution Result and Execution History or clear the record of the execution result.
Note:
You can only view the SQL execution plan if you are not logged in. To perform operations such as SQL optimization, log in to the target database instance first.
Click Execution History to view the SQL execution history. You can also switch to view the history of the current session or all sessions.
Click Execution Plan to view the SQL execution plan details and optimization suggestion. For more information, see Visual execution plan.
Click Format to format the selected SQL statement as shown below:
Click Optimization Suggestion to view the optimization suggestion for the SQL statement.
In the Optimization Comparison window, you can view the SQL statement's execution plan, index advice, rewriting advice, table structure, and performance before and after optimization.
The performance of an optimized SQL statement is estimated based on the analysis of the statistics of database tables related to the statement, the OPTIMIZER_SWITCH configuration, and the index selectivity. A chart is used to visually show the decrease in the performance. You can also compare the execution plans before and after SQL optimization to further verify the optimization results.
4. On the right of the execution panel, you can view the monitoring details, set the SQL query conditions, and view historical commands.
Click Monitoring Details on the right to view the monitoring information of the database instance.
Click Set on the right to set specific query conditions, including the Execution Timeout Period and Max Returned Rows.
Click My Commands on the right to view your favorites and system Ops SQL templates, including parameter/metric, user, information_schema, and other templates. These templates help you execute common Ops SQL statements easily and quickly.
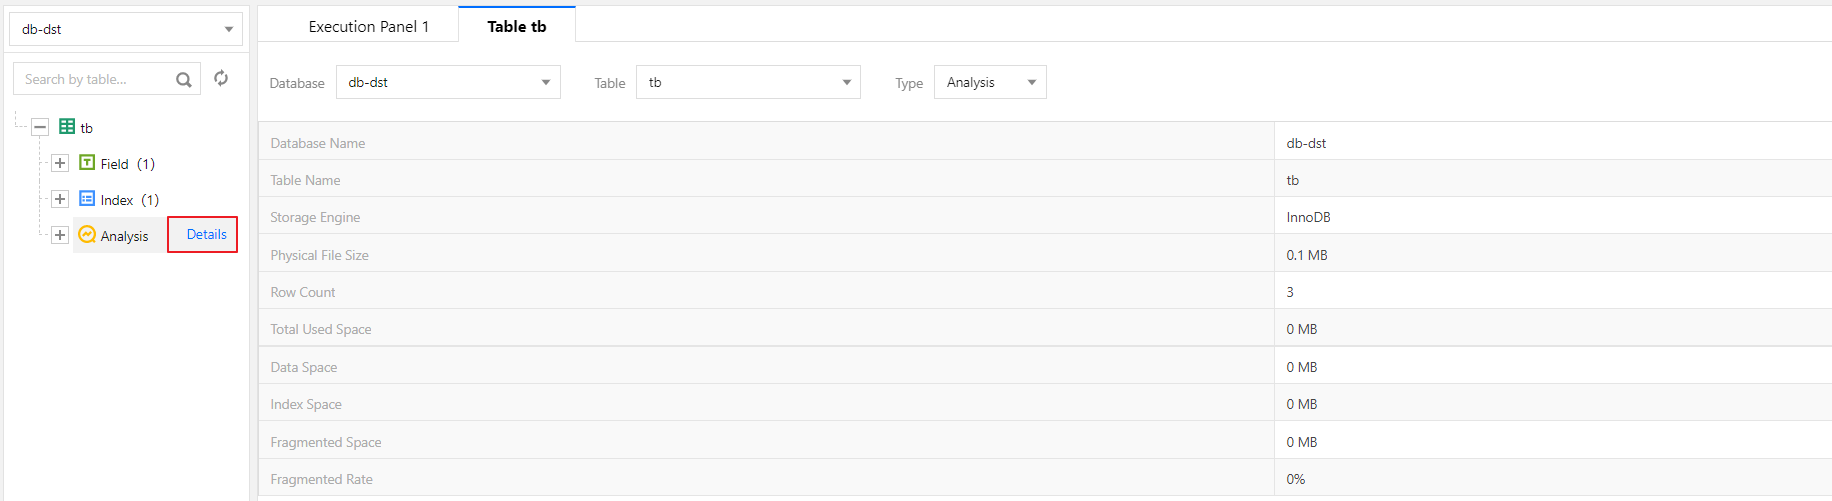
5. View the table analysis data.
Select the target table on the left and click the Analysis tab to view the table analysis data on the right.
Visual execution plan
1. Log in to the DBbrain console and select Performance Optimization on the left sidebar. On the displayed page, select a database type and an instance at the top, and select the SQL Optimization tab.
2. On the SQL Optimization tab, you can see the button bar on the execution panel.
3. The first button on the right of the Execute button can start the visual execution plan feature.
Enter or select the SQL statement on which you want to perform a visual analysis on the execution panel.
Click Execution Plan to display the visual execution plan effect.
Click the small button in the base table block to view the structure of the table.
Click the small button in the step block to get the SQL information of the step.
Click each information block to get the node details of the step, which may vary by node.
The statement execution plan helps you better understand which steps generate temp tables or file sorting.
Different index types are reflected by different colors based on the performance.
Depending on the complexity of your statements, different visual matrix effects will be displayed. If there is too much content in the visual graphical area, you can use the scaling icons to freely adjust the displayed area or enable the full screen mode.